
Monitoring Large Cloud-Based Systems
Mauro Andreolini
1
, Marcello Pietri
2
, Stefania Tosi
2
and Andrea Balboni
2
1
Department of Physics, Computer Science and Mathematics, University of Modena and Reggio Emilia,
Via Campi 213/a, 41125, Modena, Italy
2
Department of Engineering ”Enzo Ferrari”, University of Modena and Reggio Emilia,
Via Vignolese 905/b, 41125, Modena, Italy
Keywords:
Monitoring Architecture, Cloud Computing, Large-scale, Scalability, Multi-tenancy.
Abstract:
Large scale cloud-based services are built upon a multitude of hardware and software resources, disseminated
in one or multiple data centers. Controlling and managing these resources requires the integration of several
pieces of software that may yield a representative view of the data center status. Today’s both closed and
open-source monitoring solutions fail in different ways, including the lack of scalability, scarce representativ-
ity of global state conditions, inability in guaranteeing persistence in service delivery, and the impossibility of
monitoring multi-tenant applications. In this paper, we present a novel monitoring architecture that addresses
the aforementioned issues. It integrates a hierarchical scheme to monitor the resources in a cluster with a
distributed hash table (DHT) to broadcast system state information among different monitors. This archi-
tecture strives to obtain high scalability, effectiveness and resilience, as well as the possibility of monitoring
services spanning across different clusters or even different data centers of the cloud provider. We evaluate the
scalability of the proposed architecture through a bottleneck analysis achieved by experimental results.
1 INTRODUCTION
Cloud Computing is the most adopted model to sup-
port the processing of large data volumes using clus-
ters of commodity computers. According to Gartner,
Cloud Computing is expected to grow 19% in 2012,
becoming a $109 billion industry compared to a $91
billion market last year. By 2016, it is expected to
be a $207 billion industry. This esteem compares to
the 3% growth expected in the overall global IT mar-
ket. Several companies such as Google (Dean and
Lopes, 2004), Microsoft (Calder et al., 2011), and Ya-
hoo (Shvachko et al., 2010) process tens of petabytes
of data per day coming from large data centers host-
ing several thousands nodes. According to (Gantz and
Reinsel, 2012), from 2005 to 2020, the digital uni-
verse will grow by a factor of 300, from 130 EB to
40000 EB, or 40 trillion GB (more than 5200 GB per
person in 2020). From now until 2020, the digital uni-
verse will about double every two years.
In order to satisfy service level agreements (SLAs)
and to keep a consistent state of the workflows in this
tangled layout, such growing large infrastructures are
usually monitored through a multitude of services that
extract and store measurements regarding the perfor-
mance and the utilization of specific hardware and
software resources. These monitoring tools are op-
erated by cloud providers and offered to the services’
owners, but also ad-hoc monitoring solutions are de-
signed in order to satisfy the requirements of big com-
panies which own their private cloud infrastructures.
For example, Sony uses the closed-source Zyrion Tra-
verse database (Zyrion, 2013) to claim the monitor-
ing of over 6000 devices and applications over twelve
data centers across Asia, Europe and North America.
The virtual data layer within the solution collects half
a million resource data streams every five minutes.
This scenario requires the design of an advanced
monitoring infrastructure that satisfies several proper-
ties:
1. Scalability. It must cope with a large amount of
data that must be collected, analyzed, stored and
transmitted at real-time, so as to take timely cor-
rective actions to meet SLAs.
2. Effectiveness. It must provide an effective view
of the system state conditions that can be used for
management purposes and to identify the causes
of observed phenomena. It must also adapt its
monitoring functions to varying conditions in or-
der to accommodate variable resources, system
errors, and changing requirements.
341
Andreolini M., Pietri M., Tosi S. and Balboni A..
Monitoring Large Cloud-Based Systems.
DOI: 10.5220/0004794003410351
In Proceedings of the 4th International Conference on Cloud Computing and Services Science (CLOSER-2014), pages 341-351
ISBN: 978-989-758-019-2
Copyright
c
2014 SCITEPRESS (Science and Technology Publications, Lda.)

3. Resilience. It must withstand a number of com-
ponent failures while continuing to operate nor-
mally, thus ensuring service continuity. Single
points of failure must be avoided for providing
persistence of service delivery.
4. Multi-tenancy. It must be able to monitor appli-
cations distributed over different data centers in
order to better perform troubleshooting activities
in dynamic environments such as cloud scenarios.
We state that none of the existing solutions ful-
fills all these requirements. In this paper we over-
come state-of-the-art limits with a novel open-source
monitoring infrastructure. We propose a hybrid ar-
chitecture for a quasi real-time monitoring of large-
scale, geographically distributed network infrastruc-
tures spread across multiple data centers, designed to
provide high scalability, effectiveness and resilience.
Here, the term hybrid refers to the use of two differ-
ent communication schemes: a hierarchical one and a
P2P-based one. Each data center is equipped with its
own decoupled monitoring infrastructure; each moni-
tor adopts a hierarchical scheme that ensure scalabil-
ity with respect to the number of monitored resources,
in a subset of the whole architecture. Communica-
tions between data centers are performed through the
root managers, software modules responsible for or-
chestrating the whole process. The root managers of
every decentralized monitor are connected through a
custom communication module that implements the
P2P Pastry DHT routing overlay (Rowstron and Dr-
uschel, 2001). In this way, a service distributed across
several data centers can be jointly monitored through
the appropriate root managers.The internal operations
of the monitor are geared towards effectiveness ob-
jectives. We provide real-time access to single per-
formance samples or graphs, as well as more sophis-
ticated analysis that aim at identifying system or ap-
plication states for anomaly detection, capacity plan-
ning, or other managementstudies. Every single com-
ponent in the infrastructure is designed to be resilient
to failures. Whenever possible, we enrich the exist-
ing software modules with redundancy and failover
mechanisms. Otherwise, we automatically restart the
modules in case of failure.
The rest of this paper is organized as follows. Sec-
tion 2 evaluates the current state-of-the-art in the area
of large-scale system monitoring. Section 3 describes
the design decisions supporting the described require-
ments, provides a high level architecture of the en-
tire monitoring infrastructure, motivates the choice of
the software components and discusses various im-
plementation details. Section 4 investigates the the-
oretical scalability limits of the proposed architecture
figured out from experimentalscenarios. Finally, Sec-
tion 5 concludes the paper with some remarks and fu-
ture work.
2 RELATED WORK
Current state-of-the-art monitoring tools do not guar-
antee scalability, effectiveness, resilience and multi-
tenancy objectives.
Fully centralized monitors cannot scale to the de-
sired number of resource data streams. For example,
the prototype system introduced in (Litvinova et al.,
2010), which uses Ganglia (Massie et al., 2004) and
Syslog-NG to accumulate data into a central MySQL
database, shows severe scalability limits at only 64
monitorednodes, each one collecting 20 resource data
streams every 30 seconds. Here, the main bottleneck
is related to the increasing computational overhead
occurring at high sampling frequencies. On the other
hand, lowering the sampling frequency (commonly,
once every five minutes) can make it difficult to spot
rapidly changing workloads which in turn may entail
the violation of SLAs (Keller and Ludwig, 2003).
Concerning resilience, the vast majority of both
open-source and commercial monitoring infrastruc-
tures like OpenNMS (Surhone et al., 2011), Zab-
bix (Olups, 2010), Zenoss (Badger, 2008) and Cacti
(Kundu and Lavlu, 2009) are not adequate or de-
signed to address failures, especially if combined with
the ability to gather and support millions of resource
data streams per second.
In terms of effectiveness, most open-source moni-
toring tools only partially address this aspect. For ex-
ample, Graphite (Davis, 2013) and Cacti provide only
trending analyses, Nagios (Josephsen, 2007) provides
alerting, while Chukwa (Rabkin and Katz, 2010) and
Flume (Hoffman and Souza, 2013) are designed ex-
clusively to collect resource data streams or logs.
Also current decentralized, per-data-center, hierarchi-
cal monitors such as Ganglia (Sacerdoti et al., 2003)
are limited to efficiently compute averages of mea-
sures spanning over several nodes. However, the com-
plexity of current workloads in modern data centers
calls for more sophisticated processing, such as the
identification of correlationsamong different resource
data streams, or the detection of anomalies in the
global system state.
Astrolabe (Renesse et al., 2003) is a hybrid solu-
tion that combines a hierarchical scheme with an un-
structured P2P routing protocol for distributed com-
munications as our proposal does. While it is resilient
and highly scalable in terms of data collection and
storage, it lacks in effectiveness and its manageability
is a complex task since it incurs a lot of network traf-
CLOSER2014-4thInternationalConferenceonCloudComputingandServicesScience
342

fic. Unstructured systems do not put any constraints
on placement of data items on peers and how peers
maintain their network connections and this solution
suffers from non-deterministic results, high network
communication overload and non-scalability of band-
width consumption (Lv et al., 2002).
While collection and network monitoringwere ad-
dressed in many works with significant results (Babu
et al., 2001; Cranor et al., 2003; Voicu et al., 2009),
the state-of-the-art technology in multi-tenant moni-
toring is a very niche field. In fact, none of the pre-
vious works deals with a multi-tenant environment.
At the best of our knowledge, the only open contri-
bution in this sense is given by (Hasselmeyer. and
d’Heureuse, 2010): it extends monitoring based on
data stream management systems (DSMS) with the
ability to handle multiple tenants and arbitrary data;
however it does not address resilience in terms of sin-
gle points of failure, it has no implemented prototype,
and it does not present any type of analysis to support
the proposed architectural choices.
3 ARCHITECTURE DESIGN
The early decisions that inspired the design of the
proposed architecture share four important goals: (1)
to dominate the complexity of the monitoring prob-
lem (Scalability), (2) to tune the monitoring activities
according to different objectives (Effectiveness), (3)
to avoid single points of failure (Resilience), and (4)
to monitor services spanning across different clusters
or data centers (Multi-tenancy). This section details
the architecture design of our proposal, with partic-
ular emphasis to the design decisions that allow the
achievement of the mentioned goals.
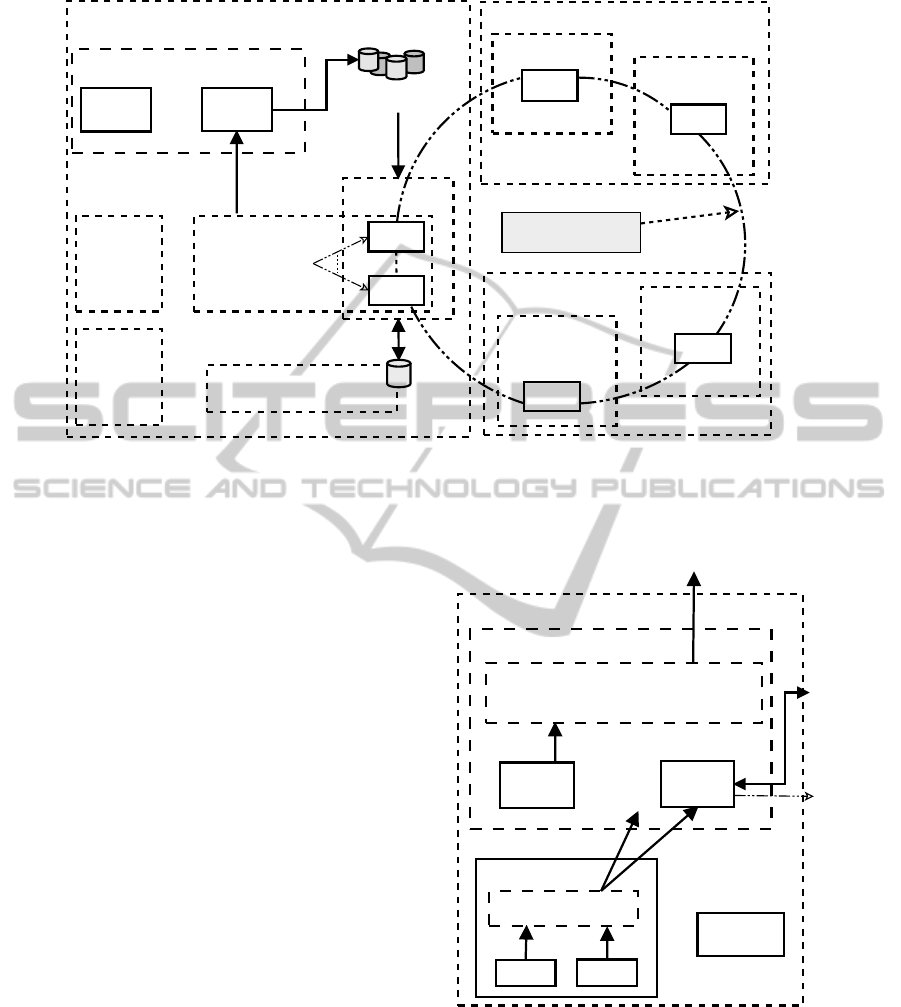
3.1 High Level Architecture
Figure 1 and Figure 2 present the high level architec-
ture of the monitoring infrastructure.
We propose a hybrid architecture using a hier-
archical communication scheme to ensure scalabil-
ity and a P2P-based communication scheme to allow
multi-tenancy. In our opinion, a hybrid solution is the
only viable alternative for scaling to an arbitrary num-
ber of data centers and the huge problem size makes
it literally impossible to deploy any kind of central-
ized infrastructure. Even worse, service centraliza-
tion would not be fault-tolerant. For these reasons,
each cluster in our architecture is equipped with an
independent monitoring infrastructure.
In order to scale to millions of data streams per
sample interval, it is mandatory to shift preliminary
computations (such as the sampling of a resource and
the performing of sanity checks on sampled data) as
close as possible to the edge of the monitored infras-
tructure. Failure to do so would result in a system
that unnecessarily processes potentially useless data.
For this reason, collected resource data streams are
initially filtered (or marked as invalid, anomalous) on
the monitored nodes where a collection agent receives
the samples from several probe processes. Probe pro-
cesses are responsible for collecting periodically per-
formance and/or utilization samples regarding a set
of hardware and software resources. The collection
agent performs preliminary validity checks on them,
that are executed through dynamic, pluggable mod-
ules that receive in input the data stream and respond
with TRUE or FALSE. If at least one check fails, the
stream is tagged as invalid, but it is never discarded;
this facilitates later debugging operations. The fol-
lowing checks are implemented now: missing value,
value out of range, sequence of null values.
Then, the collection agent updates the resource
data streams and sends them to a set of associated
collector nodes. We consider both the sending of
uncoded (without compression) and coded (lossless
compression) data. A detailed description of the col-
lection agent has been presented by the authors in
(Andreolini et al., 2012).
The collector node is the main component of the
distributed cluster data filter. It receives the checked
and coded resource data streams, performs the neces-
sary decoding, applies low cost analyses on decoded
data, and stores their results for a real-time plot or
further analysis. In the former case, processing stops
and the user is able to see immediately the behavior
of the resource data streams. In the latter case, data is
made available to the distributed analyzer system. Its
purpose is to compute more sophisticated analyses on
the resource data streams, such as aggregation of in-
formation coming from different clusters, identifica-
tion of correlated components in the system, anomaly
detection and capacity planning. The data streams re-
sulting from these analyses are persistently stored in
the distributed data storage. Here, data is available
as (key, value) pairs, where “key” is a unique iden-
tifier of a measure and “value” is usually a tuple of
values describing it (e.g., timestamp, host name, ser-
vice/process, name of the monitored performance in-
dex, actual value).
The information regarding the data center asset
is stored in a distributed configuration database. In
this way, we strive to avoid possible inconsistencies
mainly due to a service being migrated or receiving
more resources. The monitoring infrastructure as-
sociates data streams to the identifiers of the corre-
MonitoringLargeCloud-BasedSystems
343
Data Center
Data Center
...
...
Data Center
inter-cluster DHT
Root Management
System
...
...
User Interface
root
manager
root
manager
Distributed Analyzer System
.....
Analyzer
Node
Analyzer
Node
(key, value)
pairs
(key, value)
pairs
...
...
Cluster
Distributed Configuration
Management Database
...
Cluster
...
root
manager
Cluster
...
root
manager
Cluster
...
root
manager
...
Cluster
...
root
manager
...
Distributed
data storage
...
Cluster
Cluster
...
...
embedded
graphs
Figure 1: Monitoring system architecture overview.
sponding monitored resource.
Each monitoring infrastructure is orchestrated by
a root management system, a software component that
organizes the workflow of monitoring operations and
provides a programmable monitoring interface to the
user. All the root managers dislocated on different
data centers are interconnected by an efficient DHT
overlay routing network. In this first version of our
prototype, the other main task carried out by a root
manager is to forward early notifications of anoma-
lies in the internal state of some resources to other
interested, subscribed root managers. In this way, it is
possible to anticipate the performance degradation of
services depending on these failing resources.
We used exclusively open-source tools that can
be modified and adapted for our goals. We used
GNU/Linux Debian, Ubuntu and Fedora OSs in dif-
ferent experimental testbeds, enhanced with the soft-
ware packages from the Cloudera repository (CDH4).
The languages used for the deployment of our mod-
ules are Bash (v4.2.36), Python (v2.7), Java (v1.6),
JavaScript and C (where efficiency is needed, such as
in our modified monitor probes). The batch process-
ing framework is Hadoop, version 2.0. Our choice
is motivated by the dramatic scalability improvement
with respect to traditional RDBMS-based data storage
architectures under random, write-intensive data ac-
cess patterns (Leu et al., 2010). To avoid single points
of failure and to ensure service continuity, we enforce
redundancy of every component of the monitoring ar-
chitecture. Whenever possible, we deploy our solu-
tion using software that can be easily replicated. In
other cases, we wrap the component through custom
scripts that detect failures and restart it, in case.
...
Collection Agent
resource
Distributed cluster data filter
.......
Performance samples
Data chunks
(key, value) pairs
Distributed sample storage
(cluster)
Cluster
...
Monitored Node
Collector
Node
Collector
Node
resource
Monitored
Node
...
...
embedded
graphs
to analyzer nodes
distributed
data storage
to root
manager
Figure 2: Cluster architecture.
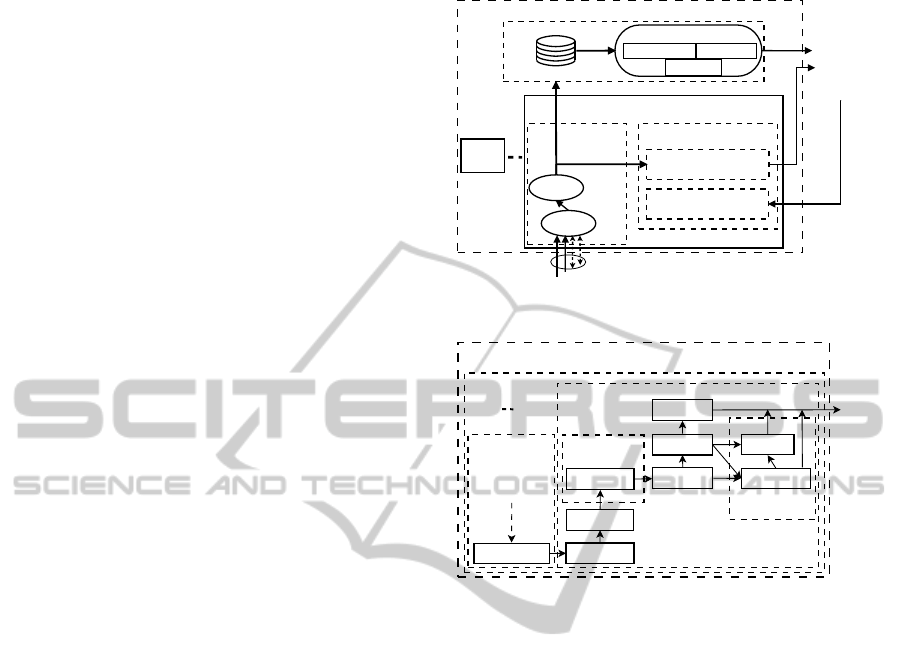
3.2 The Distributed Cluster Data Filter
The resource data streams gathered by the collection
agent are sent to the distributed cluster data filter,
shown in Figure 3. Here, a collector process receives
the checked and coded resource data streams.
The received data streams are decoded and later
CLOSER2014-4thInternationalConferenceonCloudComputingandServicesScience
344
analyzed to extract a representation of the cluster
state, thus guaranteeing the effectiveness of our mon-
itoring infrastructure. Resource data streams coming
from different nodes are processed through sophis-
ticated analyses that aim to guarantee high accuracy
and significantly reduced human intervention. In or-
der to support real-time analytics at large scale, at
this level we adopt analytic approaches having lin-
ear computational complexity and adaptive imple-
mentation. Linear solutions permit to understand sys-
tem behavior in real-time, so as to diagnose eventual
problems and take timely corrective actions to meet
service level objectives. Adaptivity allows analytic
approaches to accommodate variable, heterogeneous
data collected across the multiple levels of abstrac-
tion present in complex data center systems. Example
analyses we implemented at this stage include:
1. computing moving averages of resource data
streams, in order to provide a more stable repre-
sentation of a node status;
2. aggregating (both temporally and spatially) node
state representations to obtain global views of the
cluster state conditions;
3. extracting trends for short-term prediction of re-
source consumption and of cluster state condi-
tions;
4. detecting state changes and/or anomalies occur-
ring in data streams for the erase of alarms and
the adoption of recovering strategies;
5. correlating node state representations in order to
identify dependencies among different nodes in
the cluster and to exclude secondary flows.
Nodes and cluster state representations are then
sent to two different storages: one for real-time
plotting of the decoded and analyzed resource data
streams, and one for non-real-time later processing at
highest levels.
The former storage for real-time plotting is han-
dled by OpenTSDB (Sigoure, 2010), a software for
the storage and configurable plotting of time se-
ries. We have chosen OpenTSDB because it is open-
source, scalable, and it interacts with another open-
source distributed database, HBase (George, 2011). It
retains time series for a configurable amount of time
(defaults to forever), and it allows to create custom
graphs on the fly. We have modified few parts of
OpenTSDB (shown in Figure 4) in order to plot a sim-
ple but real-time prediction of resources trend. This
analysis is performed using a linear regression and a
Gaussian kernel.
The latter storage for non-real-time processing,
called data synk, receives data destined to further
Collector node
TSDB
Collector
(key,value)
pairs
Structured
storages
(forever)
Distributed cluster data filter
MapReduce jobs
data sink (temp)
data
chuncks
Distributed sample storage (cluster)
data streams and management
http GUI
sample manager
Collector
node
aggregation
prediction
detection
comm.s
decoding
Figure 3: Distributed cluster data filter.
TSDB
http GUI
querystring
HttpQuery
Parsing
Query
MetricForm
GraphHandler
TsdbQuery
Plot
Init plot
Dump
Gnuplot
graphs
Predict
Plot
...
...
...
...
...
...
Figure 4: OpenTSDB schema improvements for prediction.
processing performed by the distributed analyzer de-
scribed in the following subsection. This solution re-
duces the number of files generated from one per node
per unit time to a handful per cluster (Andreolini et al.,
2011). To enhance the performance of the storage en-
gine, we chose to pack the resource data streams (few
bytes per each) in larger chunks (64KB by default)
and to write them asynchronously to a distributed file
system that can be scaled to the appropriate size by
easily adding back-end nodes. In order to provide
a homogeneous software layer (eg., Hbase coupling)
and an open-source platform, and in order to support a
map-reduce paradigm, the best possible choice is the
Hadoop Distributed File System (HDFS). It allows
extremely scalable computations, it is designed to run
on commodity hardware, it is highly fault-tolerant, it
provides high throughput access to application data,
and it is suitable for applications that have large data
sets.
Every time new samples are added to the resource
data streams and representations, an extra overhead is
paid due to data storage. As previous literature shows,
in this scenario characterized by frequent, small, ran-
dom database requests (Andreolini et al., 2011), write
operations to secondary storage do suffer from scal-
ability issues. To reduce this overhead, write oper-
MonitoringLargeCloud-BasedSystems
345

ations should be grouped and batched to secondary
storage. We believe that the map-reduce paradigm
(Dean and Lopes, 2004) is well suited to this purpose.
If needs be, several collectors can be added to scale
the acquisition process to the desired number of re-
source data streams. The collector is designed to scale
up to thousands of data streams, providing that limi-
tations on the maximum number of TCP connections
and open files can be raised. In GNU/Linux, this can
be easily achieved by changing some system param-
eter and/or by recompiling the Linux kernel and the
GNU C library.
3.3 The Distributed Analyzer System
The distributed analyzer system is composed by a set
of analyzer nodes (Figure 5). Each analyzer node runs
arbitrary batch jobs that analyze the state representa-
tion data streams of nodes and clusters. At this stage,
we admit the implementation of more computational
expensive analyses with respect to those applied at
the cluster level. Now, analyses are applied only to
small sets of representative information (i.e., nodes
and cluster state representations) from which we re-
quire to obtain relevant information for management
with high levels of accuracy.
Analyzer node
(key,value)
pairs
Data analysis
sort, group by key
(key, vector) pairs
(key,value)
pairs
compile
(key,value)
pairs
Data
analysis
Data
analysis
script
__________
__________
__________
__________
__________
map
reduce
reduce
map
Figure 5: Analyzer node.
For example, analyses implemented at data center
level are:
1. aggregation of cluster state representations to ob-
tain global views of the data center state condi-
tions;
2. long-term prediction of clusters and data center
state conditions computed at different temporal
scales and with different prediction horizons;
3. detection of changes and anomalous events in data
center state conditions with the identification of
which node(s) in the different clusters is the cul-
prit.
The batch jobs first read the necessary data
streams (map) from the distributed cluster data filter
storages, and then run the appropriate scripts (reduce)
for analysis. The adoption of map-reduce allows to
perform sophisticated analysis over the collected re-
source data streams in a scalable fashion with com-
modity hardware (or even in a leased platform such
as Amazon EC2). On the contrary, the most advanced
state-of-the-art monitors compute at most moving av-
erages of regular windows of past samples. To the
best of our knowledge, this paper represents one first
step beyond this limit in a quasi real-time scenario.
The result of the map-reduce paradigm is a re-
duced set of (key, value) pairs that is written to the
distributed data storage. The goal shared by these
operations is to compute a reduced state information
of each cluster, and to produce few figures of merit
that show the health status of the entire data center.
Through these results, it is possible to tell whether
the service is about to misbehave or not and, in the
former case, also to tell which resource(s) and which
node(s) are the culprits.
We choose the Pig framework for the implemen-
tation of the analysis scripts (Olston et al., 2008). Pig
offers richer data structures over pure map-reduce, for
example multivalued and nested dictionaries. Each
Pig script is compiled into a series of equivalent map-
reduce scripts that process the input data and write the
results in a parallel way. Our scripts implement the
analyses mentioned above. Further analyses can be
easily supported by our architecture and implemented
to satisfy more sophisticated requests.
3.4 The Distributed Data Storage
Both the reduced streams representing the system
state and the resource data streams processed by
OpenTSDB must be written into a data storage. For
the sake of performance, it is possible to avoid the
reuse of the same structured storage. As matter of
facts, the data storage:
• must scale with an increasing number of data
streams;
• must be fault tolerant;
• should be designed towards the data management.
In this context, we choose Apache HBase (George,
2011) also because of the fact that it includes the ho-
mogeneity and the reuse of components. In our ar-
chitecture, the HBase storage is responsible to pre-
serve all the analyzed information about nodes, clus-
ters and data center. Apache HBase is a distributed
column-oriented database built on top of HDFS, de-
signed from the ground-up to scale linearly just by
adding nodes. It is not relational and it does not sup-
port SQL, but thanks to the proper space management
properties, it is able to surpass a traditional RDBMS-
based system by hosting very large and sparsely pop-
CLOSER2014-4thInternationalConferenceonCloudComputingandServicesScience
346
ulated tables on clusters implemented on commodity
hardware.
3.5 The Distributed Configuration
Database
In the proposed architecture, a configuration database
is needed to store all information related to the asset
of a cluster. Asset-related information includes a de-
scription of the resource metadata (name, id), place-
ment (IP of the hosting node or virtual machine), sam-
pling period, and a description of the time interval
during which the resource is supposed to be assigned
to a service. We think that it is a good idea to use off-
the-shelf Configuration Management DataBase Sys-
tems (CMDBs). A CMDB is a repository of informa-
tion related to all the components of an information
system, and contains the details of the configuration
items in the IT infrastructure. However, the majority
of CMDBs is not natively fault tolerant. We address
this shortcoming by replicating both its Web front-end
and DB back-end.
The configuration management database of our
choice is OneCMDB. It is an open-source CMDB
for data centers that can store configurations such as
hardware, software, services, customers, incidents,
problems, RFCs and documents. OneCMDB con-
forms to IT Management best practice declared by
the Information Technology Infrastructure Library.
It adopts a client-server paradigm and it is used in
large production environmentswith thousands of con-
figuration items. An enhanced graphical user inter-
face enables more effective system operations. Scal-
ing and fault tolerance are not included in the ma-
jority of CMDBs, including OneCMDB. To address
these shortcomings, we replicate both its front-end
and back-end. The front-end is replicated through
highly scalable Linux Virtual Server (LVS). The ar-
chitecture of the server cluster is fully transparent to
root managers, and the root managers interact as if
it was a single high-performance virtual server. The
back-end is replicated through an off-the-shelf, load
balanced, master-slave MySQL setup (v. 5.1).
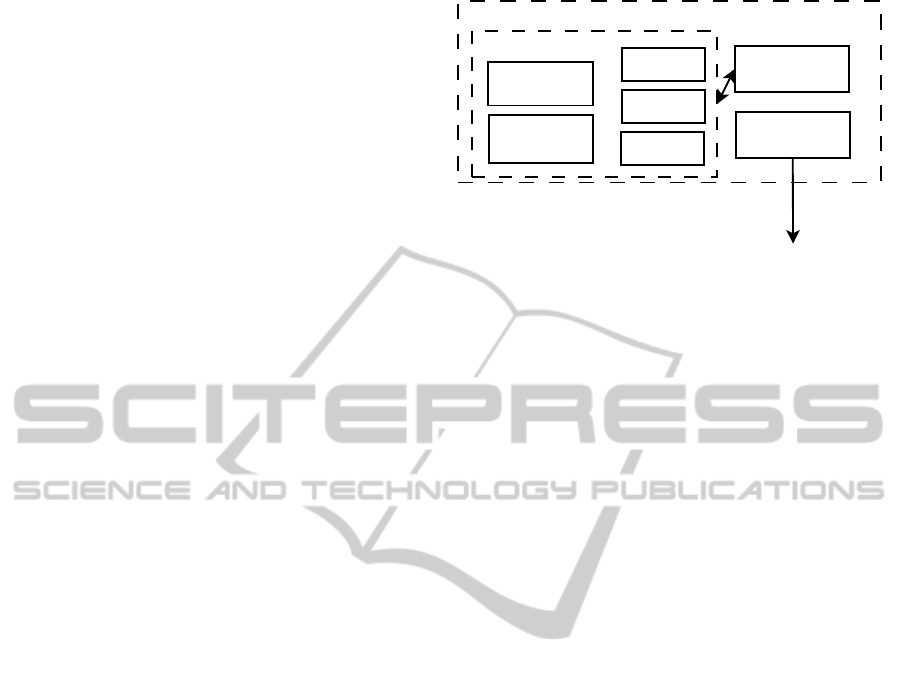
3.6 The Root Management System
As shown in Figure 6, the root management system is
composed of three distinct areas: orchestration, com-
munication and failover.
The orchestration module is the heart of the mon-
itoring system since it orchestrates the operations of
the other aforementioned components (collector, data
filter, analyzer). One of its main tasks is to trigger and
Root management system
Communication
System
analyzer
Distributed
cluster data
filter
DHT
User
Service
orchestration
Failover
To another
failover
module
CMDB
Figure 6: The root management system.
to abort the execution of batch jobs in the distributed
cluster data filter and in the analyzer nodes.
The communication module is a simple messag-
ing system used to interact with the other compo-
nents of the monitoring architecture in order to com-
municate relevant information (such as anomalies in
some resource state) to other monitoring systems dis-
located in different data centers. The root manager
node also receives commands from the user interface;
these commands are forwarded to and processed by
the orchestration module. The user interface is basi-
cally a Web-based application running on any selected
node. It manages the resources owned by an applica-
tion and provides a programmabledashboard with fig-
ures of merit, diagrams and configuration parameters
(monitored nodes, resources, performance indexes,
sampling intervals). Each cluster and each monitored
process is represented using embedded OpenTSDB
graphs, while the system view is represented using
a similar but customized interface that supports also
long-term predictions, aggregation analysis, detection
and capacity planning.
The failover module ensures fault tolerance by
identifying which root managers are compromised
and by restoring a safe state. To this purpose, each
root manager runs part of the replica of the other root
managers in the same data center. If a root manager
fails, the replica becomes the master until the former
one is restored.
When a service is installed on the nodes, the col-
lection and analysis processes supply this information
to the root management system, which stores it into
the distributed configuration database. At each ap-
plication deployment, a list of the involved nodes is
defined. A unique key is associated to this list; both
the key and the list are shared through the DHT with
each root management system. The root management
system responsible for the largest number of involved
nodes selects its best root manager on the basis of
multiple configurable metrics. Finally, the selected
root manager becomes the service leader.
MonitoringLargeCloud-BasedSystems
347

The root managers are connected as previously
shown in Figure 1. Each data center is composed by a
set of root manager nodes connected through a Pastry-
based Distributed Hash Table (DHT). We chose Pas-
try (Rowstron and Druschel, 2001) because it is a
generic, scalable and efficient substrate for P2P appli-
cations that forms a decentralized, self-organizingand
fault-tolerant overlay network. Pastry provides ef-
ficient request routing, deterministic object location,
and load balancing in an application-independent
manner. Furthermore, it provides mechanisms that
support and facilitate application-specific object repli-
cation, caching, and fault recovery. The DHT com-
munication module implements all the needed over-
lay routing functions.
The root management system is built upon a set of
custom Python and Java modules. The DHT is imple-
mented through the freepastry libraries. The publish-
subscribe mechanism used to broadcast alerts to the
interested root managers is implemented through
Scribe (Castro et al., 2002). We previously dis-
cussed these aspects from a security point-of-view in
(Marchetti et al., 2010).
We implemented the user interface using the
Django MVC framework and the JQuery library to
enhance the presentation of data. The responsiveness
of the application is improvedthrough the adoption of
AJAX-based techniques and the Web server Apache
v.2.2.
4 ANALYSIS
We perform experimental analyses for evaluating the
ability of the proposed monitoring architecture in
satisfying all requirements of scalability, effective-
ness, resiliency and multi-tenancy. Due to the lim-
ited space, in this section we only report analysis re-
sults about the scalability of our solution. We evaluate
the scalability of the proposed architecture in terms of
number of monitored resource data streams. In partic-
ular, we aim to find out:
• howmany resource data streams can be monitored
per node (intra-node scalability);
• how many nodes can be monitored in a cluster
(intra-cluster scalability).
Highest level scalability (intra-data center scala-
bility) is left for future extensions and strongly de-
pends on both resource behaviors and aggregation re-
sults obtained through analytics computed in the dis-
tributed analyzer system. In this paper, we used the
Amazon EC2 IaaS platform. In the considered in-
frastructure, the backing storage is shared across the
instances (EBS), and the theoretical network connec-
tivity is up to 1Gbps. The virtual machines are run-
ning instances of the TPC-W and RUBiS benchmark
suites. MapReduce jobs queries are used for data
distribution and analysis. We perform Map-Reduce
versions of several performance analyses having dif-
ferent computational costs, including the moving av-
erage and the Principal Component Analysis (PCA)
over more than 1 hour of data collected from 2048
monitored nodes. We emphasize that the results are
strongly influenced by the resource consumption of
the TSDB component, and the tuning of this trade-off
is out of the scope of this paper. However, we measure
that the PCA (i.e., the most computational expensive
analysis) requires an average of 5 minutes when com-
puted over 8 collector nodes using around the 85% of
CPU (the 12.5% was used for collector process). This
result shows that the behavior of a single cluster dur-
ing the collection of over more than 6M of resource
data streams per second can be analyzed (in batches)
within quasi real-time constraints.
In each monitored node, one probe is dedicated to
system-related performance monitoring through the
output of the vmstat and sar monitors. The remain-
ing probes are process-related through pidstat and
nethogs2 monitors. This system probe collects 25 dif-
ferent performance indexes, while each process probe
collects 23 different resource data streams. The sam-
pling interval is configured at 1 second for each probe
in order to emulate the most challenging scenario.
4.1 Intra-node Scalability
In the first experimental testbed, we evaluate how
many resource data streams can be handled for each
monitored node. We use one collector node and one
analyzer node running a single script that computes
the moving average for every resource data stream.
The detail of the resources of the monitored node is
the following: micro instance, 613 MB memory, up to
2 EC2 Compute Units (Dual-Core AMD Opteron(tm)
Processor 2218 HE, cpu 2.6 GHz, cache size 1,024
KB), EBS storage, dedicated network bandwidth of
theoretically 100 Mbps per node.
Table 1 reports the average resource consumption
(percentage of CPU, memory (RAM) and network
(NET) utilization) of the collection agent as a function
of the number of monitoredresource data streams. We
performed tests on both uncoded (without compres-
sion) and coded (lossless compression) data in order
to evaluate the impact of compression on the scalabil-
ity of the different resources. Then, we evaluate how
the use of the Adaptive algorithm that we proposed
in (Andreolini et al., 2012) improves the scalability
CLOSER2014-4thInternationalConferenceonCloudComputingandServicesScience
348
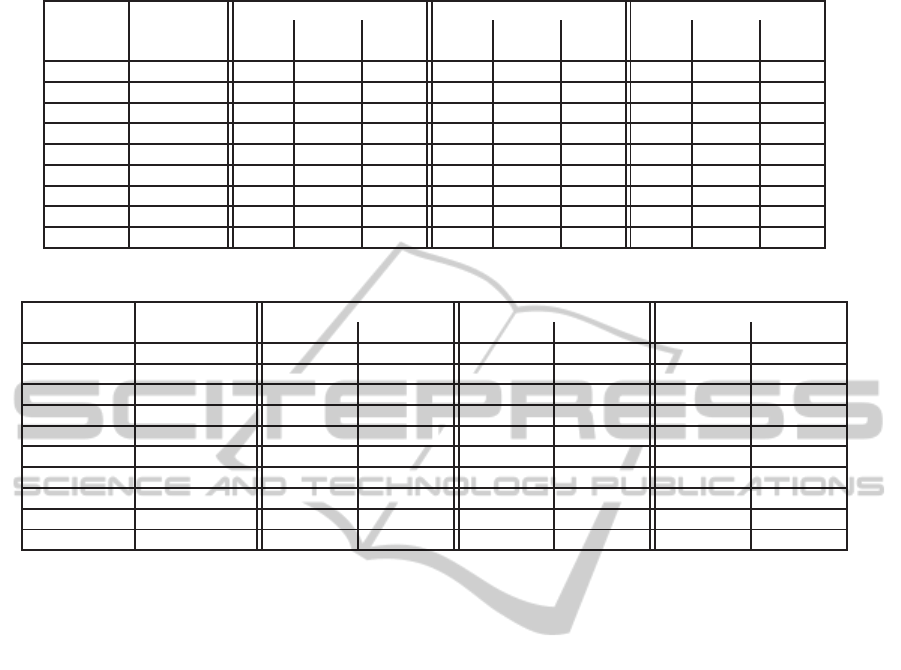
Table 1: Average resource utilization of the collection agent.
#probes
#resource Without compression Lossless compression Adaptive algorithm
data CPU RAM NET CPU RAM NET CPU RAM NET
streams (%) (%) (%) (%) (%) (%) (%) (%) (%)
1 25 0.0 0.4 0.005 0.3 0.4 0.002 0.1 0.5 0.001
2 48 0.1 0.5 0.009 0.5 0.5 0.004 0.1 0.5 0.002
4 94 0.1 0.6 0.019 1.1 0.6 0.009 0.2 0.7 0.004
8 186 0.1 1.0 0.041 1.8 0.9 0.019 0.3 1.0 0.008
16 370 0.3 1.4 0.085 2.9 1.4 0.041 0.4 1.4 0.016
32 738 0.5 2.5 0.173 4.1 2.6 0.083 0.6 2.7 0.032
64 1474 0.6 4.7 0.352 6.0 4.8 0.162 0.8 4.6 0.069
128 2946 0.9 9.4 0.681 9.8 9.3 0.337 1.2 9.5 0.127
256 5890 2.5 18.7 1.392 23.1 18.3 0.641 3.1 18.8 0.266
Table 2: Average resource utilization of the collector in the distributed cluster data filter.
#monitored #resource Without compression Lossless compression Adaptive algorithm
nodes data streams CPU (%) NET (%) CPU (%) NET (%) CPU (%) NET (%)
1 2946 0.1 0.971 0.6 0.450 0.1 0.189
2 5892 0.1 1.943 0.9 0.899 0.1 0.355
4 11784 0.2 3.838 2.0 1.797 0.2 0.748
8 23568 0.4 7.763 3.6 3.594 0.4 1.463
16 47136 0.9 15.421 8.1 7.186 0.9 3.001
32 94272 1.9 31.055 17.1 14.374 1.9 5.872
64 188544 3.2 61.980 33.6 28.751 3.2 11.711
128 377088 - - 69.9 57.539 6.1 23.404
256 754176 - - - - 12.5 47.096
512 1508352 - - - - 23.7 93.691
of our architecture. The Adaptive algorithm is able
to adapt the frequency of sampling and data updating
to minimize computational and communication costs,
while guaranteeing high accuracy of monitored infor-
mation. From these tests, we see that at intra-node
level, sending data streams has a negligible impact on
the network bandwidth, despite the fact that it is re-
duced of about 50% by using lossless compression
and more than 80% by using the Adaptive algorithm.
We see also that the most used resource without data
compression or with Adaptive algorithm is the mem-
ory, while with lossless compression the most used re-
source is the CPU. At 128 probes, both the CPU and
memory utilizations are less than 10%. This threshold
is commonly used as the largest fraction of resource
utilization that administrators are comfortable devot-
ing to monitoring. We have adopted this threshold as
our target maximum resource utilization for the mon-
itoring system. Hence, on each monitored node, we
can collect up to 128 probes for a total of 2,946 re-
source data streams per second. We recall that a pe-
riod of one second is much shorter than commonly
adopted sampling periods that typically do not go be-
low one minute.
4.2 Intra-cluster Scalability
In the following set of experiments, we consider
nodes within a cluster, monitored with the same probe
setup. We measure the resource consumption of the
collector at cluster level with or without compression
efforts and with the Adaptive algorithm.
Table 2 reports the average resource consump-
tion of the collector node as a function of the num-
ber of monitored nodes. From this table, we see
that without compression the most used resource is
the network that allows the monitoring of at most 64
nodes (or 188,544 resource data streams) in a clus-
ter. On the contrary, compressing data strongly im-
pacts the CPU utilization. Despite that, the compres-
sion of data allows to monitor more than 128 nodes or
2, 946· 128 = 377, 088 resource data streams per sec-
ond. By using the Adaptive algorithm we are able to
monitor up to 512 nodes per collector, meaning 1.5M
resource data streams per second.
As further result, we add collector nodes and in-
crement the number of monitored hosts to evaluate the
scalability of the distributed cluster data filter. Table 3
reports the average resource utilization across the col-
lector nodes.
We keep adding collectors up to 2,048 monitored
nodes. We also add more HDFS and HBASE nodes
MonitoringLargeCloud-BasedSystems
349
to support the write throughput when the number of
nodes becomes higher than 256. We keep 256 as limit
in the number of nodes since overcoming the 50%
of incoming network bandwidth of the collector node
means overcomingthe 100% of outcomingbandwidth
as can be inferred by Figure 3. In this scenario, by
using the Adaptive algorithm we are able to monitor
about 6M resource data streams by using an average
12.5% of CPU and 47.3% of network bandwidth.
Table 3: Average resource utilization of a collector process
over the distributed cluster data filter.
#monitored #resource collector
nodes data
#nodes
CPU NET
streams (%) (%)
256 754176 1 12.5 47.096
512 1508352 2 12.8 48.327
1024 3016704 4 12.2 46.851
2048 6033408 8 12.4 46.908
This analysis on scalability reveals that the pro-
posed architecture is able to collect and process:
• more than 2900 resource data streams per second,
from 128 probes, on a single monitorednode, with
a resource utilization <10%;
• more than 754000 resource data streams per sec-
ond, from 256 different monitored nodes using a
single collector node;
• more than 6000000 resource data streams per sec-
ond per cluster.
By using the TSDB component (see Figure 3), ev-
ery collector node provides the real-time plotting. In
Table 4, we report the resource consumption of this
process. In this testbed we request an increasing num-
ber of graphs (from 10 to 100) and we set a refresh
rate of 15 seconds for each graph.
As for the collector process, the memory con-
sumption of the TSDB component is negligible with
respect to the CPU consumption. The TSDB process
uses about the 66% of CPU while plotting 100 graphs
(i.e. 30000 resource data streams) for each collector
node every 15 seconds. Moreover, Table 4 shows that
both the incoming and outcoming network bandwidth
consumptions are negligible if compared to the net-
work consumptions of the collector process. By using
the 12.5% and the 66.4% of CPU for the collector and
TSDB respectively, more than the 20% of spare CPU
can be used for other purposes like the execution of
the Distributed sample storage jobs.
5 CONCLUSIONS
In this paper, we proposed a novel hybrid architec-
ture for monitoring large-scale, geographically dis-
Table 4: Average resource utilization of a TSDB process
over the distributed cluster data filter.
#graphs
#resource
CPU
NET NET
data In Out
streams (%) (%) (%)
10 4500 10,3 0,077 0,131
25 11250 25,1 0,163 0,265
50 22500 49,8 0,329 0,538
100 30000 66,4 0,432 0,714
100 45000 98,2 0,671 1,099
tributed network infrastructures spread across multi-
ple data centers. Architectural choices are made in
order to satisfy scalability, effectiveness, resiliency
and multi-tenancy requirements. These choices are
mandatory when you have to support gathering and
analysis operations of huge numbers of data streams
coming from cloud system monitors. The proposed
architecture is already integrated with on-line analyz-
ers working at different temporal scales. Our prelimi-
nary experiments show the potential scalability limits
of the monitoring system: more than 6M of resource
data streams per cluster, per second. All these opera-
tions of data streams are carried out within real-time
constraints in the order of seconds thus demonstrating
that huge margins of improvement are feasible.
Future work includes the evaluation of traffic
scalability between data centers for common analyt-
ics for monitoring and the comparison with respect
to state-of-the-art system architectures (Rabkin and
Katz, 2010; Surhone et al., 2011; Sacerdoti et al.,
2003; Renesse et al., 2003).
REFERENCES
Andreolini, M., Colajanni, M., and Pietri, M. (2012). A
Scalable Architecture for Real-Time Monitoring of
Large Information Systems. In NCCA’12, 2nd IEEE
Symposium on Network Cloud Computing and Appli-
cations. IEEE Computer Society.
Andreolini, M., Colajanni, M., and Tosi, S. (2011). A Soft-
ware Architecture for the Analysis of Large Sets of
Data Streams in Cloud Infrastructures. In CIT’11,
11th IEEE International Conference on Computer and
Information Technology. IEEE Computer Society.
Babu, S., Subramanian, L., and Widom, J. (2001). A
Data Stream Management System for Network Traf-
fic Management. In NRDM’01, 1st Workshop on
Network-Related Data Management.
Badger, M. (2008). Zenoss Core Network and System Mon-
itoring. Packt Publishing Ltd, Birmingham, UK.
Calder, B. et al. (2011). Windows Azure Storage: a highly
available cloud storage service with strong consis-
CLOSER2014-4thInternationalConferenceonCloudComputingandServicesScience
350

tency. In SOSP’11, 23rd ACM Symposium on Operat-
ing System Principles. ACM.
Castro, M., Druschel, P., Kermarrec, A.-M., and Rowstron,
A. (2002). Scribe: A large-scale and decentralized
application-level multicast infrastructure. IEEE Jour-
nal on Selected Areas in Communications (JSAC).
Cranor, C., Johnson, T., and Spataschek, O. (2003). Gi-
gascope: a stream database for network applications.
In SIGMOD’03, 2003 ACM SIGMOD International
Conference on Management of Data. ACM.
Davis, C. (2013). Graphite - Scalable Realtime Graphing.
http://graphite.wikidot.com.
Dean, J. and Lopes, J. (2004). MapReduce: Simplified Data
Processing on Large Clusters. In OSDI’04, 6th Sym-
posium on Operating Systems Design and Implemen-
tation. USENIX Association.
Gantz, J. and Reinsel, D. (2012). The digi-
tal universe in 2020: Big data, bigger dig-
ital shadows, and biggest growth in the far
east. http://www.emc.com/leadership/digital-
universe/iview/big-data-2020.htm.
George, L. (2011). HBase: the definitive guide. O’Reilly
Media, Sebastopol, CA.
Hasselmeyer., P. and d’Heureuse, N. (2010). Towards holis-
tic multi-tenant monitoring for virtual data centers. In
NOMS’10, 2010 IEEE/IFIP Network Operations and
Management Symposium Workshops. IEEE Computer
Society.
Hoffman, S. and Souza, S. D. (2013). Apache Flume: Dis-
tributed Log Collection for Hadoop. Packt Publishing,
Birmingham, UK.
Josephsen, D. (2007). Building a Monitoring Infrastructure
with Nagios. Prentice Hall, Upper Saddle River, NJ.
Keller, A. and Ludwig, H. (2003). The WSLA Framework:
Specifying and Monitoring Service Level Agreements
for Web Services. Journal of Network and Systems
Management.
Kundu, D. and Lavlu, S. (2009). Cacti 0.8 Network Moni-
toring. Packt Publishing, Birmingham, UK.
Leu, J. S., Yee, Y. S., and Chen, W. L. (2010). Compar-
ison of Map-Reduce and SQL on Large-Scale Data
Processing. In ISPA’10, 1st International Symposium
on Parallel and Distributed Processing with Applica-
tions. IEEE Computer Society.
Litvinova, A., Engelmann, C., and Scott, S. L. (2010).
A proactive fault tolerance framework for high-
performance computing. In PDCN’10, 9th IASTED
International Conference on Parallel and Distributed
Computing and Networks (PDCN2010). ACTA Press.
Lv, Q., Cao, P., Cohen, E., Li, K., and Shenker, S. (2002).
Search and replication in unstructured peer-to-peer
networks. In ICS’02, 16th International Conference
on Supercomputing. ACM.
Marchetti, M., Colajanni, M., and Messori, M. (2010). Se-
lective and early threat detectionin large networked
systems. In CIT’10, 10th IEEE International Confer-
ence on Computer and Information Technology. IEEE
Computer Society.
Massie, M. L., Chun, B. N., and Culler, D. E. (2004). The
Ganglia Distributed Monitoring System: Design, Im-
plementation, and Experience. Parallel Computing.
Olston, C. et al. (2008). Pig Latin: a not-so-foreign lan-
guage for data processing. In SIGMOD’08, 2008 ACM
SIGMOD International Conference on Management
of Data, New York, NY. ACM.
Olups, R. (2010). Zabbix 1.8 network monitoring. Packt
Publishing, Birmingham, UK.
Rabkin, A. and Katz, R. (2010). Chukwa: a system for re-
liable large-scale log collection. In LISA’10, 24th In-
ternational Conference on Large Installation System
Administration. USENIX Association.
Renesse, R. V., Birman, K. P., and Vogels, W. (2003). Astro-
labe: A robust and scalable technology for distributed
system monitoring, management, and data mining.
ACM Transactions on Computer Systems.
Rowstron, A. and Druschel, P. (2001). Pastry: Scalable,
decentralized object location, and routing for large-
scale peer-to-peer systems. MIDDLEWARE’01, 3rd
IFIP/ACM International Conference on Distributed
Systems Platforms.
Sacerdoti, F. D., Katz, M. J., Massie, M. L., and Culler,
D. E. (2003). Wide Area Cluster Monitoring with
Ganglia. Cluster Computing.
Shvachko, K. et al. (2010). The Hadoop Distributed File
System. In MSST’10, 26th Symposium on Massive
Storage Systems and Technologies. IEEE Computer
Society.
Sigoure, B. (2010). OpenTSDB, a distributed, scalable
Time Series Database. http://opentsdb.net.
Surhone, L. M., Tennoe, M. T., and Henssonow, S. F.
(2011). OpenNMS. Betascript Publishing, Mauritius.
Voicu, R., Newman, H., and Cirstoiu, C. (2009). MonAL-
ISA: An agent based, dynamic service system to mon-
itor, control and optimize distributed systems. Com-
puter Physics Communications.
Zyrion (2010-2013). Traverse: distributed,
scalable, high-availability architecture.
http://www.zyrion.com/company/whitepapers.
MonitoringLargeCloud-BasedSystems
351
