
The Co-retweeted Network and Its Applications for Measuring the
Perceived Political Polarization
Samantha Finn, Eni Mustafaraj and Panagiotis T. Metaxas
Department of Computer Science, Wellesley College, Wellesley, MA02481, U.S.A.
Keywords:
Social Media Analytics, Social Networks, Twitter, Big Data, Social and Legal Issues, Human Computation.
Abstract:
This paper introduces a novel network, the co-retweeted network, that is constructed as the undirected
weighted graph that connects highly visible accounts who have been retweeted by members of the audience
during some real-time event. Like bibliographics co-citation used to indicate that two papers treat a related
subject matter, co-retweeting is used to indicate that two accounts present similar opinions in an online dis-
cussion. Thus, the co-retweeted network can be seen as a form of consulting the opinion of the crowd that
is following the discussion about the similarity (or difference) of positions expressed by the highly visible
accounts. When applied on political conversations related to some event, the co-retweeted network enables
the measurement of the polarity of political orientation of major players (including news organizations) based
on the views of the audience. It can also measure the degree of polarization of the event itself.
1 INTRODUCTION
Presidential debates in the United States are very im-
portant political events. Their television audience
consistently ranks among the largest of the year (sec-
ond only to the famous “Super Bowl”, the champi-
onship game of US Football). However, these specta-
tors are no longer passive: they increasingly use the
web as a platform for further engagement. As studies
from Pew Research have shown, 1 in 10 spectators in
presidential debates is a “dual-screener”
1
. Very often
the second screen is Twitter, where running commen-
tary of live-televised events is at its liveliest.
But studying such lively online discussions has a
significant obstacle: data size. During the 2012 US
presidential race President Barack Obama and chal-
lenger Mitt Romney held three debates on October
3rd, 16th and 22nd. These debates generated respec-
tively 10.3 million
2
, 7.2 million
3
, and 6.5 million
4
tweets in a time span of approximately 90 min. each.
Currently, only Twitter (the company) is able
to make sense of such big data by creating simple
histogram-like data aggregations that spike during the
debates (charts can be found in footnotes 2, 3, 4). By
1
Social media a hotbed of political debate, engagement
– for the good? http://to.pbs.org/1bCvUoJ
2
Dispatch from the Denver debate, http://bit.ly/1k15reF
3
Twitter at the Town Hall Debate, http://bit.ly/1kWkBj6
4
The Final Presidential Debate, http://bit.ly/19Av3VM
establishing a correspondence between what was be-
ing said during the debate and the number of tweets
per minute mentioning those words (and other debate-
related hashtags), Twitter can quantify how moments
during the live event affected the tweeting public.
While this is a good way to summarize the major
issues tweeted during an event, one might be inter-
ested not only in what is being tweeted, but also who
is tweeting it and why. In addition, there are other
questions that often occupy the public discourse dur-
ing political discussions: How polarized were the po-
litical postings online? Did the major news organi-
zations take sides in favor of one or the other candi-
date? And did the supporters of one discussant were
more vocal than the supporters of the other?
News organizations answer these questions by us-
ing human experts who try to make sense of the data,
preferably while the event is developing. However, no
matter how well trained, human experts will hardly
be able to keep track of the avalanche of data coming
at a speed of 100,000 tweets/minute. Our approach
instead is to crowd source the solution by using “hu-
man computation” (von Ahn et al., 2006) in the form
of analyzing the independent decisions made by large
groups of users in parallel. In Twitter, this takes into
account retweets
5
and favorites.
5
In this paper, when we refer to “retweets” we mean ver-
batim retweets created by the clicking of the retweet button,
not the manually created modified tweets.
276
Finn S., Mustafaraj E. and T. Metaxas P..
The Co-retweeted Network and Its Applications for Measuring the Perceived Political Polarization.
DOI: 10.5220/0004788702760284
In Proceedings of the 10th International Conference on Web Information Systems and Technologies (WEBIST-2014), pages 276-284
ISBN: 978-989-758-023-9
Copyright
c
2014 SCITEPRESS (Science and Technology Publications, Lda.)

In an effort to take advantage of this human com-
putation, we propose the construction of a novel net-
work, the co-retweeted network of Twitter accounts.
Our insight is that the co-retweeted network displays
some dynamics of Twitter conversations during a cer-
tain event as revealed by the repeated and indepen-
dent behavior of the millions of users following the
event. We define as co-retweeting the act of a sin-
gle user retweeting two –or more– different accounts.
These acts are used to create undirected weighted
edges between the co-retweeted accounts in the net-
work. The more users retweet these two accounts,
the more weight the edge gains. And there can be a
lot of retweets to include in the network construction.
In fact, the data we collected during the presidential
debates show that more than 50% of the tweets sent
are retweets. However, some tweets will have greater
visibility, receiving in the order of several thousand
retweets, while the vast majority of them will only re-
ceive one or two retweets. We use this information to
create a co-retweeted network that captures how the
wider public views the major participants in the dis-
cussion. An example visualizing the second presiden-
tial debate using the co-retweeted network is shown
in Figure 1. To the best of our knowledge, this has
not been previously studied in the Twitter-related re-
search.
We claim that the co-retweeted network is able
to measure the perceived political orientation of the
major players by recording the retweets of the audi-
ence on Twitter. Co-retweeting can be compared to
the concept of co-citation (Small, 1973). The latter
is a well known bibliometrics measurement used by
librarians to determine whether two published works
may be treating similar subjects or not. When there
are a lot of works co-citing two papers, A and B, this
is considered evidence that A and B treat related sub-
jects. In this respect, it reflects the opinion of many
authors and thus represents a better indicator of sub-
ject similarity. The more co-citations two documents
receive, the more likely they are semantically related.
(In fact, reviewers of papers enforce that by demand-
ing the inclusion of missing co-citations.)
We use co-citation in the same spirit but, in this
paper, in a more restricted domain: During a politi-
cal event, when lots of Twitter users retweet two ac-
counts, U
A
and U
B
, we consider it as evidence that U
A
and U
B
are taking politically similar positions. The
more co-retweeting the tweets of U
A
and U
B
receive,
the more likely they are politically related. This fact
can lead to some concrete measurement on how po-
larized two accounts are and, when considering the
overall political interaction, how polarized the event
is. Effectively, we are able to compute the answers to
the three questions we posed above.
The remaining of this paper is organized as fol-
lows. After describing prior work related to the issues
treated in this paper, we define the co-retweeted net-
work and describe its construction. Then we present
the applications we consider in this paper, measuring
the degree of political polarity during an online event,
and measuring the polarity of the major players par-
ticipating in the event. We end with our conclusions.
1.1 Prior Work
Co-citation was first introduced by Henry Small
(Small, 1973) and is considered as a basic concept in
Bibliometrics. The histogram-like data aggregations
mentioned in the introduction was first applied by re-
searchers during a debate for the 2008 US Elections
(Diakopoulos and Shamma, 2010).
We introduced the concept of co-retweeting in
(Finn and Mustafaraj, 2013), with a possible appli-
cation for recommending relevant tweets during an
event. The domain of recommendation and specif-
ically the algorithms for item-based collaborative fil-
tering are at the foundation of our method for building
the co-retweeted network, which follows the princi-
ples of building the item-item similarity matrix with
co-rated items (Sarwar et al., 2001). In the current
paper, we expand the definition of the co-retweeted
network and introduce new applications for it.
The first application, measuring opinion polariza-
tion for an issue or topic, is a research question that is
usually treated in the political sciences literature. A
review of the literature on this question (Fiorina and
Abrams, 2008) concluded that the “American public
as a whole is no more polarized today that it was a
generation ago”. While these studies focus on the
public as a whole, we are posing this question in the
context of the social media participants, which might
not be representative of the entire public but still can
command certain influence over the public discourse
and its coverage in the traditional media. Further-
more, since Twitter has a global userbase, we can
measure polarity in political discourse in other coun-
tries (e.g. Germany) as well.
The second application of the co-retweeted net-
work is about calculating an account’s polarity and
using it to measure the media bias (as perceived by
the Twitter audience). Researchers have always been
concerned with media bias for a long time (for an
overview refer to (Prior, 2013)) and different research
fields use various methodologies to measure it. A
somewhat related approach that makes use of Twit-
ter, but doesn’t calculate media bias (it calculates the
political preferences of a (media) organization’s Twit-
TheCo-retweetedNetworkandItsApplicationsforMeasuringthePerceivedPoliticalPolarization
277
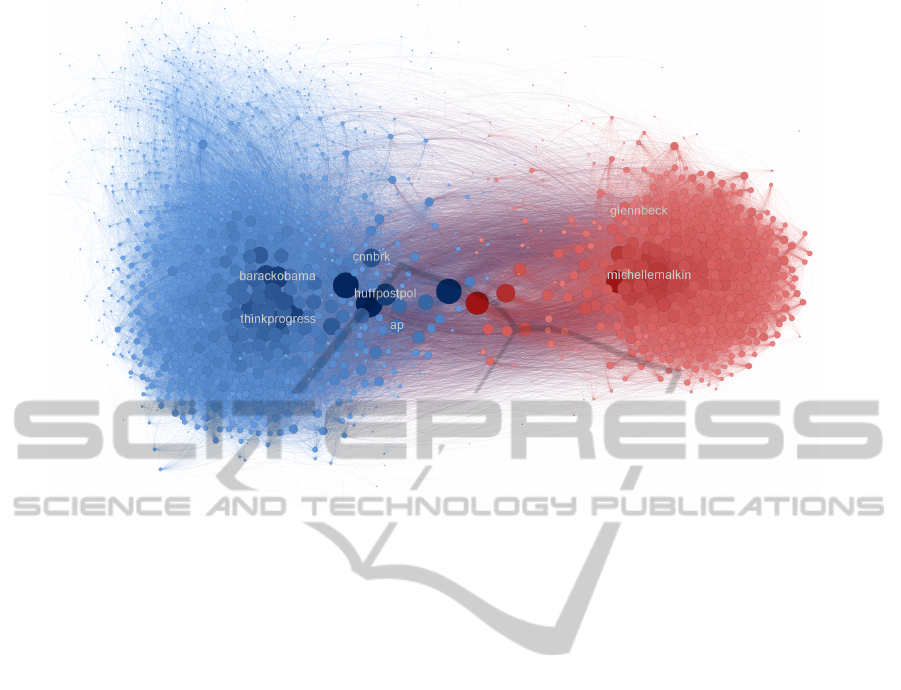
Figure 1: The network visualization for the 1,500 most co-retweeted accounts during the second debate. It turns out that,
in this data set, the nodes colored blue by the community detection algorithm belong to accounts with a liberal political
orientation and the nodes colored red to accounts with conservative political orientation. The labels indicate the location of
some of the more visible accounts belonging to news organizations and political entities.
ter followers instead) can be found in (Golbeck and
Hansen, 2014). Their method relies on the static rela-
tion of “followship”. Our method instead is dynamic
in the sense that every co-retweeted network is event-
specific and may display different bias. Such speci-
ficity cannot be captured through static relations.
Additionally, we use the account polarity method
to infer the polarity of all (engaged in retweeting)
accounts in the audience to answer the question of
whose supporters were more active and vocal during
an event. This problem has certain similarities to the
task of classifying Twitter users based on their politi-
cal orientation as described in (Conover et al., 2011)
and (Cohen and Ruths, 2013), however, our approach
differs significantly from theirs. The cited research
uses machine learning to classify users who have been
represented by a set of features (mostly hashtags and
other metadata from their tweets). We don’t use the
text of the tweets in our approach. Instead, the polar-
ity (or orientation) is calculated based on the charac-
teristics of the co-retweeted network, as well as the
retweeting behavior of the users. A limitation of our
method is that it cannot be used for users who didn’t
retweet. However, previous research has already es-
tablished that the most vocal supporters engage heav-
ily in retweeting (Mustafaraj et al., 2011; Jungherr
et al., 2012).
2 THE CO-RETWEETED
NETWORK
2.1 Data Collection
Collecting data from Twitter is a relatively easy task,
due to the different APIs offered by Twitter. How-
ever, being sure that one has collected all the rel-
evant or existing data is difficult to evaluate. The
only way to be sure is to have access to the Twitter
Firehose API, which is usually unreasonably expen-
sive for academic researchers. Currently, researchers
use the public APIs (Streaming, Search, REST) by
adopting one (or a combination) of the following three
methods (Gerlitz and Rieder, 2013):
1) a selection of topic-relevant hashtags and keywords
which is fed to the Streaming or Search API,
2) a network of users and their followers (snowball
sampling) for which the REST API collects all tweets,
3) metadata features (location, language, etc.) which
are also fed to the Streaming or Search API.
For our study, we use the first method: a selection
of topic-relevant hashtags and keywords. Two are the
major problems with this method: a) the set of pres-
elected keywords and hashtags might not capture the
entirety of the discussions about a topic, and b) once
WEBIST2014-InternationalConferenceonWebInformationSystemsandTechnologies
278
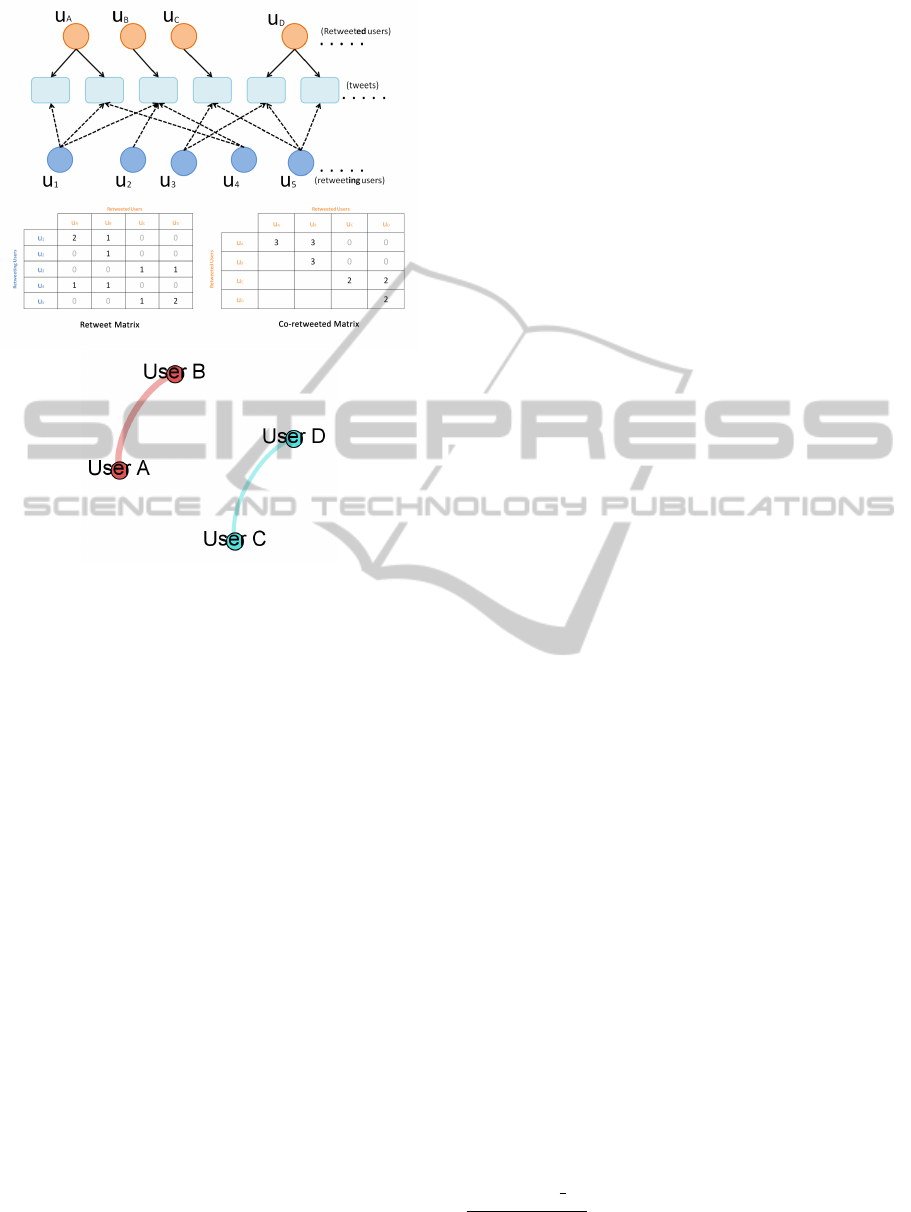
Figure 2: (Top) The process of generating the co-retweeted
matrix. The graphic at the top displays the activity of
users U
A
, U
B
, ... whose tweets (blue rectangles) are being
retweeted by other users U
1
, U
2
, .... On the middle left is the
corresponding retweet matrix and on the middle right the
symmetric co-retweeted matrix. The main diagonal of the
co-retweeted matrix shows the number of users retweeting
a certain account, and the upper diagonal cells contain the
number of times two accounts were co-retweeted. (Bottom)
The co-retweeted network produced by the matrix above.
a topic of conversation becomes popular, Twitter ap-
plies rate limitations. All data collections have to deal
with the first problem, while the second one applies
only to conversations that become dominant (such as
the US presidential debates discussed in this paper).
Our strategy for dealing with the first problem
was the following: during the first presidential de-
bate (Oct. 3, 2012) we used the keywords ”obama”
and ”romney” to collect tweets mentioning the two
contenders. The text of tweets was then processed
to find the set of most common keywords and hash-
tags, which then was used for the two successive de-
bates. Additionally, before every new debate we up-
dated the list with hashtags being promoted before the
TV broadcast such as #cnndebate, #lynndebate, etc.
This strategy still doesn’t ensure that we will be able
to capture the whole conversation, but, for the pur-
poses of our method, we don’t need all tweets, we
need the tweets that receive the most retweets. Previ-
ous research (Suh et al., 2010) has established that “a
tweet with hashtags is more likely to get retweeted”.
By using the most popular hashtags around which the
large community has coalesced, we are making the
assumption that users who want to be retweeted will
be using these agreed upon hashtags. Furthermore,
our previous experience with collecting election data
from Twitter (Mustafaraj et al., 2011) has shown that
Twitter users who play the curator role, will add the
appropriate hashtags before retweeting a message rel-
evant to a conversation.
The problem of Twitter rate limits appears when-
ever the conversation about a topic or event exceeds
the 1% of the whole Twitter volume. The pres-
idential debates, which often averaged at 100,000
tweets/minute
6
were some of the most-tweeted events
in the Twitter history (the first debate was the most-
tweeted event ever). Thus, we know that we were
able to capture only a small fraction of the sent tweets
(in fact, Twitter includes a message in the Streaming
API to indicate how many tweets were missed since
the latest received tweet, e.g., "limit": "track":
1234 , and we can calculate how many tweets we
missed). Since we are mostly interested in pop-
ular retweets, one way to mitigate the rate limita-
tion during the live TV coverage of the debates was
to continue the data collection several hours beyond
the event completion. This makes sure that we get
retweets of content that users who didn’t follow the
live debate found interesting afterwards. We then
tested that the 1,500 tweets with most retweets in our
sample are a good representation of most retweeted
content by the following procedure: in a later date,
we recollected the top 3,000 tweets from our dataset,
checked their retweet count, and ranked them based
on this number. By comparing these two rankings,
we found that our sample has 83% of the top 500
most retweeted tweets, 74% of top 1000, and 71% of
top 1500, offering a good coverage, despite the lim-
ited sampling. Finally, recent research on comparing
the Twitter Streaming API to the Firehose (Morstat-
ter et al., 2013) has indicated that for network-level
measures (such as centrality, etc.) there is correlation
between the results of the two datasets. So, while our
data collection method might not be perfect, we have
taken into account all available measures to overcome
the known problems.
2.2 Co-retweeted Network Construction
From the tweets collected as described above, we fo-
cus only on tweets with retweet information using the
retweeted status field included in the JSON rep-
6
Tracking the #Debates: From Big Bird to Bayonets
http://bit.ly/1dhigZ9
TheCo-retweetedNetworkandItsApplicationsforMeasuringthePerceivedPoliticalPolarization
279

resentation of a tweet. Such information allows us
to create pairs of the original message sender and the
retweeter. This information is necessary for creating
the co-retweeted network and this process is summa-
rized in Figure 2. We create a matrix of retweet re-
lationships, where each row represents a user, and
the columns represent users who have been retweeted.
From this matrix we obtain the co-retweeted matrix,
containing only the users who were retweeted (the
columns in the retweet matrix). Note that the co-
retweeted matrix is symmetric, corresponding to a
weighted undirected network, and we show only its
upper diagonal.
Each co-retweeted matrix entry represents how
many times the two users have both been retweeted
by other users. For example, referring to Figure 2,
in the retweet matrix, Users U
A
and U
B
have both
been retweeted by a third user, User U
1
. The entry for
U
A
and U
B
in the co-retweeted matrix is incremented
by 1. The same is true for U
4
who has also retweeted
both U
A
and U
B
). Using this matrix we create the co-
retweeted network of the retweeted accounts, where
each user in the rows and columns of the matrix be-
comes a node, with an edge between them weighted
by the number of users who have retweeted both of
them. Accounts U
i
, for numeric i, who have not been
retweeted are ignored in the co-retweeted matrix.
2.3 Visualization of the Oct 16 Debate
Figure 1 shows the visualization
7
of the top 1,500
most co-retweeted accounts built using about 1.3 mil-
lion tweets that we collected as described. This vi-
sualization was created using Gephi
8
that was cho-
sen for convenience as it includes several useful im-
plementations of community detection, force-directed
layout and influence calculations. Other implementa-
tions are possible, of course, but using a comprehen-
sive set of implementations was beyond the scope of
this paper. After all, using comparable implementa-
tions the essence of the co-retweeted network should
not change. The co-retweeted network in Figure 1
is layed out using Gephi’s ForceAtlas2 implementa-
tion (Gephi, 2010) where nodes are attracted to each
other based on the cardinality of their connections
(Fruchterman and Reingold, 1991).
We notice two very distinct groups, with only a
few nodes bridging the gap between them. The colors
7
For an interactive version of the Oct. 16 debate,
visit http://bit.ly/1d3MRJM and for the Oct 22 debate visit
http://bit.ly/1fWajvH. Due to the size of the network and de-
pending on the available bandwidth, loading the page may
take a minute.
8
The Gephi Visualization Tool, http://gephi.org
used in the visualization make these two groups more
apparent and are based on the Louvain community
finding algorithm (Blondel et al., 2008) which com-
putes groups of nodes containing more edges within
the group than outside the group. The size and dark-
ness of each node is based on influence in the network
indicated by their eigenvalue centrality value. By
comparison to Figure 1, Figure 3 shows the retweet
network of the top 1,500 accounts which is highly dis-
connected. The giant component contains only 550
connected nodes; the remaining nodes are not con-
nected to it and are shown on the periphery. This is
not surprising, since the most retweeted nodes do not
retweet others, making the retweet network of the top
accounts not very useful. Details about the datasets
are listed in Table 1.
Figure 3: The retweet network of the 1,500 most retweeted
users during the debates is not very useful in making sense
of the online activity. The central component contains the
550 connected nodes and 6 communities; the remaining
components are shown on the periphery. (The full retweet
network –not shown here– is also not as useful.).
3 MEASURING THE PERCEIVED
POLITICAL POLARIZATION
Next we describe a couple of applications for the
co-retweeted network. First we describe the insight
gained by observing the co-retweeted networks of
the two presidential debates. Then we define the
measurement “degree of the network polarity” and
a method to compute the individual polarity of any
member participating in a polarized network.
The visualizations for both presidential debates
display two highly separated communities that break
WEBIST2014-InternationalConferenceonWebInformationSystemsandTechnologies
280

Table 1: Summary of the two debate datasets, which were used to create the co-retweeted networks. Users contributing refers
to the number of users who retweeted at least two of the top 1,500 users (in this way they contribute at least one edge to the
network). Retweets contributing refers to how many times the top 1,500 users were retweeted by the contributing users.
Users Tweets Retweets Nodes Edges Modularity Contrib. Users Contrib. RTs
Oct. 16 615,376 820,746 423,802 1,498 92,196 0.440 24,719 79,985
Oct. 22 646,559 1,074,588 582,526 1,496 126,252 0.434 45,493 179,978
down over political lines, with popular news media
accounts bridging the gap between them. The dis-
tance between the two groups, determined by the
force-directed algorithm, is a result of their polar-
ization. The accounts in the blue group on the
left of the network are largely liberal leaning politi-
cians and popular bloggers (e.g. @barackobama,
@thinkprogress), while to the right the red consists of
conservative accounts (e.g. @glennbeck, @michelle-
malkin). Between these two groups are media ac-
counts, which are divided between red and blue.
Some of these accounts are claiming to be politically
unbiased. However, many mainstream news accounts
(@cnnbrk, @huffpostpol, @ap) in our event network
are classified closer to the blue community.
Previous research has demonstrated how political
social media is polarized in the two political orienta-
tions (Adamic and Glance, 2005). However, here the
situation is different. The links are not created as a
result of the actors actively connecting to each-other.
In fact, although these are popular accounts, some of
whom received thousands of retweets during the de-
bates, they are not active in retweeting each other.
In fact, the corresponding retweet graph (Fig. 3) is
disconnected. Its giant component shows 6 commu-
nities which are not obviously distinguishable, and
only the largest two show obvious political orienta-
tion. The co-retweeted network bypasses the sparsity
of the retweet network by utilizing the hundreds of
thousands of retweets made by normal users in or-
der to form connections between the most popular ac-
counts, and by doing this reveals the perceived orien-
tation of the popular accounts. We make use of the
assumption (Metaxas and Mustafaraj, 2010; Conover
et al., 2011; Wellesley Trails Group, 2014) that the
majority of users are not likely to retweet something
that disagrees with their political views. Therefore,
most of the accounts a single user has retweeted will
share a common political bias. We derive the per-
ceived political orientation of an account by the bias
of the audience. The co-retweeted network visualizes
the political beliefs of the public at large. For exam-
ple, many news media accounts have been shown to
have biased audiences (Golbeck and Hansen, 2011).
Fox News and The Drudge Report, which are in the
conservative group on our network, have a conserva-
tive audience, while National Public Radio and The
New York Times have more liberal audiences and ap-
pear slightly to the left in our network. Our findings
confirm the findings of (Golbeck and Hansen, 2011),
however, our method is more flexible since it com-
putes bias on specific events, not in general.
3.1 Network Polarity
A polarized network is composed of two or more
groups of densely connected nodes that are linked
through relatively few inter-group edges. We define
as a network’s polarity degree, PD, the ratio of sum
of edges contained within each group over the total
number of edges present in the network. Let E
i
be
the number of edges connecting nodes within group i
and E
i j
be the number of edges connecting nodes be-
tween groups i and j. Then, in a network containing
k groups, its polarity degree is:
PD =
∑
1≤i≤k
E
i
E
Since
∑
1≤i≤k
E
i
= E −
∑
1≤i, j≤k
E
i j
, we have
PD = 1 −
∑
1≤i, j≤k
E
i j
E
Note that PD expresses polarization in a natural
way: When the network is composed of few discon-
nected components (groups of nodes isolated from
each other), PD = 1. On the other hand, when the
network is complete, with each node representing a
separate highly connected group, PD = 0.
9
It is well documented that political life in Amer-
ica has become increasingly polarized (Pew Research
Center for the People and the Press, 2012). Our analy-
sis and visualization in Fig. 1 shows that this is indeed
observed during the electoral debates, and computes
its degree of polarization at 0.91. However, depend-
ing on the issue discussed, the polarization degree can
rise more than 0.98, as it happens, for example in the
online discussion with the hashtag #DoYourJobGOP
(See Fig. 4). On the other hand, in Germany, a coun-
try where the online discourse was far less polarized
9
We should note here a limitation of our definition of
PD: Intuitively, it is easily justifiable for small k’s, as is the
case of parties represented in an election. If k is large, as
in the case of family clans, the density of the overall graph
should be taken into account.
TheCo-retweetedNetworkandItsApplicationsforMeasuringthePerceivedPoliticalPolarization
281

than in the US and where coalitions between parties
are frequent and expected, the co-retweeted network
shows no comparable polarized divisions (Fig. 5). For
the recent 2013 German elections co-retweeted net-
work, the polarization degree was 0.48.
Figure 4: In a highly polarized online discussion in the
US, marked by the hashtag DoYourJobGOP (indicating that
the Republican party is not performing its duties in the
Congress), the degree of polarization was close to 99%. A
reason for this higher polarization is, no doubt, the fact that
the hashtag was designed to divide as often happens in the
so-called hashtag-wars.
Figure 5: The co-retweeted network for the recent German
elections shows far less polarization than during the recent
US elections. The network’s degree of polarization was
about 48%.
3.2 Computing Account Polarity
Another related application of the co-retweeted net-
work is to measure the polarity of political orienta-
tion for popular accounts according to how the audi-
ence sees their messages, not according to their own
claims. The co-retweeted network is divided in two
groups that exhibit liberal and conservative bias. Less
polarized media actors, such as mainstream news me-
dia accounts, are retweeted by users of differing po-
litical bias and have co-retweeted links between ac-
counts from both the liberal and conservative clus-
ters in the network. In contrast, highly polarized ac-
counts, such as political candidates, are less likely to
be retweeted by users with opposing views and the
majority of their links will be within their own clus-
ter. This results in certain accounts being drawn into
the center of the co-retweeted network, while others
end up on the periphery of either the liberal or con-
servative groups. We utilize this observation to cal-
culate the polarity degree of individual actors in the
co-retweeted network.
Let us take the Oct. 16 co-retweeted network as
an example for our description below. We define an
account’s polarity value for a particular network to
be the normalized Euclidean distance of the account’s
node to a center of gravity of the network that typi-
cally falls between the two modules. (We normalize
on a scale of -1 to 1, where the center 0 divides con-
servatives and liberals.) As a result, each account is
assigned a polarity value based on their position in the
network, as shown in Figure 6.
Figure 6: The co-retweeted network for October 16th,
where nodes are darkened based on their polarity (darker
nodes are more polarized). The large red dot represents the
center.
From these polarity values, we can determine the
polarity of individual accounts. For every user not
included in this network who has retweeted at least
two accounts in the co-retweeted network, we cal-
culate their polarity as the weighted average of the
polarities of the users they retweeted. A distribution
of the 90,000 users for whom we calculated a polar-
ity value shows that the Oct. 16 debate had a largely
liberal leaning general audience (see Figure 7 (left)).
However, if we look at the more active users that are
likely more closely linked to the party’s line than the
rest, we see a more balanced audience: those who
retweeted at least 10 accounts seem to be evenly dis-
tributed between the two parties (see Figure 7 (right)).
We conclude that, even though both parties were ac-
tively trying to inject information in Twitter, the au-
dience retweeted mostly the liberal messages. One
could see this as an indication on which speaker in
the debates was considered more popular by the on-
line audience.
To compare the accuracy of the calculated po-
larities between the retweeted and co-retweeted net-
works, we performed the same computation in the
WEBIST2014-InternationalConferenceonWebInformationSystemsandTechnologies
282

retweet network and we looked for some ground truth.
We manually studied users who had words in their
Twitter account description indicative of their polit-
ical bias (ie, explicitly mentioning that they were
democrat, republican, liberal, conservative). We ran-
domly selected 77 such users with opposing polari-
ties, and found that in 75 cases their polarity value ac-
curately described them in the co-retweeted network.
We take this as an indication that, even though both
retweet and co-retweeted networks may be useful
in determining political orientation, the co-retweeted
network seems to be a bit more accurate in the deter-
mination.
The computation of the center was performed in
an automatic calculation as follows. We first used
the K-means algorithm to detect two clusters, and
counted the cardinalities V
l
and V
r
of the left and right
cluster. We also determined the center of gravity of
each cluster c
l
and c
r
approximating them as circles.
Finally, we computed the center of the whole system
C as the symmetric center of gravity of the whole net-
work, by placing it in distance relative to the ratio of
the square root of the cardinalities. The x-coordinate
of C is computed as:
x
C
= x
l
+
√
V
r
√
V
r
+
√
V
l
·(x
r
−x
l
)
where V
r
and V
l
are the cardinalities (“volumes”)
of the right and left clusters. The y-coordinate is com-
puted similarly.
Figure 7: The distribution of polarity among (left) users
who retweeted accounts in the co-retweeted network, and
(right) those who retweeted accounts at least 10 times. It
appears that, in this discussion while the audience was
retweeting much more heavily the liberal tweets, the most
active members of the audience were equally divided.
4 CONCLUSIONS
In this paper we introduced a novel network, the co-
retweeted network. This is a meta-network that cap-
tures aggregated user behavior observed in Twitter
during major real-time events. The core power of this
network is that it can built on the collective intelli-
gence of hundreds of thousands of humans who, with
their retweeting decisions evaluate the major accounts
tweeting these real-time events. We also presented
two applications: the computation of the polarity of
the event itself (as is represented by the network);
and the computation of the polarity of the major ac-
counts participating in the discussion (as perceived by
the participating audience). Both of them are novel
contributions in analyzing online political communi-
cation.
In the process we were able to answer the three
questions that often are asked during political events:
The computed polarity degree is able to answer the
question of just how polarized the political postings
during an online event were. In particular we found
that the 2012 US presidential debates were highly po-
larized, much more than the discussion around the
2013 German elections, but not as much as the dis-
cussions around some online hashtag-wars designed
to irritate the opponents and stir controversy.
The computation of a highly visible account’s po-
larity, on the other hand, is able to answer the question
on whether major news organizations take sides in fa-
vor of one or the other candidate during the debates.
This computation is done per event, and not in gen-
eral as other researchers have done in the past. This is
important because news organizations do not always
have a definite liberal or conservative approach for ev-
ery issue. Their stance usually depends on the issue.
And finally we were able to answer the question
on whether the supporters of one debater were more
vocal than the supporters of another, by looking at
the distribution of users’ polarities retweeting liberal
or conservative messages. We found that for the 2012
debates the answer is more nuanced than a simple yes
or no: The distributions reveal that, while the core
supporters may have worked equally hard to promote
the message of their candidate, the audience was far
be less divided in their support.
The concept of co-retweeting, inspired by biblio-
metrics co-citation and introduced in this paper, can
incorporate important aspects of human computation
power into the study and analysis of large online so-
cial media data. There are other applications one may
find, such as its use in a recommendation system,
however, describing it is outside the focus of this pa-
per.
ACKNOWLEDGEMENTS
The authors would like to thank Andreas Jungherr and
Pascal J
¨
urgens for providing some of the data from the
German elections and for insightful comments on an
earlier version of the paper. This research was par-
TheCo-retweetedNetworkandItsApplicationsforMeasuringthePerceivedPoliticalPolarization
283

tially supported by NSF grant CNS-1117693.
REFERENCES
Adamic, L. A. and Glance, N. (2005). The political
blogosphere and the 2004 US election: divided
they blog. In Proc. of the 3rd Intl workshop on
Link discovery, pages 36–43.
Blondel, V. D., Guillaume, J.-L., Lambiotte, R., and
Lefebvre, E. (2008). Fast unfolding of commu-
nities in large networks. Journal of Statistical
Mechanics: Theory and Experiment, 10.
Cohen, R. and Ruths, D. (2013). Classifying political
orientation on twitter: Its not easy! In Proc. of
7th ICWSM. AAAI.
Conover, M. D., Gonc¸alves, B., Ratkiewicz, J., Flam-
mini, A., and Menczer, F. (2011). Predicting the
political alignment of twitter users. In 2011 3rd
IEEE SocialCom, pages 192–199.
Diakopoulos, N. and Shamma, D. A. (2010). Charac-
terizing debate performance via aggregated twit-
ter sentiment. In CHI, pages 1195–1198.
Finn, S. and Mustafaraj, E. (2013). Visualizing
co-retweeting behavior for recommending rele-
vant real-time content. In Proc. of the 4th Intl
Workshop on Modeling Social Media, MSM ’13,
pages 4:1–4:2. ACM.
Fiorina, M. P. and Abrams, S. J. (2008). Political po-
larization in the american public. Annual Review
of Political Science, 11:563–588.
Fruchterman, T. M. J. and Reingold, E. M. (1991).
Graph drawing by force-directed placement.
Software: Practice and Experience, 21:1129–
1164.
Gephi (2010). ForceAtlas2, the new version of our
home-brew layout. http://bit.ly/1deeWht.
Gerlitz, C. and Rieder, B. (2013). Mining one percent
of twitter: Collections, baselines, sampling. M/C
Journal, 16(2).
Golbeck, J. and Hansen, D. (2011). Computing po-
litical preference among twitter followers. In
Proc. of the SIGCHI Conf. on Human Factors in
Computing Systems, CHI ’11, pages 1105–1108,
New York, NY, USA. ACM.
Golbeck, J. and Hansen, D. (2014). A method
for computing political preference among twit-
ter followers. Social Networks, 36:177–184.
Jungherr, A., J
¨
urgens, P., and Schoen, H. (2012). Why
the pirate party won the german election of 2009
or the trouble with predictions: A response to
Tumasjan, A., Sprenger, T. O., Sander, P. G.,
& Welpe, I. M. “Predicting elections with Twit-
ter: What 140 characters reveal about political
sentiment”. Social Science Computer Review,
30(2):229–234.
Metaxas, P. T. and Mustafaraj, E. (2010). From
obscurity to prominence in minutes: Political
speech and real-time search. In Proc. of the Web-
Sci10: Extending the Frontiers of Society On-
Line, April 26-27th, 2010, WebScience’10.
Morstatter, F., Pfeffer, J., Liu, H., and Carley, K. M.
(2013). Is the sample good enough? compar-
ing data from twitters streaming api with twitters
firehose. Proceedings of ICWSM.
Mustafaraj, E., Finn, S., Whitlock, C., and Metaxas,
P. T. (2011). Vocal minority versus silent major-
ity: Discovering the opinions of the long tail. In
Proc. of 3rd IEEE SocialCom, pages 103–110.
IEEE.
Pew Research Center for the People and the Press
(2012). Partisan polarization surges in bush,
obama years. http://bit.ly/1d2HZK6.
Prior, M. (2013). Media and political polarization.
Annual Review of Political Science, 16:101–127.
Sarwar, B., Karypis, G., Konstan, J., and Riedl, J.
(2001). Item-based collaborative filtering rec-
ommendation algorithms. In Proc. of the 10th
WWW, pages 285–295. ACM.
Small, H. (1973). Co-citation in the scientific litera-
ture: A new measure of the relationship between
two documents. Journal of the American Society
for Information Science, 24:265–269.
Suh, B., Hong, L., Pirolli, P., and Chi, E. H. (2010).
Want to be retweeted? large scale analytics
on factors impacting retweet in twitter network.
In 2010 2nd IEEE SocialCom, pages 177–184.
IEEE.
von Ahn, L., Liu, R., and Blum, M. (2006). Peeka-
boom: a game for locating objects in images. In
Proc. of the SIGCHI Conf. on Human Factors in
Computing Systems, CHI ’06, pages 55–64, New
York, NY, USA. ACM.
Wellesley Trails Group (2014). Retweets indicate
agreement, endorsement, trust: A meta-analysis
of published twitter research. Forthcoming.
WEBIST2014-InternationalConferenceonWebInformationSystemsandTechnologies
284
