
A Minimal Cost, Soil Moisture Measurement System
Logging Wenner Array Resistivity with a Microcontroller for Less than 10 Euros
Martin J. Oates
1
, Angel L. Vazquez de Leon
1
and Neil M. Edwards
2
1
Dept of Engineering, Universidad Miguel Hernandez de Elche, Ctra. De Beniel, km 3, 2, 03312 Orihuela, Alicante, Spain
2
NME Electronics Consulting, Norwich, Norfolk, U.K.
Keywords: Agronomy, Low Cost, Microcontroller, Water Management, Wenner Array.
Abstract: Where water is a scarce resource, efficient use of irrigation systems is an absolute requirement for crop
management. Whilst there are many commercial systems available on the market, units typically cost
hundreds of dollars or are lacking in basic data-logging capabilities. This paper describes results from trials
of a minimal cost microcontroller based monitoring system designed for large scale deployment or highly
cost sensitive monitoring. The system can easily be expanded to meet differing socio-economic situations.
1 INTRODUCTION
There is a wide range of electrically based soil
moisture measurement techniques well established
in the fields of geophysical surveying (Dobrin,
1988), (Parasnis, 1986) and agronomy
(Edlefsen,1941) These include resistivity based
methods such as the Wenner (Wenner, 1915) and
Schlumberger Arrays (Lark-Horovitz, 1959), and
capacitive based methods such as Frequency
Domain Reflectometry (FDR) (Wobschall, 1978)
and Time Domain Reflectometry (TDR)
(Topp,1980) as well as Radiation based techniques
such as the Neutron Probe (Bell,1973). Whilst low
cost implementations have been suggested in the
past (Rhoades, 1979), (Igboama, 2011), commercial
implementations of these units (for example the
Landviser Landmapper ) are expensive (typically
$500 to $1600), lack integrated data-logging
capabilities, or are simply unavailable.
Table 1: Measured soil resistances (at 6cm separation) and
resistivity under dry and moist conditions at 25C.
Soil Type
Observed
Resistance
(Ohms)
Effective
Resistivity
(Ohm m)
Dry Clay 560 211
Dry Mulch 690 260
Dry Sand >10K >4K
Wet Clay 95 36
Wet Mulch 90 34
Wet Sand 60 23
By far the simplest of these are the resistivity based
techniques, which whilst suffering from a
susceptibility to a variety of differing soil conditions
such as composition (Table 1), texture (Nadler,
1991), varying pH (Ishada, 1999), salinity (Austin,
1979), (Read, 1979) and temperature (Hanson,
2000), can still be highly effective in detecting
relative changes in soil moisture levels
In particular, the temperature of the soil is
significant (Afa, 2010) as this can affect the
electrochemical properties of the soil being sampled.
This paper presents results from field trials of a
low cost minature Wenner Array based system in
both a mulch enriched research vineyard and a hi-
silica, clay based almond field, typical of the
farmland and campo of the Vega Baja region of
Eastern Spain.
2 METHOD
The Wenner Array was implemented using a
PIC18F family (Microchip, 2000) microcontroller
with a multi-channel, 10 bit Analogue to Digital
convertor, and four metal rods (culinary grade steel)
of up to 23cm length and 2mm diameter held 6cm
apart. Five PIC pins were required for the
implementation of each array, the first to act as a
current source, the second as a current measurement
point and insertion point into the soil, the third and
fourth as voltage measurement points in the soil and
the fifth as a current extraction point from the soil
373
J. Oates M., L. Vazquez de Leon A. and M. Edwards N..
A Minimal Cost, Soil Moisture Measurement System - Logging Wenner Array Resistivity with a Microcontroller for Less than 10 Euros.
DOI: 10.5220/0004729503730380
In Proceedings of the 3rd International Conference on Sensor Networks (SENSORNETS-2014), pages 373-380
ISBN: 978-989-758-001-7
Copyright
c
2014 SCITEPRESS (Science and Technology Publications, Lda.)

(see Figure 1). A reference resistor of known value
was used between the first and second pins, and by
measuring the voltage difference across this resistor,
the current flowing through the soil was determined.
The third and fourth pins provide a high input
impedance voltage measurement and given the
known current, the resistance of the soil between
these two points can be determined. As the voltage
measurements require extremely small currents, this
measurement technique is relatively immune to
irregularities in probe to soil impedance.
Figure 1: Schematic diagram of Wenner Array.
To minimise ground field, capacitive and
electrochemical effects, the system used a square
wave oscillating voltage, first passing the current in
one direction, then reversing polarity to pass the
current in the opposite direction. A frequency of
20Hz was used, as suggested by US Geophysical
Surveys (Environmental Geophysics, 2011), with a
processor voltage of 3.3v (regulated).
Given the range of observed soil resistance
values shown in Table 1, the reference resistor value
of 330 Ohms was chosen to maximise measurement
resolution. This gave an absolute current limit of
10mA, well within the PIC limit of 25mA, but in
effect, typical observed currents were of the order of
2 to 3mA.
The system used 4 cycles, each of 50ms, taking
voltage and current readings 24ms into each half
cycle, and averaging the results. Readings taken
earlier in the cycle demonstrated differing capacitive
effects within different types of soil, but these were
typically found to be minimised towards the end of
the 25ms half cycles.
The temperature readings were made using probe
heads consisting of two, 1N4148 diodes in series,
forward biased by a known, fixed, small current
(nominally 8.8uA), provided by the PIC CTMU
constant current source. The forward voltage
developed by the diodes under these circumstances
is linearly proportional to the temperature
(Yedamale, 2009) but with a negative slope co-
efficient. These were buried in the soil at a depth of
approximately 5cm and readings taken every 15 to
21 minutes. Resolution was in the region of 0.2´C.
To reduce random noise, each stated reading is
the average of 64 readings taken approximately
20uS apart. A 1K Ohm resistor was used in series at
the PIC end to limit the current in the event of a
short circuit in the probe or its wiring.
The system was powered from three 1.5V
alkaline AA cells. Whilst the PIC is in sleep mode,
current consumption (including regulator leakage) is
less than 100uA. Current consumption peaks at
around 4mA for around 1 second every 15 minutes,
thus, based on a nominal capacity of 1200mAh, the
power source can be sustained in excess of a year
provided the unit is not subjected to wide extremes
of temperature which would reduce battery life. The
MCP1700-330 regulator was chosen for low drop
out and low quiescent current reasons.
All the electronics and batteries were housed in a
small IP56 rated ABS box, with an LED protruding
from the top, connected to the PIC via a 1K resistor.
This allowed both status indication and monitoring
of the external brightness level, providing a
convenient day/night reference channel.
A typical PIC18F family member has 64Kbytes
of flash memory, with the program code taking less
than 2K, this leaves more than adequate storage
space for over 7000 readings to be logged. At 3
minute intervals, this allowed readings to be logged
for experiments in excess of 14 days. For longer
term field use, with readings taken every 20 minutes,
these units could be deployed in trials of up to 3
months. For larger data storage capacity options see
Section 4.
Total component cost of each unit was less than
10 Euros including probes, casing and batteries,
making the units ideal for large scale deployment
both for research and practical agronomic use. The
choice of materials and components was made to
improve the likelihood of availability in third world
countries, the main PCB being pre-manufactured,
whilst final assembly would be performed locally.
Three experimental trials were performed. The
first over a four day period in a clay based soil,
during which several bouts of heavy rainfall
occurred.
For the second trial the unit was repositioned into
a recently prepared almond orchard, again in a
SENSORNETS2014-InternationalConferenceonSensorNetworks
374

Figure 2: First trial of the system during rainstorms.
clay based soil. The unit was left to record data for 6
days.
The third trial was conducted with a second unit
installed at a Research Vineyard facility, where
individual vines are placed in separate pots in a
mulch based soil. These pots were raised off the
ground and attached to a sophisticated crop
management and irrigation system consisting of
lysimeters and automatic soil drainage systems. The
pots were shielded from direct rainfall. This trial was
run for 4 days.
3 RESULTS
Table 1 shows the calculated resistance values for
typical samples of clay, mulch and sand media, both
after drying, and after typical horticultural irrigation.
These values were calculated from the measured
values of current and voltage observed by the sensor.
Also given are their normalised resistivity
equivalents. These values were found to be
consistent with established values typical of these
soil types (Dobrin, 1988).
Figure 2 shows the temperature of the air (Pink
trace), the temperature of the soil (Yellow), the
brightness level (Maroon) and the measured Wenner
resistance (Brown) of the soil.
The 4 daily cycles are immediately apparent in
the brightness plot, showing that the system was
activated early in the afternoon and was deactivated
mid morning.
It is assumed that the irregularities seen at the
troughs of the brightness plot correspond to differing
cloud conditions and moonlight.
The temperature plots also follow a daily cycle
showing warming in the morning and steady cooling
from mid afternoon until the following morning.
The temperature of the soil can be clearly seen to
lag the temperature of the air as would be expected.
The Wenner resistance plot shows an initial
period of drying (indicated by increasing resistance),
which stops abruptly at dawn as a particularly heavy
shower of rain soaked the ground at this time. This
plot then levels out as the bulk of the moisture sinks
in the soil, passing the length of the rod and then the
plot rises again as moisture levels close to the
surface fall and thus resistance increases.
A second period of heavy rainfall then occurs
around midnight of the second night, followed by a
lighter, but more persistent shower mid morning of
the next day and again during the following night,
where a sudden drop in brightness level, Wenner
AMinimalCost,SoilMoistureMeasurementSystem-LoggingWennerArrayResistivitywithaMicrocontrollerforLess
than10Euros
375
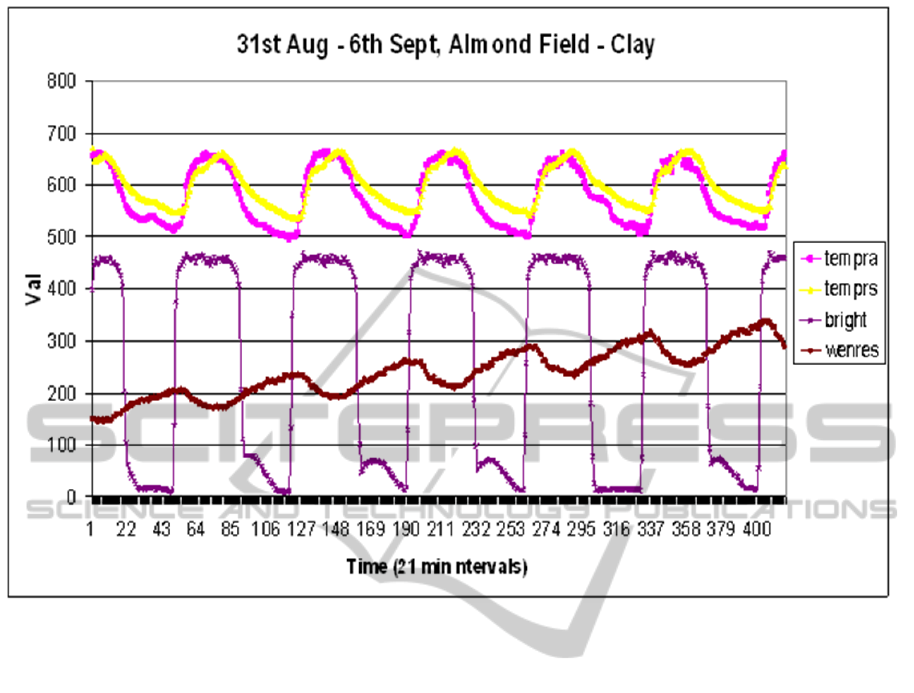
Figure 3: Six day trial in Almond Field with no rainfall.
resistance and air temperature is recorded. This is
possibly due to sudden reduction in cloud cover
giving reduced reflected light pollution and greater
air cooling.
The final full day experienced further long
lasting but light rainfall, after which no further
rainfall was observed until the following morning
just before the unit was retrieved.
Figure 3 shows the results from the second trial,
after the unit was moved to be situated in a clay
based almond orchard fitted with a slow release
dripper pipe irrigation system.
Once again, the daily brightness cycles are
clearly apparent, together with the daily heating and
cooling cycles of the air and the soil. Again the
temperature lag is seen between air and soil.
Although the moistening effect of the daytime
slow release irrigation is clearly visible,
commencing in the morning and stopping mid
afternoon, this irrigation is unable to compete with
the overall loss of moisture seen in the orchard. This
loss is due to natural drainage, evaporation from the
soil surface and moisture taken in by the almond
trees themselves. Given the high levels of rainfall
observed in the preceding week however, this is to
be expected and moisture levels remained at levels
required to sustain healthy growth of the trees.
This trend is clearly visible by the steady upward
inclination of the resistance plot.
The results for the final trial are shown in Figure
4. Unlike the other trials, this was conducted in a
highly managed research vineyard as described in
section 2. For clarity purposes, the Brightness plot
has been artificially raised in the figure.
Shading of the LED brightness sensor by the
leaves of the vine as the sun passed overhead are
clearly visible and form a daily repeating pattern.
Once again the daily temperature cycles are
apparent.
The vines are clearly irrigated four times a day at
2 hour intervals. Irrigation intensity is obviously
high for a short period, and the system is clearly
carefully managed as despite the long overnight
periods of drainage, the vine pot returns to preset
moisture levels each day during the irrigation.
4 FURTHER DISCUSSION
The probes used in this implementation were low
SENSORNETS2014-InternationalConferenceonSensorNetworks
376

Figure 4: Four day trial in Research Vineyard.
cost culinary grade steel. Over time, and in a variety
of soil types and conditions, these can be expected to
corrode. This will of course have some impact on
the soil however resistance measurement impact is
minimised by the nature of the Wenner Array. In
theory this eliminates effects caused by changes in
probe to soil resistance, however if current levels
become too low, insufficient resolution within the
PIC Analogue to Digital Converter will present
accuracy problems.
The resistivity of the soil is also known to be
affected by the temperature of the soil. For simple,
relative moisture logging, this is not an important
consideration, however if more accurate or absolute
soil moisture measurement is required, the soil
temperature reading can be used to compensate for
this.
The primary design objective for this system was
a minimal cost solution making large scale
deployment in third world countries practical. Where
labour costs are low, it can be more cost effective to
use manpower to deploy and retrieve such devices,
than to increase equipment costs by adding
sophisticated communications capabilities.
However where the socio-economic conditions
permit, the system is extendable by the addition of
low cost (circa 5 Euros) integrated RF transceivers
such as the Hope Alpha TRX module operating in
either 433MHz or 868MHz frequency ranges
(dependent on local legislation). Initial trials with
these modules suggest an effective line of sight
range of around 100m.
These RF units significantly increase current
consumption (using around 25mA during
transmission) but the use of burst transmissions
keeps the average consumption to a minimum.
The local RF transmissions are collected at a
central point (See Figure 5), and collated. Were local
conditions and legislation permit, these can then be
passed on via GSM communications using low cost
cell phone technology such as the OLIMEX PIC-
GSM module (costing less than 100 Euros), which,
shared across 10 to 20 sensors, remains a low cost
solution. Other options include ANT and ANT+ low
power radio technologies, where units are closely
co-located.
The fact that each unit logs its own readings
allows for tolerance of failure in the communications
network. Individual results, or many thousands of
results can be re-sent on demand, once reliable
communications have been re-established.
Alternatively, where monitoring of individual
plants and/or tress is required, the system can be
connected in a wired multi-drop bus arrangement
(See Figure 6), with the communications cable
following the line of the irrigation pipes to reduce
AMinimalCost,SoilMoistureMeasurementSystem-LoggingWennerArrayResistivitywithaMicrocontrollerforLess
than10Euros
377

Figure 5: Local RF sensor network with GSM communications to remote management centre.
the risk of damage. In this configuration, the unit can
be resin encased and powered by separate battery
packs distributed along the cable (see Figure 6).
This would provide further unit cost reduction as
the IP56 box and battery holder represent 30% of the
unit component cost, and the wiring through the
moisture resistant ports of the box represent a
significant manufacturing labour cost. The chosen
PIC supports both UART and MSSP
communications ports to facilitate this.
Once this basic platform is established, the
intention is to provide a range of expansion options
including lateral facing Infra-Red LEDs for fire
detection, ultra-sonic water flow detection in
irrigation pipes and multi-depth temperature and
moisture arrays for moisture profile analysis.
Further uses of the system include tracking water
movement / drainage on slopes and across areas
where changing subsoil topography leads to
irregular irrigation, absorption, runoff and drainage.
The system can also be interfaced to traditional
irrigation systems, turning a simple timer based
on/off irrigation system into a more water efficient
system only irrigating when necessary, and reducing
the risk of over-watering during periods of heavy
rainfall.
Where more detailed measurements are required
over longer timescales, each unit is expandable via
SPI bus using the SPANSION 32Mbit CMOS Flash
Memory chip (costing less than 1 Euro).
For commercial reasons, certain aspects of
implementation, accuracy, sensitivity and calibration
have had to be omitted from this publication.
5 CONCLUSIONS
This paper has presented results from initial field
trials of a highly cost efficient soil moisture
measurement system.
The system has been demonstrated to provide
useful data in differing soil types.
Local data-logging provides resilience against
communications network failures.
The system is also capable of low cost expansion
to provide a range of additional data and services.
The system can also be used for a range of
topographical analysis applications.
The system can be used to enhance traditional
irrigation systems providing a more efficient use of
scarce water resources.
SENSORNETS2014-InternationalConferenceonSensorNetworks
378

Figure 6: Multi-drop bus configuration for individual plant monitoring.
ACKNOWLEDGEMENTS
The authors would like to thank the following for
their assistance and co-operation : TeleNatura EBT
S.L., Universidad Miguel Hernandez de Elche,
Instituto Valenciano de Investigaciones Agrarias.
REFERENCES
Afa, J. T, and Anaele, C. M, 2010, Seasonal variation of
soil resistivity and soil temperature in Bayelsa State,
American Journal of Engineering and Applied
Sciences 3(4):704-709.
Austin, R. S, and Rhoades, J. D, 1979, A Compact low
cost circuit for reading four-electrode salinity sensors,
Journal of the Soil Science Society of America,
43:808-809.
Bell, J. P, 1973, Neutron Probe Practice, Institute of
Hydrology Report No. 19.
Edlefsen, N. E, and Anderson A. B. C, 1941, The four
electrode resistance method for measuring soil-
moisture content under field conditions, Journal of the
Soil Science Society of America, 51:367-376.
Dobrin, M. B. and Savit C. H, 1988, Introduction to
Geophysical prospecting, 4
th
Edition, McGraw Hill.
Environmental Geophysics, 2011, Resistivity Methods,
http://www.epa.gov/esd/cmb/GeophysicsWebsite/page
s/refernece/methods/Surface_Geophysical_Methods/El
ectrical_Methods/Resistivity_Methods.htm.
Hanson, B. R, Peters, D. W, 2000, Soil types affects
accuracy of dielectric moisture sensors, California
Agriculture 54(3):43-47.
Igboama, W. N, and Ugwu N. U, 2011, Fabrication of
resistivity meter and its evaluation, American Journal
of Scientific and Industrial Research, 2011. 2(5):713-
717.
Ishada, T, and Makino, T, 1999, Effects of pH on
dielectric relaxation of montmorillonite, allophane,
and imogolite suspensions, Journal of Colloid
Interface Science 212:152-161.
Lark-Horovitz K, Johnson V.A, 1959, Methods of
experimental physics: Solid state physics, Academic
Press.
Microchip 2000, PICMicro 18C MCU Family Reference
Manual, DS39500A, Microchip Technology
Incorporated.
Nadler, A, 1991, Effect of soil structure on bulk soil
electrical conductivity (Eca) using the TDR and 4P
techniques, Soil Science 152:199-203.
AMinimalCost,SoilMoistureMeasurementSystem-LoggingWennerArrayResistivitywithaMicrocontrollerforLess
than10Euros
379

Parasnis, D, S, 1986, Principles of Applied Geophysics, 4
th
Edition, Macmillan Publishing Company, New York.
Read, D. W. L, and Cameron, D. R, 1979, Relationship
between salinity and Wenner resistivity for some
dryland soils, Canadian Journal of Soil Science
59:381-385.
Rhoades, J. D, 1979. Inexpensive four-electrode probe for
monitoring soil salinity, Journal of the Soil Science
Society of America, V43:817-818.
Topp, G. C, Davis, J. L, Annan, A. P, 1980,
Electromagnetic determination of soil water content:
Measurements in coaxial transmission lines. Water
Resource Research 16:574-582.
Wenner, F, 1915 A method of measuring earth resistivity,
US. Dept. Com. Bur Standards Sci. Paper 258.
Wobschall, D, 1978, A frequency shift dielectric soil
moisture sensor, IEEE Transactions on Geoscience
Electronics, GE16(2):112-118.
Yedamale, P, 2009, Using the PIC MCU CTMU for
Temperature Measurement, DS93016A, Microchip
Technology Incorporated.
SENSORNETS2014-InternationalConferenceonSensorNetworks
380
