
Methodology to Determine Relationships between Performance
Factors in Hadoop Cloud Computing Applications
Luis Eduardo Bautista Villalpando
1,2
, Alain April
1
and Alain Abran
1
1
Department of Software Engineering and Information Technology - ETS, University of Quebec, Montreal, Canada
2
Department of Electronic Systems, Autonomous University of Aguascalientes, Aguascalientes, Mexico
Keywords: Cloud Computing, Measurement, Performance, Taguchi Method, ISO 25010, Maintenance, Hadoop
Mapreduce.
Abstract: Cloud Computing is a model for enabling ubiquitous, convenient, on-demand network access to a shared
pool of configurable computing resources. Cloud Computing users prefer not to own physical infrastructure,
but instead rent Cloud infrastructure, a Cloud platform or software, from a third-party provider. Sometimes,
anomalies and defects affect a part of the Cloud platform, resulting in degradation of the Cloud
performance. One of the challenges in identifying the source of such degradation is how to determine the
type of relationship that exists between the various performance metrics which affect the quality of the
Cloud and more specifically Cloud applications. This work uses the Taguchi method for the design of
experiments to propose a methodology for identifying the relationships between the various configuration
parameters that affect the quality of Cloud Computing performance in Hadoop environments. This paper is
based on a proposed performance measurement framework for Cloud Computing systems, which integrates
software quality concepts from ISO 25010 and other international standards.
1 INTRODUCTION
Cloud Computing (CC) is a model for enabling
ubiquitous, convenient, on-demand network access
to a shared pool of configurable computing
resources (e.g., networks, servers, storage,
applications, and services) that can be rapidly
provisioned and released with minimal management
effort or service provider interaction (Mell and
Grance 2011). Some CC users prefer not to own
physical infrastructure, but instead rent Cloud
infrastructure, or a Cloud platform or software, from
a third-party provider. These infrastructure
application options delivered as a service are known
as Cloud Services.
Service models for CC are categorized as:
Infrastructure as a Service (IaaS), Platform as a
Service (PaaS), and Software as a Service (SaaS)
(ISO/IEC 2011). The model that relates the most to
the software engineering community is the SaaS
model. Software engineers focus on software
components, and customers use an IT provider’s
applications running on a Cloud infrastructure to
process information according to their processing
and storage requirements. One of the main
characteristics of this type of service is that
customers do not manage or control the underlying
Cloud infrastructure (including network, servers,
operating systems, and storage), except for limited
user-specific application configuration settings.
Performance measurement models (PMMo) for
CC, and more specifically for Cloud Computing
Applications (CCA), should propose a means to
identify and quantify "normal application
behaviour," which can serve as a baseline for
detecting and predicting possible anomalies in the
software (i.e. applications in a Cloud environment)
that may impact in a Cloud application. To be able
to design such PMMo for CCA, methods are needed
to collect the necessary base measures specific to
performance, and analysis models must be designed
to analyze and evaluate the relationships that exist
among these measures.
One of the challenges in designing PMMo for
CCA is how to determine what type of relationship
exists between the various base measures. For
example, what is the extent of the relationship
between the amount of physical memory used and
the amount of information to process by an
application? Thus, this work proposes the use of a
375
Villalpando L., April A. and Abran A..
Methodology to Determine Relationships between Performance Factors in Hadoop Cloud Computing Applications.
DOI: 10.5220/0004725403750386
In Proceedings of the 4th International Conference on Cloud Computing and Services Science (CLOSER-2014), pages 375-386
ISBN: 978-989-758-019-2
Copyright
c
2014 SCITEPRESS (Science and Technology Publications, Lda.)

methodology based on the Taguchi method to
determine how closely the performance parameters
(base measures) involved in the performance
analysis process are related. The Taguchi method
combines industrial and statistical experience, and
offers a means for improving the quality of
manufactured products. It is based on the “robust
design” concept, popularized by Taguchi, according
to which a well designed product should cause no
problems when used under specified conditions
(Taguchi, Chowdhury et al. 2005). Although the
experiment presented in this paper was not
developed in a CC production system, the main
contribution of this work is to propose the Taguchi
method as a way to determine relationships between
performance parameters of CCA.
This paper is structured as follows. Section 2
presents background of concepts related to the
performance measurement of CCA and introduces
the MapReduce programming model, which is used
to develop CCA. In addition, section 2 presents the
PMFCC, which describes the key performance
concepts and sub concepts identified from
international standards. Section 3 presents the
method for examining the relationships among the
performance concepts identified in the PMFCC. In
this section, an experimental methodology based on
the Taguchi method of experimental design, is used
and offers a means for improving the quality of
product performance. Section 4 presents the results
of the experiment and analyzes the relationship
between the performance factors of CCA. Finally,
section 5 presents a synthesis of the results of this
research and suggests future work.
2 BACKGROUND
2.1 Performance Analysis in Cloud
Computing Applications
Researchers have studied the performance of CCA
from various viewpoints. For example, Jackson
(Jackson et al., 2010) analyzes high performance
computing applications on the Amazon Web
Services cloud, with the objective of examining the
performance of existing CC infrastructures and
creating a mechanism to quantitatively evaluate
them. His work is focused on the performance of
Amazon EC2 as a representative example of the
current mainstream of commercial CC services, and
its potential applicability to Cloud-based
environments in scientific computing environments.
He quantitatively examines the performance of a set
of benchmarks designed to represent a typical High
Performance Computing (HPC) workload running
on the Amazon EC2 platform. Timing results from
different application benchmarks are used to
compute a Sustained System Performance (SSP)
metric, which is a derived measure for measuring the
performance delivered by the workload of a
computing system. According to the National
Energy Research Scientific Computing Center
(NERSC) (Kramer et al., 2005), SSP is useful for
evaluating system performance across any time
frame, and can be applied to any set of systems, any
workload, and/or benchmark suite, and for any time
period. In addition, SSP measures time to solution
across different application areas, and can be used to
evaluate absolute performance and performance
relative to cost (in dollars, energy, or other value
propositions). In his work, Jackson shows that the
SSP metric has a strong correlation between the
percentage of time an application spends
communicating and its overall performance on EC2.
Also highlighted, the more communication there is,
the worse the performance became. Jackson
concludes that the communication pattern of an
application can have a significant impact on
performance.
Other researchers focus on applications in
virtualized Cloud environments. For instance, Mei
(Mei et al., 2010) studies the measurement and
analysis of the performance of network I/O
applications (network-intensive applications) in
these environments. The aim of his research is to
understand the performance impact of co-locating
applications in a virtualized Cloud, in terms of
throughput performance and resource sharing
effectiveness. Mei addresses issues related to
managing idle instances, which are processes
running in an operating system (OS) that are
executing idle loops. Results show that when two
identical I/O applications are running together,
schedulers can approximately guarantee that each
has its fair share of CPU slicing, network bandwidth
consumption, and resulting throughput. It also shows
that the duration of performance degradation
experienced is related to machine capacity, workload
level in the running domain, and the number of new
virtual machine (VM) instances to start up.
Although these publications present interesting
methods for performance measurement of CCA, the
approaches used were from an infrastructure
perspective and did not consider CCA performance
factors from a software engineering perspective.
This work bases the performance evaluation of CCA
on frameworks developed for data intensive
CLOSER2014-4thInternationalConferenceonCloudComputingandServicesScience
376

processing i.e. like Hadoop and MapReduce, and by
integrating software quality concepts from ISO
25010, as well as frameworks for Cloud Computing
Systems (CCS) performance measurement. This
approach was taken as a novel way to apply
concepts of software engineering to the new
paradigm of cloud computing.
2.2 The ISO 5939 Measurement
Process Model
The purpose of a measurement process, as described
in ISO 15939 (ISO/IEC 2008), is to collect, analyze,
and report data relating to the products developed
and processes implemented in an organizational unit,
both to support effective management of the process
and to objectively demonstrate the quality of the
products.
ISO 15939 defines four sequential activities in a
measurement process: establish and sustain
measurement commitment, plan the measurement
process, perform the measurement process, and
evaluate the measurement. These activities are
performed in an iterative cycle that allows for
continuous feedback and improvement of the
measurement process, as shown in Figure 1.
The first two activities recommended by the ISO
15939 measurement process, which are: 1) establish
measurement commitment; and 2) plan the
measurement process, were addressed in the work,
"Design of a Performance Measurement Framework
for Cloud Computing” (PMFCC) (Bautista et al.,
2012). In this paper, the bases for the measurement
of Cloud Computing concepts that are directly
related to performance are defined. The PMFCC
identifies terms associated with the quality concept
of performance, which have been identified from
international standards such as ISO 25010 and those
of the European Cooperation on Space
Standardization. The PMFCC proposes a
combination of base measures to determine the
derived measures of a specific concept that
contributes to performance analysis.
2.3 Performance Measurement
Framework for Cloud Computing
2.3.1 Jain’s System Performance Concepts
and Sub Concepts
A well known perspective for system performance
measurement was proposed by Jain (Jain, 1991),
who suggests that a performance study must first
define a set of performance criteria (or
characteristics) to help carrying out the system
measurement process. He notes that system
performance is typically measured using three sub
concepts, if it is performing a service correctly: 1)
responsiveness, 2) productivity, and 3) utilization,
and proposes a measurement process for each. In
addition, Jain notes that there are several possible
outcomes for each service request made to a system,
which can be classified in three categories. The
system may: 1) perform the service correctly, 2)
perform the service incorrectly, or 3) refuse to
perform the service altogether. Moreover, he defines
three sub concepts associated with each of these
possible outcomes which affect system performance:
1) speed, 2) reliability, and 3) availability. Figure 2
presents the possible outcomes of a service request
to a system and the sub concepts associated with
them.
Figure 1: Sequence of activities in a measurement process (adapted from the ISO 5939 measurement process model
(ISO/IEC 2008)).
MethodologytoDetermineRelationshipsbetweenPerformanceFactorsinHadoopCloudComputingApplications
377
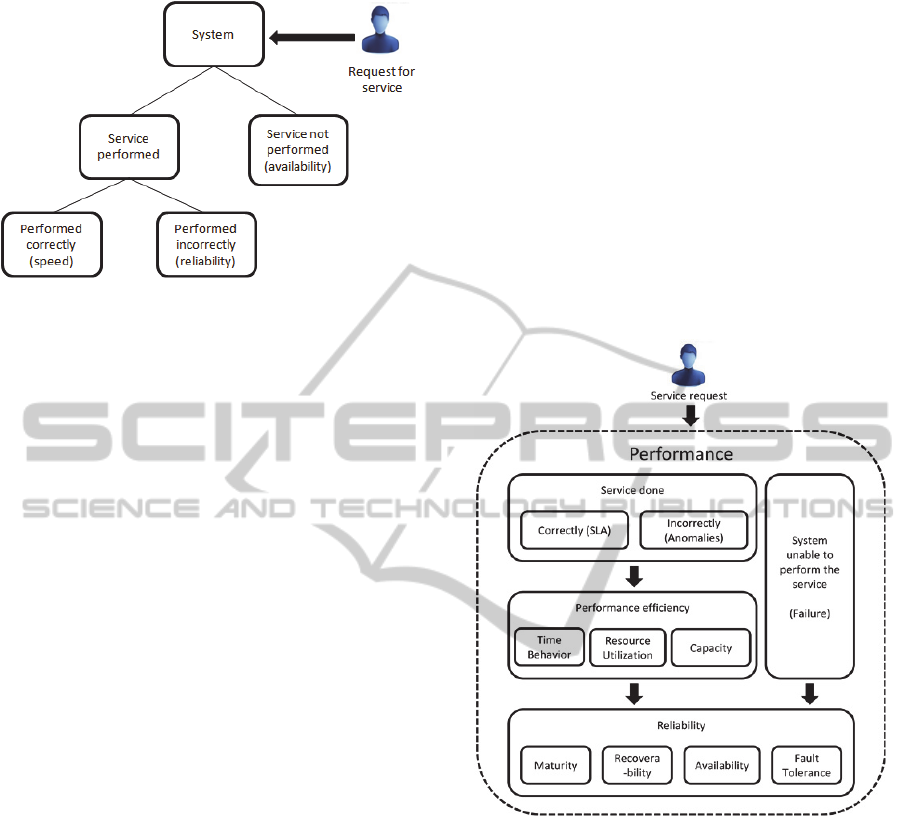
Figure 2: Possible outcomes of a service request to a
system, according to Jain.
2.3.2 Definition of Cloud Computing
Application Performance
The ISO 25010 (ISO/IEC 2011) standard defines
software product and computer system quality from
two distinct perspectives: 1) a quality in use model,
and 2) a product quality model. The product quality
model is applicable to both systems and software.
According to ISO 25010, the properties of both
determine the quality of the product in a particular
context, based on user requirements.
Based on Jain’s performance perspectives and
the main ISO 25010 product quality characteristics,
we propose the following definition of CCA
performance measurement:
“The performance of a Cloud Computing
application is determined by analysis of the
characteristics involved in performing an
efficient and reliable service that meets
requirements under stated conditions and within
the maximum limits of the system parameters.”
Although at first sight this definition may seem
complex, it only includes the sub concepts necessary
to carry out CCA performance analysis.
2.3.3 Definition of the Performance
Measurement Framework for Cloud
Computing
Performance measurement concepts and sub
concepts have previously been related using a
proposed relationship model which was described in
detail in the PMFCC (Bautista et al., 2012) (see in
Figure 3). This model presents the logical sequence,
from top to bottom, in which the concepts and sub
concepts appear when a performance issue arises in
a Cloud Computing System (CCS).
In Figure 3, system performance is determined
by two main sub concepts: 1) performance
efficiency, and 2) reliability. We have observed that
when a CCS receives a service request, there are
three possible outcomes (the service is performed
correctly, the service is performed incorrectly, or the
service cannot be performed). The outcome will
determine the sub concepts that will be used for
performance measurement. For example, suppose
that the CCS performs a service correctly, but,
during execution, the service failed and was later
reinstated. Although the service was ultimately
performed successfully, it is clear that the system
availability (part of the reliability sub concept) was
compromised, and this affected CCS performance.
Figure 3: Model of the relationships between performance
concepts and sub concepts.
Thus, PMFCC defines the base measures related
to the performance concepts that represent the
system attributes, and which can be measured to
assess whether or not the CCA satisfies the stated
requirements. These base measures are grouped into
collection functions, which are responsible for
conducting the measurement process using a
combination of base measures through a data
collector. They are associated with the
corresponding ISO 25010 quality derived measures,
as presented in Table 1.
An example of using the framework is: how can
be measured the CC availability concept (presented
in Table 1) using the PMFCC? As a first step, it
needs three collection functions: 1) the time
CLOSER2014-4thInternationalConferenceonCloudComputingandServicesScience
378

function, 2) the task function, and 3) the
transmission function. The time function can use
several different measurements, such as CPU
utilization by the user, job duration, and response
time. These base measures can be obtained using a
data collector, and then send the measures to a time
function that calculates a derived measure of the
time concept. An intermediate service will be
designed to combine the results of each function in
order to calculate a derived measure of the
availability that contributes to CC performance, as
defined in the framework.
Table 1: Functions associated with Cloud Computing
performance concepts.
Base Measures Collection
Functions for
Measures
ISO 25010
Derived Measures
Failures avoided
Failures detected
Failures predicted
Failures resolved
Failure function Maturity
Resource
utilization
Fault tolerance
Breakdowns
Faults corrected
Faults detected
Faults predicted
Fault function Maturity
Fault tolerance
Tasks entered into
recovery
Tasks executed
Tasks passed
Tasks restarted
Tasks restored
Tasks successfully
restored
Task function Availability
Capacity
Maturity
Fault tolerance
Resource
utilization
Time behaviour
Continuous resource
utilization time
Down time
Maximum response
time
Observation time
Operation time
Recovery time
Repair time
Response time
Task time
Time I/O devices
occupied
Transmission
response time
Turnaround time
Time function Availability
Capacity
Maturity
Recoverability
Resource
utilization
Time behaviour
Transmission errors
Transmission
capacity
Transmission ratio
Transmission
function
Availability
Capacity
Maturity
Recoverability
Resource
utilization
Time behaviour
2.3.4 Hadoop Mapreduce
Hadoop is an Apache Software Foundation’s project,
and encompasses various Hadoop subprojects. The
Hadoop project develops and supports the open
source software that supplies a framework for the
development of highly scalable distributed
computing applications designed to handle
processing details, leaving developers free to focus
on application logic (Hadoop, 2012). MapReduce is
a Hadoop subproject which is a programming model
with an associated implementation for processing
and generating large datasets.
According to Dean (Dean and Ghemawat, 2008),
programs written in this functional style are
automatically parallelized and executed on a large
cluster of commodity machines. Authors like Lin
(Lin and Dyer, 2010) point out that today’s issue,
which is the need to tackle large amounts of data, is
addressed by a divide-and-conquer approach, where
the basic idea is to partition a large problem into
smaller sub problems. Those sub problems can be
processed in parallel by different workers; for
example, threads in a processor core, cores in a
multi-core processor, multiple processors in a
machine, or many machines in a cluster. The
intermediate results of each individual worker are
combined to yield the final output.
3 METHODOLOGY
3.1 Definition of the Problem
To design the proposed collection functions
proposed in the PMFCC (see in Table 1), it is
needed to determine how the various base measures
are related and to what degree. Studying these
relationships enables assess the influence each of
them has on the resulting derived measures. The
PMFCC shows many of the relationships that exist
between the base measures that have a major
influence on the collection functions. In CCA, and
more specifically in the MapReduce applications,
there are over a hundred base measures (including
system measures) which could potentially contribute
to the analysis of CCA performance. A selection of
these measures has to be included in the collection
functions so that the respective measures can be
derived, and from there an indication of the
performance of the applications can be obtained.
There are two key design problems to be solved
here: 1) establish which base measures are
interrelated, and 2) determine how much the
interrelated measures contribute to each of the
collection functions.
In traditional statistical methods, thirty or more
observations (or data points) are typically needed for
MethodologytoDetermineRelationshipsbetweenPerformanceFactorsinHadoopCloudComputingApplications
379

each variable observed, in order to gain meaningful
insight. In addition, a few independent variables are
needed for the experiments designed to uncover
potential relationships among them. These
experiments must be performed under certain
predetermined and controlled test conditions.
However, this approach is not appropriate here,
owing to the large number of variables involved and
the time and effort that would be required, which is
much more than we have allowed for in this step of
the research. Consequently, we have to resort to an
analysis method that is better suited to our
constraints, specific problem and study area. A
possible candidate approach is Taguchi’s
experimental design method, which investigates how
different variables affect the mean and variance of a
process performance characteristic helping in
determining how well the process is functioning.
This method only requires a limited number of
experiments, but is more efficient than a factorial
design in its ability to identify relationships and
dependencies. The next section describes the method
and the concepts to be used.
3.2 Taguchi’s Method of Experimental
Design
Taguchi's Quality Engineering Handbook (Taguchi
et al., 2005) describes the Taguchi method of
experimental design, which was developed by Dr.
Genichi Taguchi, a researcher at the Electronic
Control Laboratory in Japan. This method combines
industrial and statistical experience, and offers a
means for improving the quality of manufactured
products. It is based on the “robust design” concept,
popularized by Taguchi, according to which a well
designed product should cause no problems when
used under specified conditions.
According to Cheikhi (Cheikhi and Abran 2012),
Taguchi’s two phase quality strategy is the
following:
Phase 1: The online phase, which focuses on the
techniques and methods used to control quality
during the production of the product.
Phase 2: The offline phase, which focuses on
taking those techniques and methods into
account before manufacturing the product, that
is, during the design phase, the development
phase, etc.
One of the most important activities in the offline
phase of the strategy is parameter design. This is
where the parameters are determined that make it
possible to satisfy the set quality objectives (often
called the objective function) through the use of
experimental designs under set conditions. If the
product does not work properly (does not fulfil the
objective function), then the design constants (also
called parameters) need to be adjusted so that it will
perform better. Cheikhi explains that this activity
includes several steps, which are required to
determine the parameters that satisfy the quality
objectives (output).
According to Taguchi's Quality Engineering
Handbook, orthogonal arrays (OA) organizes the
parameters affecting the process and the levels at
which they should vary. The OA show the various
experiments that will need to be conducted in order
to verify the effect of the factors studied on the
output. Taguchi’s method tests pairs of
combinations, instead of having to test all possible
combinations (as in a factorial experimental design).
With this approach, we can determine which factors
affect product quality the most in a minimum
number of experiments.
Taguchi’s OA arrays can be created manually or
they can be derived from deterministic algorithms.
They are selected by the number of parameters
(variables) and the number of levels (states). An OA
array is represented by Ln and Pn, where Ln
corresponds to the number of experiments to be
conducted, and Pn corresponds to the number of
parameters to be analyzed. Table 2 presents an
example of Taguchi’s OA L4, meaning that 4
experiments are conducted to analyze 3 parameters.
Table 2: Taguchi´s Orthogonal Array L4.
No. of
Experiments (L)
P1 P2 P3
1 1 1 1
2 1 2 2
3 2 1 2
4 2 2 1
An OA cell contains the factor levels (1 and 2)
that determine the types of parameter values for each
experiment. Once the experimental design has been
determined and the trials have been carried out, the
performance characteristic measurements from each
trial can be used to analyze the relative effect of the
various parameters.
Taguchi´s method is based on the use of the
signal-to-noise ratio (SNR), which is a measurement
scale that has been used in the communications
industry for nearly a century for determining the
extent of the relationship between the quality factors
in a measurement model. The SNR approach
involves the analysis of data for variability, in which
an input-to-output relationship is studied in the
CLOSER2014-4thInternationalConferenceonCloudComputingandServicesScience
380

measurement system. To determine the effect each
parameter has on the output, the SNR (or SN
number) is calculated by the formula 1. In this
formula
y
i
is the mean value and s
i
is the variance
(
y
i
is the value of the performance characteristic for
a given experiment).
2
2
log10
i
i
i
s
y
SN
(1)
where
i
N
u
ui
i
i
y
N
y
1
,
1
i
N
u
iui
i
i
yy
N
s
1
,
2
1
1
i=Experiment number
u=Trial number
Ni=Number of trials for experiment i
To minimize the performance characteristic
(objective function), the following definition of the
SNR should be calculated:
Ni
u
i
u
i
N
y
SN
1
2
log10
(2)
To maximize the performance characteristic
(objective function), the following definition of the
SNR should be calculated:
i
N
u
ui
i
yN
SN
1
2
11
log10
(3)
Once the SNR values have been calculated for each
factor and level, they are tabulated as shown in
Table 3, and then the range R (R = high SN - low
SN) of the SNR for each parameter also is calculated
and entered into Table 3.
Table 3: Rank for SNR values.
Level P1 P2 P3
1 SN
1,1
SN
2,1
SN
3,1
2 SN
1,2
SN
2,2
SN
3,2
3 SN
1,3
SN
2,3
SN
3,3
Range R
P1
R
P2
R
P3
Rank --- --- ---
According to Taguchi’s method, the larger the R
value for a parameter, the greater its effect on the
process.
3.3 Experiment
3.3.1 Experimental Setup
All the experiments were conducted on a DELL
Studio Workstation XPS 9100 with an Intel Core i7
12-core X980 processor running at 3.3 GHz, 24 GB
DDR3 RAM, a Seagate 1.5 TB 7200 RPM SATA
3Gb/s disk, and a 1 Gbps network connection. We
used a Linux CentOS 5.8 64-bit distribution and Xen
3.3 as the hypervisor. This physical machine hosts
five virtual machines (VM), each with a dual-core
Intel i7 configuration, 4 GB RAM, 10 GB virtual
storage, and a virtual network interface type. In
addition, each VM executes the Apache Hadoop
distribution version 0.22.0, which includes the
Hadoop Distributed File System (HDFS) and
MapReduce framework libraries. One of these VM
is the master node, which executes NameNode
(HDFS) and JobTracker (MapReduce), and the rest
of the VM are slave nodes running DataNodes
(HDFS) and JobTrackers (MapReduce).
The Apache Hadoop distribution includes a set
of applications for testing the performance of a
cluster. According to Hadoop (Hadoop 2012), these
applications can test various cluster characteristics,
such as network transfer, storage reliability, cluster
availability, etc. Four applications were selected to
obtain performance measures from the Hadoop
cluster as for example; the amount of physical
memory used by a Job is a measure that varies
according to values given to configuration
parameters, such as the number of files to process,
the amount of information to process, etc. The
viewpoint taken for the selection of the above
applications is that it is possible to use the same
type’s o parameters to configure each application as
well as cluster machine.
Below is a brief description of the applications
used in the experiments:
1. TestDFSIO. This is a MapReduce application
that reads and writes the HDFS test. It executes
tasks to test the HDFS to discover performance
bottlenecks in the network, to test the hardware,
the OS, and the Hadoop setup of the cluster
machines (particularly the NameNode and the
DataNodes), and to determine the speed of the
cluster in terms of I/O.
2. TeraSort. The goal of this application is to sort
large amounts of data as fast as possible. It is a
benchmark application that combines HDFS
testing, as well as testing of the MapReduce
layers of a Hadoop cluster.
3. MapRedReliability. This program tests the
MethodologytoDetermineRelationshipsbetweenPerformanceFactorsinHadoopCloudComputingApplications
381

reliability of the MapReduce framework by
injecting faults/failures into the Map and Reduce
stages.
4. MapRedTest. This application loops a small job
a number of times, placing the focus on the
MapReduce layer and its impact on the HDFS
layer.
To develop the set of experiments, three parameters
were selected, which can be set with different values
for each type of application. These parameters are:
1) the number of files to process, 2) the total number
of bytes to process, and 3) the number of tasks to
execute in the cluster. Also, a number of different
MapReduce base measures such as Job Duration,
Job Status, Amount of Amount of physical memory
used, etc. were selected as possible quality
objectives (objective function). These base measures
are related to one or more of the performance
derived measures identified in the PMFCC.
3.3.2 Definition of Factors and Quality
Objective
In a virtualized Cloud environment, Cloud providers
implement clustering by slicing each physical
machine into multiple virtual machines (VM)
interconnected through virtual interfaces. So, we
established a virtual cluster with the features
mentioned above, in order to obtain representative
results.
Fifty experiments were performed to test the
Hadoop virtual cluster, varying the three parameters
mentioned previously. In each experiment, four
different applications were executed, and
performance results were recorded for their analysis.
In this way, the set of experiments investigates
the effect of the following variables (or control
factors, according to the Taguchi terminology) on
the output dependent variable:
Number of files to be processed by the cluster
Total number of bytes to be processed by the
cluster
Number of tasks into which to divide the Job
application
According to Taguchi, quality is often referred to as
conformance to the operating specifications of a
system. To him, the quality objective (or dependent
variable) determines the ideal function of the output
that the system should show. In our experiment, the
observed dependent variable is the following:
Amount of physical memory used by the Job
(Mbytes)
3.3.3 Experiment Development
According to the Hadoop documentation, the
number of files and the amount of data to be
processed by a Hadoop cluster will be determined by
the number of processors (cores) available and their
storage capacity. Also, the number of tasks to be
processed by the cluster will be determined by the
total of number of processing units (cores) in the
cluster. Based on the above premises and the
configuration of the experimental cluster, we have
chosen two levels for each parameter in the
experiment. We determine the different levels of
each factor in the following way:
Number of files to process:
o Small set of files: fewer than 10,000 files for
level 1;
o Large set of files: 10,000 files or more for
level 2.
Number of bytes to process, as determined by the
storage capacity of the cluster:
o fewer than 10,000 Mbytes to process for level
1 (a small amount of data to process);
o 10,000 or more Mbytes to process for level 2
(a large amount of data to process).
Number of tasks to create, determined, according
to the MapReduce framework, by the number of
processing units (cores) in the cluster and the
number of input files to process. Since the cluster
has a total of 10 cores, we decided to perform
tests with:
o fewer than 10 tasks for level 1;
o 10 or more tasks for level 2.
Table 4 Presents a summary of the factors, levels,
and values for this experiment.
Table 4: Factors and Levels.
Factor
Number
Factor Name Level 1 Level 2
1
Number of files to
process
< 10,000 ≥10,000
2
Number of MB to
process
< 10,000 ≥10,000
3
Number of tasks
to create
< 10 ≥10
Using Taguchi’s experimental design method,
the selection of the appropriate OA is determined by
the number of factors and levels to be examined.
The resulting OA array for this case study is L4
(presented in Table 2). The assignment of the
various factors and values of this OA array is shown
in Table 5.
CLOSER2014-4thInternationalConferenceonCloudComputingandServicesScience
382

Table 5: Matrix of Experiments.
No. of the
Experiment (L)
Number of
Files
Number of
Bytes
(MB)
Number
of Tasks
1 < 10,000 < 10,000 < 10
2 < 10,000 ≥ 10,000 ≥ 10
3 ≥ 10,000 < 10,000 ≥ 10
4 ≥ 10,000 ≥ 10,000 < 10
Table 5 shows the set of experiments to be
carried out with different values for each parameter
selected. For example, experiment 2 involves fewer
than 10,000 files, the number of bytes to be
processed is greater than or equal to 10,000 Mbytes,
and the number of tasks is greater than or equal to
10.
A total of 50 experiments were carried out by
varying the parameter values. However, only 12
experiments met the requirements presented in Table
5. This set of 12 experiments was divided into three
groups of four experiments each (called trials). The
values and results of each experiment are presented
in Table 6.
Taguchi’s method defined the SNR used to
measure robustness, which is the transformed form
of the performance quality characteristic (output
value) used to analyze the results. Since the
objective of this experiment is to minimize the
quality characteristic of the output (amount of
physical memory used per Job), the SNR for the
quality characteristic “the smaller the better” is
given by formula 4, that is:
Ni
u
i
u
i
N
y
SN
1
2
log10
(4)
The SNR result for each experiment is shown in
Table 7.
According to Taguchi’s method, the factor effect
is equal to the difference between the highest
average SNR and the lowest average SNR for each
factor. This means that the larger the factor effect for
a parameter, the larger the effect the variable has on
the process, or, in other words, the more significant
the effect of the factor. Table 8 shows the factor
effect for each variable studied in the experiment.
Table 6: Trials, experiments, and resulting values.
Trial Experiment Number of Files Mbytes to Process Num. of Tasks Physical Memory (Mbytes)
1 1 10 3 1 185.91
1 2 10 10,000 10 270.65
1 3 10,000 450 10 1589.26
1 4 10,000 10,000 2 105.77
2 1 100 33 2 761.18
2 2 100 10,00 100 605.77
2 3 96,000 29 42 3259.75
2 4 10,000,000 10,000,000 4 100.95
3 1 100 300 1 242.75
3 2 1,000 10,000 1,000 900.95
3 3 1,000,000 3,300 10 770.65
3 4 10,000,000 50,000 2 1112.16
Table 7: SNR results.
Experiment
Number of
Files
Mbytes to
Process
Number of
Tasks
Physical Memory
Trial 1
Physical Memory
Trial 2
Physical Memory
Trial 3
SNR
1 < 10,000 < 10,000 < 10 185.91 761.18 242.75 0.0906
2 < 10,000 ≥ 10,000 ≥ 10 270.65 605.77 900.95 0.5046
3 ≥10,000 < 10,000 ≥ 10 1589.26 3259.75 770.65 0.2665
4 ≥10,000 ≥10,000 < 10 105.77 100.95 1112.16 -0.6263
Table 8: Factor Effect on the Output Objective
Number of
Files
Mbytes to
Process
Number of Tasks
Average SNR at Level 1 0.2976 0.1785 -0.2678
Average SNR at Level 2 -0.1799 -0.4028 0.3855
Factor Effect (difference) 0.4775 0.5813 0.6534
Rank 3 2 1
MethodologytoDetermineRelationshipsbetweenPerformanceFactorsinHadoopCloudComputingApplications
383
4 RESULTS
4.1 Analysis and Interpretation of
Results
Based on the results presented in Table 8, we can
observe that:
Number of tasks is the factor that has the most
influence on the quality objective (physical
memory used) of the output observed, at 0.6534.
Number of Mbytes to process is the second most
influential factor, at 0.5813.
Number of files to process is the least influential
factor in this case study, at 0.4775.
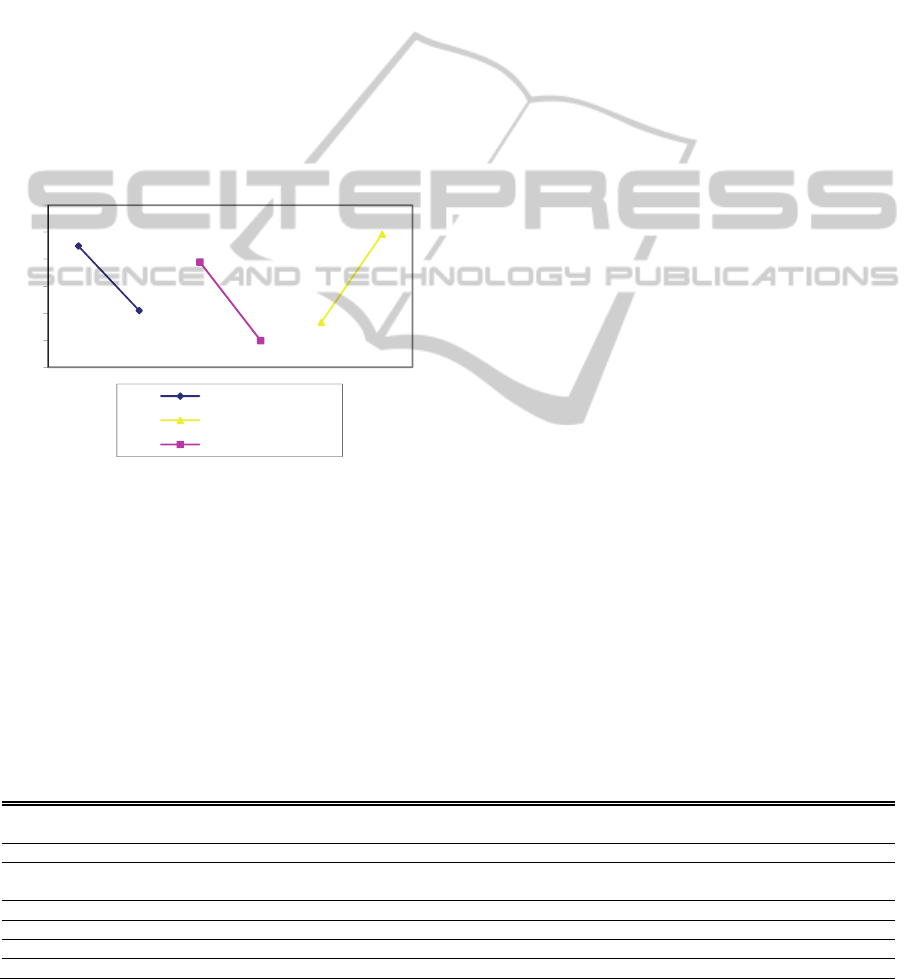
Figure 4 presents a graphical representation of the
factor results and their levels.
Figure 4: Graphical representation of factors and their
SNR levels.
To represent the optimal condition of the levels,
also called the optimal solution of the levels, an
analysis of SNR values is necessary in this
experiment. Whether the aim is to minimize or
maximize the quality characteristic (physical
memory used), it is always necessary to maximize
the SNR parameter values. Consequently, the
optimum level of a specific factor will be the highest
value of its SNR. It can be seen that the optimum
level for each factor is represented by the highest
point in the graph (as presented in Figure 4); that is,
L1, L1, and L2 respectively.
Using the findings presented in Tables 7 and 8
and in Figure 4, we can conclude that the optimum
levels for the factors in this experiment based on the
experimental configuration cluster are:
Number of files to process: The optimum level is
fewer than 10,000 files (level 1).
Total number of Mbytes to process: The
optimum level is fewer than 10,000 Mbytes
(level 1).
Number of tasks to be created to divide the Job:
The optimum level is greater than or equal to 10
tasks or more per Job (level 2).
4.2 Statistical Data Analysis
The analysis of variance (ANOVA) is a statistical
technique usually used in the design and analysis of
experiments. According to Trivedi (Trivedi, 2002),
the purpose of applying the ANOVA technique to an
experimental situation is to compare the effect of
several factors applied simultaneously to the
response variable (quality characteristic). It allows
the effects of the controllable factors to be separated
from those of uncontrolled variations. Table 9
presents the results of this analysis of the
experimental factors.
As can be seen in the contribution column of
Table 9, these results can be interpreted as follows
(represented graphically in Figure 5):
Number of tasks is the factor that has the most
influence (43% of the contribution) on the
physical memory in this case study.
Total number of bytes to process is the factor
that has the second greatest influence (34% of
the contribution) on the processing time.
Number of files is the factor with the least
influence (23% of the contribution) on the
processing time in the cluster.
Table 9: Analysis of Variance (ANOVA).
Factors
Degrees of
Freedom
Sum of Squares
(SS)
Variance
(MS)
Contribution
(%)
Variance
ration (F)
No. of files 1 0.2280 0.2280 23
Total no. of bytes to
process
1 0.3379 0.3379 34 2
No. of tasks 1 0.4268 0.4268 43 3
Error 0 0.0000 0.0000
Total 3 0.9927
Error estimate 1 0.2280
L1
L2
L1
L2
L1
L2
‐0,6
‐0,4
‐0,2
0
0,2
0,4
0,6
NumberofFiles
Numberoftasks
Mbytestoprocess
CLOSER2014-4thInternationalConferenceonCloudComputingandServicesScience
384
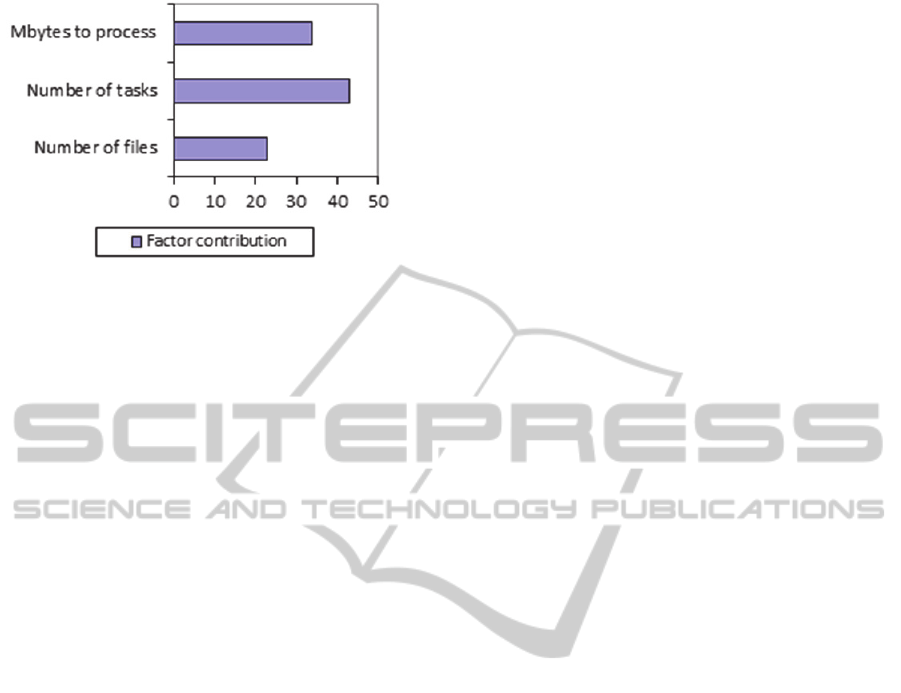
Figure 5: Percentage contribution of factors.
In addition, based on the column related to the
variance ratio F shown in Table 9, we can conclude
that the following:
The factors Number of tasks and Number of
Mbytes to process have the most dominant effect
and the second most dominant effect on the
output variable respectively.
According to Taguchi’s method, the factor with
the smallest contribution is taken as the error
estimate. So, the factor Total number of files to
process is taken as the error estimate, since it
corresponds to the smallest sum of squares.
The results of this case study show, based on both
the graphical and statistical data analyses of the
SNR, that the number of tasks into which to divide
the Job in a MapReduce application in our cluster
has the most influence, followed by the number of
bytes to process, and, finally, the number of files.
To summarize, when an application is developed in
the MapReduce framework to be executed in this
cluster, the factors mentioned above must be taken
into account in order to improve the performance of
the application, and, more specifically, the output
variable, which is the amount of physical memory to
be used by a Job.
5 SUMMARY
One of the challenges in CC is to deliver good
performance to its end users. In this paper, we
present the results of using a method that determines
the relationships among the CCA performance
parameters. This proposed method is based on a
performance measurement framework for Cloud
Computing (PMFCC) system, which defines a
number of terms that are necessary to measure the
performance of CCS using software quality
concepts. The PMFCC defined several collection
functions which are automated to obtain derived
measures and enable analysis of the performance of
a CCA. One of the challenges we faced in designing
these functions was to decide how to determine the
extent to which the base measures are related, and
their influence in the analysis of CCA performance.
To address this challenge, we proposed the use of
Taguchi’s method of experimental design.
Using this experimental design method, we
carried out experiments to analyze the relationships
between the configuration parameters of several
Hadoop applications and their performance quality
measures based on the amount of physical memory
used by a Job. We found that there is a strong
relationship between the number of tasks executed
by a MapReduce application and the amount of
physical memory used by a Job. Our next research
activity will be to reproduce this experiment in a
production environment, in order to confirm these
‘trial group’ results with greater certainty. Also, this
early research work serves as a basis for a next
activity that will need to determine the most
important relationships between the performance
concepts defined in the PMFCC and enable us to
propose a robust model for CCA performance
analysis.
Further research is also needed on the design of
measurement models and mechanisms to analyze the
performance of a real Cloud Computing application,
which could also contribute to further validate our
proposed method. Such evaluation work would
include performance concepts related to software,
hardware, and networking. These concepts would be
mapped to the collection functions identified in the
PMFCC previously developed in order to improve it.
We expect that it will be possible, based on this
work, to propose a robust model in future research
that will be able to analyze Hadoop cluster behavior
in a real Cloud Computing environment. This would
allow real time detection of anomalies that affect
CCS and CCA performance.
REFERENCES
Bautista, L., A. Abran, et al. (2012). "Design of a
Performance Measurement Framework for Cloud
Computing." Journal of Software Engineering and
Applications 5(2): 69-75.
Cheikhi, L. and A. Abran (2012). "Investigation of the
Relationships between the Software Quality Models of
ISO 9126 Standard: An Empirical Study using the
Taguchi Method." Software Quality Professional
Magazine.
Dean, J. and S. Ghemawat (2008). "MapReduce:
MethodologytoDetermineRelationshipsbetweenPerformanceFactorsinHadoopCloudComputingApplications
385

simplified data processing on large clusters."
Communications of the ACM 51(1): 107-113.
Hadoop, A. F. (2012). "What Is Apache Hadoop?", from
http://hadoop.apache.org/.
ISO/IEC (2008). ISO/IEC 15939:2007 Systems and
software engineering — Measurement process.
Geneva, Switzerland, International Organization for
Standardization.
ISO/IEC (2011). ISO/IEC 25010: Systems and software
engineering – Systems and software product Quality
Requirements and Evaluation (SQuaRE) – System and
software quality models. Geneva, Switzerland,
International Organization for Standardization: 43.
ISO/IEC (2011). ISO/IEC JTC 1 SC38:Study Group
Report on Cloud Computing. Geneva, Switzerland,
International Organization for Standardization.
Jackson, K. R., L. Ramakrishnan, et al. (2010).
Performance Analysis of High Performance
Computing Applications on the Amazon Web Services
Cloud. IEEE Second International Conference on
Cloud Computing Technology and Science
(CloudCom), Washington, DC, USA, IEEE Computer
Society.
Jain, R. (1991). The Art of Computer Systems
Performance Analysis: Techniques for Experimental
Design, Measurement, Simulation, and Modeling.
New York, NY, John Wiley & Sons - Interscience.
Kramer, W., J. Shalf, et al. (2005). The NERSC Sustained
System Performance (SSP) Metric. California, USA,
Lawrence Berkeley National Laboratory.
Lin, J. and C. Dyer (2010). Data-Intensive Text
Processing with MapReduce. University of Maryland,
College Park, Manuscript of a book in the Morgan &
Claypool Synthesis Lectures on Human Language
Technologies.
Mei, Y., L. Liu, et al. (2010). Performance Measurements
and Analysis of Network I/O Applications in
Virtualized Cloud. IEEE International Conference on
Cloud Computing, CLOUD 2010, Miami, FL, USA,
IEEE.
Mell, P. and T. Grance (2011). The NIST Definition of
Cloud Computing. Gaithersburg, MD, USA,
Information Technology Laboratory, National Institute
of Standards and Technology: 2-3.
Taguchi, G., S. Chowdhury, et al. (2005). Taguchi's
Quality Engineering Handbook, John Wiley & Sons,
New Jersey.
Trivedi, K. S. (2002). Probability and Statistics with
Reliability, Queuing and Computer Science
Applications. New York, U.S.A., John Wiley & Sons,
Inc.
CLOSER2014-4thInternationalConferenceonCloudComputingandServicesScience
386
