
What to Show?
Automatic Stream Selection among Multiple Sensors
R
´
emi Emonet
1
, E. Oberzaucher
2
and J.-M. Odobez
3
1
Laboratoire Hubert Curien UMR CNRS 5516, Universit
´
e Jean Monnet, St-Etienne, France
2
Dpt of Anthropology, University of Vienna, Vienna, Austria
3
Idiap Research Institute, 1920 Martigny, Switzerland
Keywords:
Stream Selection, Camera Network, Probabilistic Models, Temporal Topic Models.
Abstract:
The installation of surveillance networks has been growing exponentially in the last decade. In practice, videos
from large surveillance networks are almost never watched, and it is frequent to see surveillance video wall
monitors showing empty scenes. There is thus a need to design methods to continuously select streams to be
shown to human operators. This paper addresses this issue and make three main contributions: it introduces
and investigates, for the first time in the literature, the live stream selection task; based on the theory of social
attention, it formalizes a way of obtaining some ground truth for the task and hence a way of evaluating stream
selection algorithms; and finally, it proposes a two-step approach to solve this task and compares different
approaches for interestingness rating using our framework. Experiments conducted on 9 cameras from a metro
station and 5 hours of data randomly selected over one week show that, while complex unsupervised activity
modeling algorithms achieve good performance, simpler approaches based on amount of motion perform
almost as well for this type of indoor setting.
1 INTRODUCTION AND
PREVIOUS WORK
There is an ever increasing number of sensors de-
ployed in the real world, being it in large scale sen-
sor networks or closed-circuit television (CCTV) net-
works. Exploitation of these cameras fulfill several
needs: safety, when the physical integrity of people in
a given environment need to be ensured (e.g., when
people go in or out a metro train, or by detecting
events that could lead to accidents in traffic infrastruc-
tures); security and protection of equipment through
the detection of anti-social behaviors and vandalism;
and efficiency, e.g., through the identification of typi-
cal flux and detection of congestions that can be com-
municated appropriately to users.
However, most of the time, surveillance network
videos are never watched. For instance, in our case,
28 monitors are used in the control room to supervise
more than 800 cameras. The probability to watch the
right streams at the right time is therefore very lim-
ited. Moreover, the operator vigilance also appears to
be a core criterion that strongly influences CCTV ef-
fectiveness, especially when a constant human moni-
toring is required. As vigilance studies confirm, oper-
ators who spend hours screen gazing at static scenes
tend to become bored and less efficient, and are then
likely to miss low-frequency events, such as a person
falling or jumping over a turnstile.
Thus, along with top-down user-based protocols
for visualizing and browsing the video networks, and
the detection of predefined event, there is a need for
bottom-up automatic and content-based selection sys-
tems that provide surveillance operators with the most
salient and informative data streams within an adap-
tive real-time process. To address this issue, un-
usual event detection (Zhong et al., 2004; Boiman
and Irani, 2007; Hua et al., 2009) and abnormality
rating algorithms (Zelniker et al., 2008; Varadarajan
and Odobez, 2009; Emonet et al., 2011) have been
proposed in the past. Although these algorithms are
obviously related to this paper, none of them has ad-
dressed the stream selection task as we propose in this
paper.
Commercial systems tends to use the amount of
motion and person tracking in order to select cameras
with a high level of activity, in this paper we try to
investigate how relevant this choice is. Recent related
work also includes work that both model the content
of the videos and monitor the operator with a cam-
433
Emonet R., Oberzaucher E. and Odobez J..
What to Show? - Automatic Stream Selection among Multiple Sensors.
DOI: 10.5220/0004688504330440
In Proceedings of the 9th International Conference on Computer Vision Theory and Applications (VISAPP-2014), pages 433-440
ISBN: 978-989-758-004-8
Copyright
c
2014 SCITEPRESS (Science and Technology Publications, Lda.)
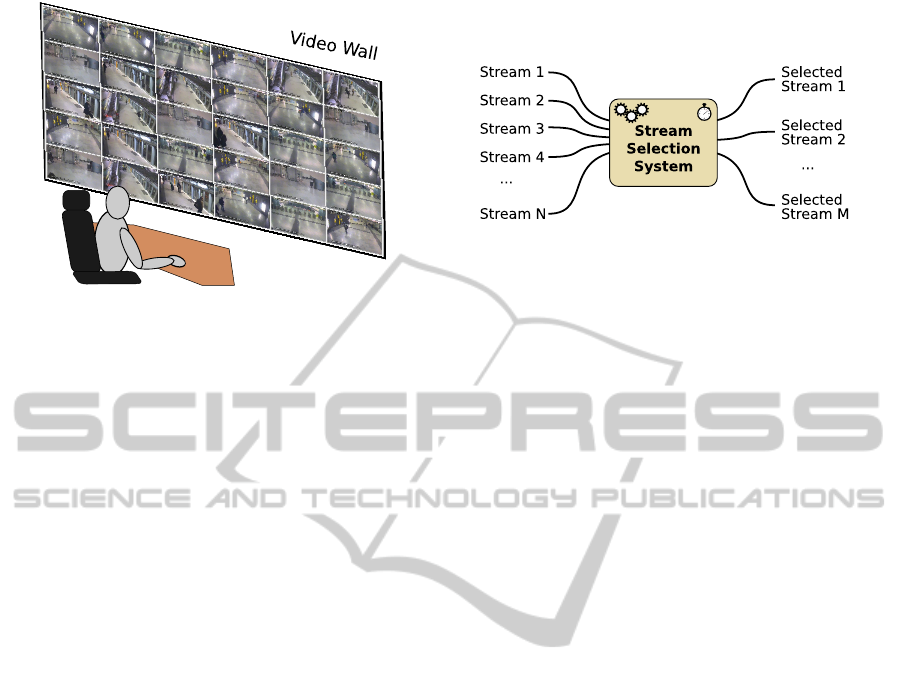
a) b)
Figure 1: a) An operator in front of a video wall. b) Stream selection task: at any time instant, select the M streams, among
N, that are the most meaningful to show to a human operator.
era such as in (Atrey et al., 2011). We consider a
setup where observing the operator is not an option
and where only the content of the videos is used to
select the stream to display.
In this article, we explore the stream selection is-
sue. First, in Section 2, we formalize the task. Then,
in Section 3, we propose an approach for collecting
ground truth for the task, based on human estima-
tion of interestingness done by 100 persons on videos
coming from 9 cameras and spread over one week.
Section 4 describes the approaches used to solve this
task together with the performance measure we pro-
pose to evaluate these approaches. The experimental
results are detailed in Section 5. Finally, our conclu-
sions and future work is presented in Section 6.
2 DEFINING THE STREAM
SELECTION TASK
The ultimate goal of stream selection algorithms is
to allow the automatic pre-selection of some audio
or video streams to present to a human operator for
further screening. More formally, given a set of N
streams, the system must continuously select the M
ones that are the most meaningful to show to an oper-
ator. Defining what relevance criterion has to be used
is an open problem and in the following sections, we
use human attention as a cue. Also, even if not consid-
ered in our evaluations, the selection must be consis-
tent in time, for example it should avoid screen flick-
ering and avoid showing continuously the same views
(unless it is sure these are very relevant).
Figure 1 illustrates the context and the task. In
Figure 1a), an operator looking at a video wall is
depicted. In Figure 1b) the stream selection task is
shown, with the N input streams and the M streams
selected by the system and to be shown to the opera-
tor.
3 SOCIAL ATTENTION AND
GROUND TRUTH
The ground truth dataset eventually used for the eval-
uation of the stream selection task is based on an ex-
periment on social attention, described in Section 3.1.
We follow the idea that human attention can act as a
guide for the selection of interesting sensors.
3.1 Button Clicking Experiments
We carried out an experiment where we simultane-
ously showed multiple movies to our subjects, and
they had to press a button corresponding to the screen
that showed something interesting. For this purpose,
we created a set of 2-minute long movie chunks. We
considered 9 cameras from a camera network de-
ployed in a public transportation system. We ran-
domly picked 150 starting times across a week pe-
riod, and for each starting time, we created 2-minute
chunks for all 9 camera views starting at these times.
These 150×9 movies are the basis for the attention
study.
An environment called the “Virtual Operator”
have been used for data collection. Figure 2 shows
a picture of the virtual operator setup. The virtual op-
erator simultaneously shows four synchronized video
streams on a 2 by 2 grid of screens. Each screen
shows a shot from a different surveillance camera.
Every two minutes, a new set of movies is randomly
brought up to the screens.
Whenever the subject sees something interesting
on one of the screens, he or she has to press a but-
VISAPP2014-InternationalConferenceonComputerVisionTheoryandApplications
434

Figure 2: The setup for the Virtual Operator experiment on
social attention. The subject is exposed to 4 synchronized
videos. Whenever something interesting is happening on
one of the screen, the user have to press the button corre-
sponding to the screen. Every two minutes, the videos are
changed; and b) an illustration of the window-based and
Gaussian-smoothing-based filtering for button clicks.
ton indicating the respective monitor. The participants
had to fill out some questionnaires prior to and af-
ter the experiment. In total 52 male and 51 female
subjects (mean age 23.78) participated in the study.
Each 2 minute chunk was watched between 14 and
18 times.
First, we see that attention is clearly not randomly
distributed over the movies. The random probability
of two subjects hitting the same button at the same
time (same frame, at 5 frames per second) is 0.0016.
By analyzing the distribution of the button clicks, we
observe that clicks tend to cluster around some in-
stants and views of interest.
Overall, we can retained the following observa-
tions: a) the attention is not randomly distributed, b)
there are certain scene properties that suggest atten-
tion, and c) there is some degree of random clicks.
This experiment suggests that, once cleaned, the but-
ton clicks can be a good indicator of the video stream
interestingness. We thus use these interestingness
clicks for the creation of a ground truth, making the
assumption that the interestingness clicks are related
to which stream should be selected in the task of
stream selection.
3.2 Derived Ground Truth
From the button clicks, we derive a “annotation
database” that we will use for the evaluation of stream
selection algorithms. Overall, the annotation database
can be seen as a list of annotated instants where peo-
ple marked a single view. Each instant has a times-
tamp, the ordered list (set) of the views shown and
the index of the view that was marked by the subject.
More formally we can define the annotation database
as:
A = {A
i
}
i=1..n
= {(t
i
, V
i
, u
i
)}
i=1..n
where n is the number of annotations, A
i
is the i
th
an-
notation in the list, t
i
is its timestamp, V
i
is the list of
shown views and u
i
is the index of the view marked
as interesting (V
i
(u
i
) thus being the selected view). In
the raw button click dataset presented before, there
are 9 possible views (i.e., each element of V
i
can take
9 different values) and n is almost 10000 and realized
by around 100 subjects. The timestamp is a pointer
to any instant (a frame) within one of the 150 slots
(each, long of 2 minutes) that were extracted over one
full week. Each annotation provide information about
the selected view versus the 3 others but does not pro-
vide information between these 3 other views.
There is a actually a mismatch between the button
clicks and the goal of the stream selection system: the
complete system should be able to continuously se-
lect which stream(s) to show, while the button clicks
are sparse. For the evaluation measure presented in
Section 4.1, we thus make the assumption that only
the instant that have been clicked by some users are
meaningful for the evaluation. Said the other way
around: on the periods where there are no clicks, the
selection algorithms can produce any results without
being penalized.
3.3 Robust Ground Truth
We observed some user clicks are random. Also, as
some subjects might be quicker to respond than oth-
ers, it is problematic to instantaneously link the button
clicks to the respective scene in the video. Apart from
considering the raw button clicks we also considered
a smoothed version of the “annotations”.
We run a Gaussian smoothing function over the
click results, generating a continuous index of inter-
estingness (IoI). The IoI is taking into account multi-
ple button presses within a small time span account-
ing for the temporal uncertainty of the raw button
clicks. A threshold on the IoI value is used to decide
whether an annotation should be kept. The threshold
can be tuned to control the robustness of the result-
ing dataset. The provided results are obtained with
around 10000 annotation for the raw case and around
2000 for the smoothed one.
4 EXPERIMENTAL SETUP
The goal of a stream selection system is to select the
M among N streams to display to an operator. Almost
WhattoShow?-AutomaticStreamSelectionamongMultipleSensors
435

equivalently, we can consider that the system task is to
rank the streams by interestingness and the first ones
are displayed. We thus suppose that the output of an
algorithm algo at any time instant t
eval
and for a set of
views V
eval
is a ranking of the camera views (or their
indices). For instance, algo(t
eval
, V
eval
) = (3, 1, 2, 4)
means that the third streams is the most interesting to
show, then the first stream, then second and fourth.
For performance measurement, we make the assump-
tion that the instants where stream selection matters
are only the ones which have been clicked by the hu-
man subjects.
4.1 Performance Measure
At each marked instants, the ideal selection algorithm
would rank first the stream that was marked by the
human subject. A less effective algorithm would rank
this stream second, and so on, the worse in our case
being to rank it 4 (as there are 4 views shown at any
time). To analyze the performance of an algorithm,
we can thus look at the distribution of the rank pro-
duced by the algorithm for the clicked instant. More
precisely, we compute the proportion of times the al-
gorithm ranked the mark stream first, second, third
and fourth:
∀r ∈ 1..4 (1)
p
algo
(r) =
1
n
×Card{i|algo(t
i
, V
i
)(r) = u
i
} (2)
=
1
n
× num. clicked u
i
ranked r by algo
(3)
This distribution (p
algo
(r)) in itself is a complete de-
scription of the performance of the algorithm. From
this distribution, we could extract more synthetic nu-
merical performance measures by giving different
weights to the different ranking errors. For example,
if we are interested in the percentage of time the algo-
rithm performs in perfect accordance with the annota-
tions, we can just take the value of p
algo
(1). Average
precision is algo a common measure and corresponds
to
∑
4
r=1
1
r
p
algo
(r).
4.2 Modular Architecture for Selection
The stream selection algorithms are responsible for
providing a ranking or a selection of the cameras to
show to the operator. Most algorithms are providing
an interestingness rating at each instant for a camera.
If we want to be able to integrate information across
cameras and to mix different algorithms in a system
(some can be more effective on some cameras), we
have to consider a kind of normalization of the mea-
sures across cameras. The overall stream ranking sys-
tem follows the architecture shown in the Figure 3:
• each video stream is processed independently by
the interestingness/abnormality rating algorithm;
• a possible normalization step is performed in or-
der to provide comparable abnormality measures
across views and algorithms. Normalization pa-
rameters are typically learnt without supervision
using statistics on the abnormality measure on
some (unlabeled) learning videos.
• the normalized abnormality scores are used as the
inputs of a ranking algorithm whose goal is to pro-
duce the final ranking of the camera views. The
simplest ranking algorithm (that we have used
in the reported experiments) just ranks the views
according to their normalized abnormality score.
Temporal integration (not done here), which en-
sures stability in the views shown to the operator,
would also take place in the final ranking algo-
rithm.
In the experiments, we consider a single stream
ranking algorithm: it simply sorts the streams based
on their normalized interestingness measure. For the
stream interestingness rating algorithms and for the
normalization algorithms, we considered different al-
gorithms detailed in the following subsections.
4.3 Considered Interestingness Rating
Algorithms
We consider multiple algorithms: two simple baseline
algorithms, a method from the state of the art (Emonet
et al., 2011) with variations, and a mixture of meth-
ods.
Random
– we just simulate a random interestingness
score at any instant. This pseudo-algorithm is used
only to illustrate the random factor inherent to the
task. This random baseline can also be seen as a ran-
dom ranking of the 4 views of interest. Overall, it is
equivalent to ranking all the views in a uniform ran-
dom manner and thus having 25% of probability for
any of the 4 ranks.
Motion – we use the amount of motion as an inter-
estingness measure given that studies on human at-
tention have shown correlation between motion and
attention. The abnormality score for each view is sim-
ply the amount of detected motion (proportion of im-
age pixels where a motion could be robustly detected)
using a Lucas Kanade method. With no normaliza-
tion, this score will tend to display the camera with
absolutely more motion. With some per-view nor-
VISAPP2014-InternationalConferenceonComputerVisionTheoryandApplications
436
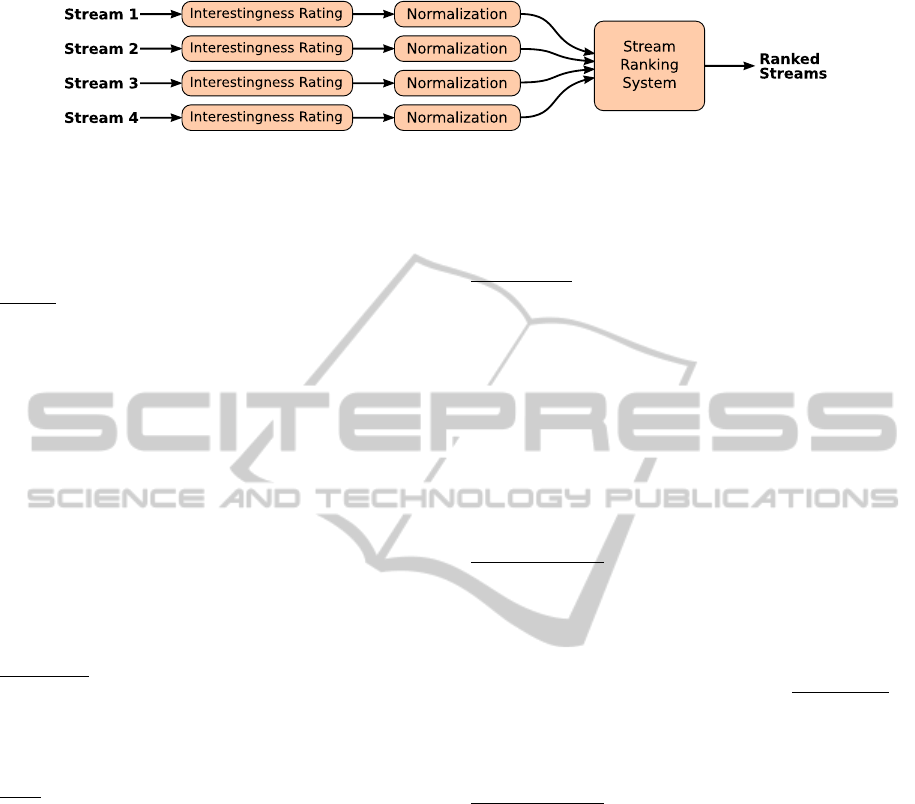
Figure 3: Architecture for the stream selection. Each stream is processed independently: a first algorithm is extracting an
interestingness measure and this measure is then normalized. The normalized measures are used by a simple algorithm that
ranks the streams based on their measures.
malization, the score will favor cameras with more
motion than the view average.
PLSM – we use the Probabilistic Latent Sequential
Motifs (PLSM) that has been used in (Emonet et al.,
2011) to extract an abnormality measure from video.
The principle of PLSM is to learn, in an unsupervised
way, the temporal motifs that are recurrent in a tem-
poral document. Applied to a video with localized
motion features, the algorithm learns the typical ac-
tivities, which are often typical trajectories of objects
within the scene. The authors of (Emonet et al., 2011)
suppose that the recurrent motifs represent the usual,
normal activities and use this supposition to derive an
abnormality score. We use the abnormality score as
an interestingness measure. PLSM has been run, on
each view, on 2 hours of video data with the follow-
ing parameters: 75 topic at low-level, 20 motifs of 15
seconds each.
PLSM-LL – taking the exact same approach as
PLSM, we also experimented with using the negative
log-likelihood of the observations after the fitting of
the PLSM model. The same parameters as for the
PLSM measure have been used.
MIX – we use a combination of methods, where half
of the camera views are rated with “Motion” while the
other half are rated with “PLSM”.
4.4 Considered Normalization Methods
The interestingness rating produced by different algo-
rithms and/or for different camera views might vary
notably in their scale. To be able to merge the views
in a meaningful manner, we need to re-scale them to a
common range of values. Many ways of normalizing
the scores can be imagined and implemented.
In our case we only consider automatic ways of
re-normalizing the abnormality scores. All the nor-
malization parameters are set using a learning datasets
of 2 hours (without any supervision or annotation).
The abnormality score is first extracted on this data (at
each time instant) and then the resulting abnormality
time series is analyzed to produce the normalization
parameters. We considered two kind of normalization
methods.
nonorm (∅) – we just simply don’t normalize the ab-
normality measure. Given the discrepancy between
different rating algorithms, this method is limited to
the cases where only a single type of interestingness
algorithm is used. Still, it makes sense to try this
normalization (actually non-normalization). For ex-
ample, the “motion” measure without normalization
will actually favor the selection of the view with the
absolute most motion. From the experiments, it can
also be meaningful to not normalize the interesting-
ness measure obtained from PLSM as it is also related
to motion.
percent99 (p99) – we explored a normalization based
on the 99
th
percentile. Using the learning set, we
linearly re-normalize the abnormality using a scaling
factor p
99
such that the observed interestingness score
falls below a fixed threshold (e.g., 1) 99% of the time.
The scaling factor is then used to proportionally re-
scale the abnormality, i.e, norm.score =
score−minscore
p
99
−minscore
.
This normalization can be seen as a robust equiva-
lent of re-normalizing using the maximum observed
value.
percent95 (p95) – as with “percent99”, we exper-
imented with a normalization based on other per-
centiles, only 95% being shown (see results). We also
experimented with other percentiles: for high per-
centiles, results are comparable to the 99
th
and 95
th
one, while smaller percentiles lead to lower results.
5 RESULTS
We provide results using the two versions of the but-
ton clicking annotations. First with the raw annota-
tions (about 10000 clicks), then with the Gaussian-
smoothing approach (about 2000 clicks).
5.1 Results using the Raw Ground
Truth
We first evaluate the algorithms introduced previously
on the complete ground truth. As mentioned in Sec-
WhattoShow?-AutomaticStreamSelectionamongMultipleSensors
437

tion 3.3, this ground truth is actually noisy as the hu-
man subject do not agree exactly on the interesting
streams. We evaluate the different algorithms together
with the different normalization methods. Our algo-
rithms are compared against a theoretical random al-
gorithm that would rank the views randomly (no nor-
malization is meaningful).
As for example in Figure 4, the result figures show
the rank distributions for various interestingness algo-
rithm, grouped by normalization method. In a given
graph, there is a line per considered method. For a
given method, the colored bars show the proportion of
clicked views ranked 1
st
, 2
nd
, 3
rd
and , 4
th
by the al-
gorithms. The red bar corresponds to p
algo
(1) and so
on. More weight on the first (leftmost) ranks is better.
We see for example that random (which is repeated on
each graph) has a probability of 0.25 for each of the
ranks. Methods that will be above 0.25 for the first
rank, can be considered as better than random.
The normalization based on percentiles below
95% give systematically lower performance than the
one with 95%. To improve readability, we thus omit
these in the shown graphs. The results show that the
consider algorithms, both motion based and PLSM
based, perform better than the random guess. Despite
the fact that the raw annotations have been found rel-
atively noisy, the gain over random algorithms is im-
portant.
The results also show that the simple motion-
based criterion is almost as good as the more elab-
orated PLSM algorithm. The main observation is that
in this metro setting, human social attention, encoded
in the form of our annotations, is very well linked to
the amount of motion present in the video. Both kind
of abnormality measures derived from PLSM seem
also to be following the behavior of “Motion”. How-
ever, in other contexts like traffic videos, where mo-
tion is present in the form or more regular patterns, the
capacity of algorithms such as PLSM at filtering out
normal activities would be beneficial to detect anoma-
lies as compared to relying on motion only.
In this setup, we observe that normalization has a
small negative on the results. The interpretation can
be that human attention is directed toward the abso-
lute amount of motion and not a motion amount rela-
tive to the normal amount. Actually, noise in the an-
notations is also part of the reason as shown in the
following section.
5.2 Results on Filtered Dataset using
the Gaussian Smoother
We also evaluate the performance of the different al-
gorithms on the ground truth after smoothing by a
Gaussian kernel, as explained in Section 3.3. We var-
ied the threshold on the smoothed index of interest so
as to keep around 2000 evaluation points. Figure 5
shows results with the corresponding results.
Globally, the methods exhibit better accuracy on
the cleaned ground truth. We also observe a more
marked effect of method mixing: results are notably
lower than with each individual methods. When mix-
ing methods, normalization also helps. However, as
observed in the raw case, normalization degrades the
results for individual methods. This again means that
the attention is directed to absolute motion.
Overall, the results with the smooth annotations
consolidate and complete what has been observed
with the raw annotations:
• non-normalized version are preferable for both the
motion-based measure and the PLSM-based one,
• when mixing methods of different scales, as ex-
pected, results degrades and the normalization
helps,
• motion-based and PLSM-based selection both
significantly outperform the random guess algo-
rithm especially on cleaned ground truth,
• on the raw ground truth, the motion-based selec-
tion works best,
• motion-based methods and PLSM-based methods
perform comparably,
• we reach good ranking accuracy of up to 0.6
meaning that 60% of the times the stream clicked
by the human subject is ranked first among four
streams; 85% of the times, the clicked stream is
among the two firsts in the rank provided by the
algorithm.
6 CONCLUSIONS AND FUTURE
WORK
We have introduced the stream selection task and pro-
posed an evaluation protocol for it. The proposed
evaluation is based on a social attention experiment
where human subjects were shown four video streams
at once and were asked to mark a video at any time
they spotted something interesting in it. We tested
various stream selection algorithms to rate the inter-
estingness of the streams at any instant. The video
instants marked by the subjects are used to evaluate
how well the marked video has been ranked by a se-
lection algorithm.
Our evaluations have shown that, considering all
the raw annotations produced by the human sub-
jects, all test approaches were better than random but
VISAPP2014-InternationalConferenceonComputerVisionTheoryandApplications
438
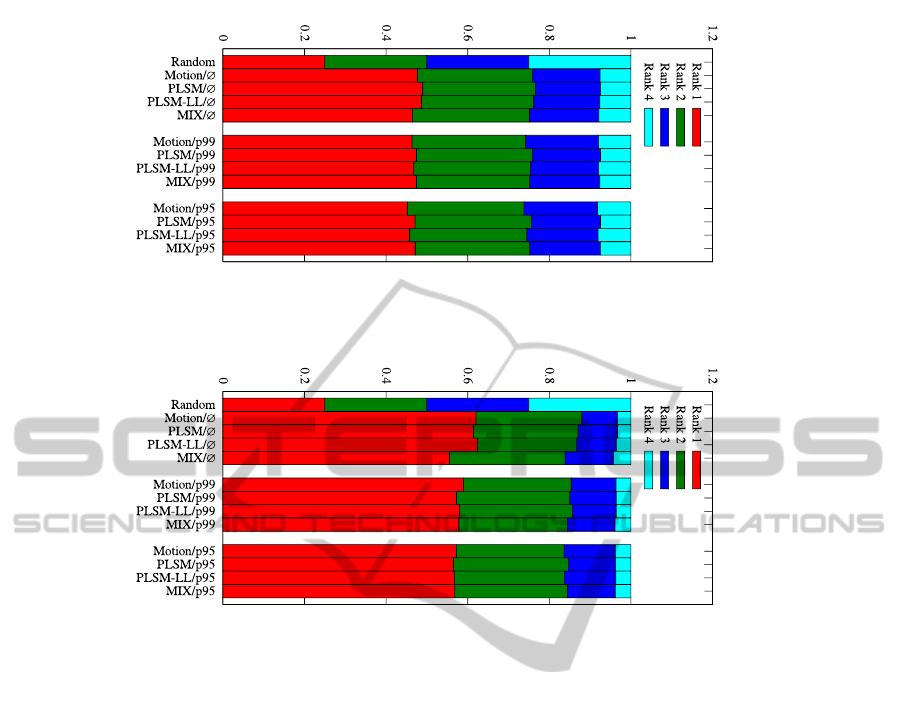
Figure 4: Ranking results on the raw ground truth (9980 evaluation instants) coming directly from the button clicking experi-
ment. For each method (row), the proportion of each rank position is given for the considered annotation points. More weight
on the first (leftmost) ranks is better.
Figure 5: Ranking results on the smoothed ground truth obtained by removing annotations with unsufficient supporting
evidence (total, 2003 evaluation instants).
mostly equivalent to a simple criterion based on the
amount of motion. By filtering the annotations (re-
moving the isolated ones) we obtained a more trustful
set of annotations. On such more robust evaluation
dataset, it has been shown that mixing interestingness
measures of different scale actually poses problem
and that the proposed normalization method helps in
this case.
Overall, the results are encouraging and more in-
terestingness rating algorithms need to be tested and
evaluated in this framework. More advanced normal-
ization methods needs also to be explored: we can
expect to find a normalization procedure that allows
to mix various algorithms without degrading their in-
dividual accuracy. We plan to explore a normaliza-
tion based on robustly aligning every percentile of all
interestingness measures. A possible per-view bias
(e.g., a particular view being almost never interest-
ing) could also be integrated in the normalization pro-
cess if we accept some slight human supervision. Col-
lecting more ground truth, especially with real oper-
ators which have been knowing the camera setup for
months, and making it available for research purpose
is also in our future work direction.
ACKNOWLEDGEMENTS
This work was funded by the European Union FP7
project VANAHEIM (248907) under the 7th frame-
work program.
REFERENCES
Atrey, P. K., El Saddik, A., and Kankanhalli, M. S. (2011).
Effective multimedia surveillance using a human-
centric approach. Multimedia Tools and Applications,
51(2):697–721.
Boiman, O. and Irani, M. (2007). Detecting irregularities in
images and in video. International Journal of Com-
puter Vision, 74(1):17–31.
Emonet, R., Varadarajan, J., and Odobez, J.-M. (2011).
Multi-camera Open Space Human Activity Discovery
for Anomaly Detection. In 8th IEEE Int. Conf. on Ad-
vanced Video and Signal-Based Surveillancei (AVSS),
page 6.
Hua, D., Zhang, X., Yin, J., Zheng, V. W., and Yang, Q.
(2009). Abnormal activity recognition based on hdp-
hmm models. In Int. Joint Conference in Artificial
Intelligence.
WhattoShow?-AutomaticStreamSelectionamongMultipleSensors
439

Varadarajan, J. and Odobez, J. (2009). Topic models for
scene analysis and abnormality detection. In ICCV-
12th International Workshop on Visual Surveillance.
Zelniker, E., Gong, S., and Xiang, T. (2008). Global ab-
normal behaviour detection using a network of cctv
cameras. In IEEE International Workshop on Visual
Surveillance.
Zhong, H., Shi, J., and Visontai, M. (2004). Detecting un-
usual activity in video. In IEEE Conference on Com-
puter Vision and Pattern Recognition, volume 2, pages
819–826, Washington, DC.
VISAPP2014-InternationalConferenceonComputerVisionTheoryandApplications
440
