
Combining Dense Features with Interest Regions for Efficient Part-based
Image Matching
Priyadarshi Bhattacharya and Marina L. Gavrilova
Dept. of Computer Science, University of Calgary, 2500 University Drive, NW, Calgary, Canada
Keywords:
Recognition, Part-based Match, Dense Sampling, Interest Regions.
Abstract:
One of the most popular approaches for object recognition is bag-of-words which represents an image as a
histogram of the frequency of occurrence of visual words. But it has some disadvantages. Besides requir-
ing computationally expensive geometric verification to compensate for the lack of spatial information in the
representation, it is particularly unsuitable for sub-image retrieval problems because any noise, background
clutter or other objects in vicinity influence the histogram representation. In our previous work, we addressed
this issue by developing a novel part-based image matching framework that utilizes spatial layout of dense fea-
tures within interest regions to vastly improve recognition rates for landmarks. In this paper, we improve upon
the previously published recognition results by more than 12% and achieve significant reductions in compu-
tation time. A region of interest (ROI) selection strategy is proposed along with a new voting mechanism for
ROIs. Also, inverse document frequency weighting is introduced in our image matching framework for both
ROIs and dense features inside the ROIs. We provide experimental results for various vocabulary sizes on the
benchmark Oxford 5K and INRIA Holidays datasets.
1 INTRODUCTION
Object recognition is perhaps one of the most impor-
tant areas of computer vision. It remains a highly
challenging problem because of the large variations
in scale, viewpoint and illumination between two in-
stances of the same object. Occlusion and back-
ground clutter can also significantly hinder reliable
recognition. The bag-of-words (BoW) image repre-
sentation, although highly popular for object recog-
nition, has some disadvantages. It is a global repre-
sentation of an image and thus, is unsuitable for sub-
image retrieval problems where the query object may
occupy only a small part of the corpus image. Any
noise or background clutter invariably influences the
histogram representation and as a result the similar-
ity computation between two images. The other dis-
advantage is the lack of spatial information of visual
words in the representation. This results in many false
matches which need to be rectified by performing ge-
ometric verification. But this process is computation-
ally expensive and can only be applied to a limited
number of images. Many genuinely similar images
may not be make it to the shortlist for geometric veri-
fication.
In (Bhattacharya and Gavrilova, 2013), we have
proposed a novel image matching framework based
on matching interesting regions in an image indi-
vidually instead of matching entire images at a time
based on histogram approach. Our motivation is that
even if two images having the same query object do
not match well in entirety, a high level of similar-
ity between certain regions in the images can still
be expected. Figure 1 illustrates this with a sam-
ple query and corpus image from Oxford 5K dataset
(Philbin et al., 2007). To this end, in (Bhattacharya
and Gavrilova, 2013), we propose a novel method
for combining dense features with interest points.
We compute interest points in scale-space over a re-
stricted range of sigma. We also compute dense fea-
tures at a fixed spatial stride and a number of scales.
For each interest point, we consider only those dense
features that are contained inside and have a radius
that is approximately half the radius of the interest
point. This strategy has the advantage of achieving
invariance to scale while at the same time not requir-
ing dense features to be computed at multiple scales
which will potentially greatly increase the number
of dense features to be considered per interest point.
Any low contrast dense features are discarded. In ad-
dition, the number of dense features inside an interest
point is limited to a maximum of 49 by using a uni-
68
Bhattacharya P. and Gavrilova M..
Combining Dense Features with Interest Regions for Efficient Part-based Image Matching.
DOI: 10.5220/0004684000680075
In Proceedings of the 9th International Conference on Computer Vision Theory and Applications (VISAPP-2014), pages 68-75
ISBN: 978-989-758-004-8
Copyright
c
2014 SCITEPRESS (Science and Technology Publications, Lda.)
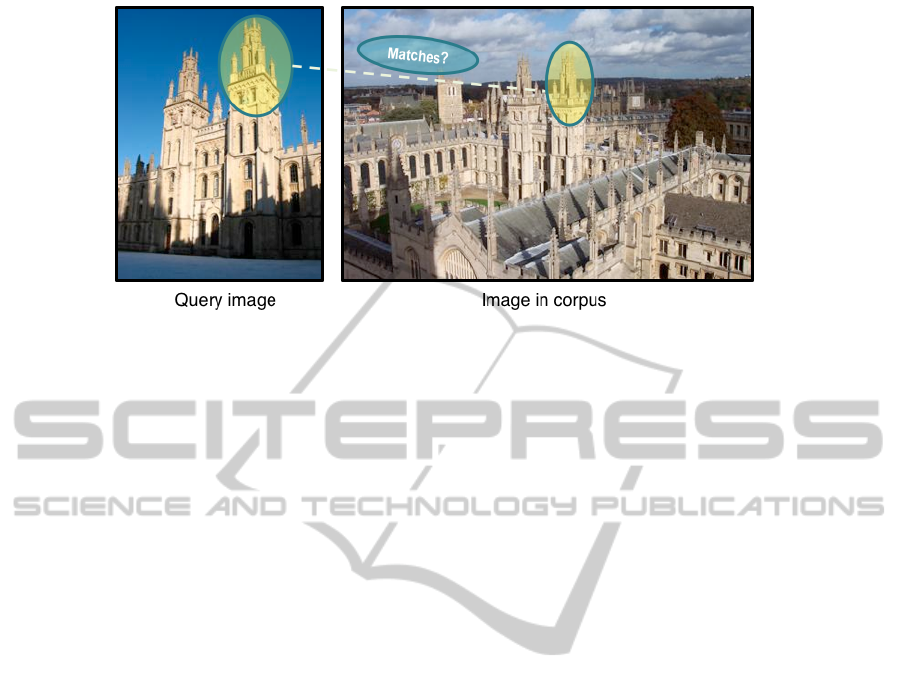
Figure 1: Part-based image matching (landmark images from Oxford 5K (Philbin et al., 2007)).
form sampling strategy.
In this paper, we introduce improvements to the
feature selection stage. We utilize Harris-Laplace
(Mikolajczyk and Schmid, 2004) in place of Lapla-
cian of Gaussian (LoG) to detect interest points as
it localizes better and eliminates repetitive detections
along edges. We also experimented with Hessian-
Laplace (Mikolajczyk and Schmid, 2004) but Harris-
Laplace produced better results. From the interest
points which can have significant overlap and num-
ber in thousands, we select a maximum of 200 re-
gions of interest (ROIs). The selection strategy is de-
tailed in the methodology section in this paper. We
only consider dense features that are contained inside
these ROIs and have a radius equal to half the radius
of the ROI. This was found to exhibit superior recog-
nition performance in (Bhattacharya and Gavrilova,
2013). In contrast to (Bhattacharya and Gavrilova,
2013) which uses two separate vocabularies - one
built from the interest points and another from the
dense features, we utilize a single vocabulary built
from the dense features. This reduces quantization
error and improves retrieval quality. Using a voting
mechanism that requires the dense features to vote
for the ROIs in which they are contained using an
inverted index structure, we are able to quickly de-
termine which images in corpus have ROIs that share
similar dense features to a query image ROI. The spa-
tial arrangement of dense features is considered in es-
timating a match score. A cumulative score is com-
puted by summing up the match scores for all ROIs in
query image and the corpus images are sorted based
on descending order of this score. RootSIFT intro-
duced in (Arandjelovi
´
c and Zisserman, 2012) and in-
verse document frequency weighting are used to fur-
ther improve recognition results. With these improve-
ments, the highest mAP reported on 200K vocabulary
size in (Bhattacharya and Gavrilova, 2013) jumps by
12.8% while using only up to 200 ROIs per image
(80% less). It also reduces query time per image by
more than 50%.
2 RELATED WORK
Several improvements over bag-of-words have been
proposed over the years. Increasing the vocabulary
size helps compensate for some of the quantization
error and has been used to improve recognition accu-
racy (Mikulk et al., 2010)(Philbin et al., 2007). But
building a vocabulary approaching a million or more
visual words is prohibitively time consuming and the
storage requirements also increase. Soft quantiza-
tion (Philbin et al., 2008) has been suggested to im-
prove recognition accuracy but can significantly in-
crease query time and storage requirements as each
word is mapped to k nearest visual words. These tech-
niques do not effectively address the two weaknesses
of bag of words - lack of spatial information and sus-
ceptibility to noise and background clutter.
Spatial information is considered in (Cao et al.,
2010) by considering several ordered bag-of-words
per image. But it requires tuning of parameters and
an offline boosting-based method to learn the most
effective features and is most effective for very large
vocabularies only.
(Lin and Brandt, 2010) uses a family of his-
tograms that depend functionally on a bounding rect-
angle. The method uses more spatial information than
bag-of-words but is considerably more complicated
than bag-of-words and the grid size selection can be
problematic.
Instead of matching each feature to nearest vi-
sual word, (Jegou et al., 2010) computes a signa-
ture for each feature and maps to a visual word only
if the hamming distance between the signatures is
higher than a threshold. This achieves higher recog-
CombiningDenseFeatureswithInterestRegionsforEfficientPart-basedImageMatching
69

nition rates than bag-of-words for reasonable vocabu-
lary sizes but in order to obtain the binary signature,
an offline training process is required.
Several variations of query expansion have been
proposed in literature (Arandjelovi
´
c and Zisserman,
2012)(Chum et al., 2007) but as observed in (Jegou
et al., 2010), this significantly increases query time
by several orders of magnitude and only works well
when there are several images of the same object in
corpus.
(Wu et al., 2009) proposed grouping of SIFT
features inside Maximally Stable Extremal Regions
(MSER) and applied to logo and web image retrieval.
This does not work well for real-world photographs
with large changes in viewpoint and illumination and
is mostly applicable for 2D images.
Our method is able to consistently produce sig-
nificantly better recognition rates than bag-of-words
for a wide range of vocabulary sizes and incurs no
offline training or learning overheads. Experiments
reveal that the proposed approach can be effective for
recognition in real-world photographs involving large
changes in viewpoint and occlusion and sub-image re-
trieval problems. Also, the retrieval is several orders
of magnitude faster than performing geometric verifi-
cation or query expansion.
3 METHODOLOGY
Figure 2 provides an overview of proposed method.
The offline processing module (subfigure 2(a)) pre-
pares the inverted index and files that store spatial in-
formation from the images in corpus. It also com-
putes the inverse document frequency weights for vi-
sual words inside the ROIs. The online processing
module (subfigure 2(b)) inputs the query image and
computes the regions of interest (ROIs) and dense fea-
tures. It assigns dense features to visual words us-
ing the codebook computed from the dense features
in the corpus images. A voting mechanism is used
to determine ROIs in corpus that share common vi-
sual words. An array whose size equals the number
of ROIs in corpus is first initialized to zero. Using an
inverted index structure, each visual word in a ROI
in the query image votes for ROIs in corpus in which
it occurs. Figure 3 illustrates the voting mechanism.
After the voting, the counts in the array represent the
number of visual words each corpus ROI has in com-
mon with the query ROI. For corpus ROIs that have
count < 2, the match score is set to zero. For the rest,
a match score is computed based on the number of
visual words in common and agreement in their spa-
tial layout. The match score is then added back to a
second array that stores the cumulative match score
for all the corpus images. The corpus images are then
ordered based on descending order of the cumulative
match score. For all our experiments, we use Root-
SIFT (Arandjelovi
´
c and Zisserman, 2012) instead of
SIFT. With our matching framework, this is observed
to increase mAP by about 1% − 2% from using L2
distance for SIFT comparison.
3.1 ROI Computation
In this section, we provide details of the feature ex-
traction. We compute Harris-Laplace interest points
using the LIP-VIREO toolkit of (Zhao, 2010). In
contrast to our previous work (Bhattacharya and
Gavrilova, 2013) which detects interest points using
LoG and also computes the descriptors, we simply
compute the interest points using Harris-Laplace. We
discard overly large and overly small interest points
as these are likely to result in false matches. Specifi-
cally, for all our experiments, we discard any interest
points with radius < 15 or > 51 pixels. The number
of interest points still number in the thousands. We
sort the interest points in descending order of radius.
Using a kd-tree, we efficiently determine the nearest
interest points to any given interest point. We dis-
card any nearby interest points for which the distance
between the interest point centres is < 4D and differ-
ence in radius is < 4R. The motivation is to discard
overlapping interest points that are similar in scale
and hence likely to represent similar image structure.
If the number of ROIs is > 200, we sort the ROIs
based on saliency in descending order and select up
to the top 200 ROIs. Subfigure 4(a) displays the inter-
est points detected using Harris-Laplace while subfig-
ure 4(b) displays the ROIs extracted using the simple
technique just outlined. We set 4D and 4R to 20 pix-
els for all our experiments. It is important to note that
if the value of 4D is set too high, then the localiza-
tion accuracy of the ROIs will not be good, resulting
in degradation in recognition performance.
We next compute dense features at a spatial stride
of 5 pixels and 6 scales {9,12,15,18,21,24} us-
ing the vl phow command of (Vedaldi and Fulk-
erson, 2012). This has been used for category
recognition in (Chatfield et al., 2011). It is fast
to compute and takes well below a second per im-
age. For ROIs with radii in the range [15, 21], we
only consider dense features that are contained in-
side and have a radius of 9 pixels (roughly half
the ROI radius). Similarly, for ROIs with radii in
the range {[22,27],[28,33],[34,39],[40, 45],[46, 51]},
we consider dense features that have a radius of
{12,15,18,21,24} pixels respectively. Since the ra-
VISAPP2014-InternationalConferenceonComputerVisionTheoryandApplications
70
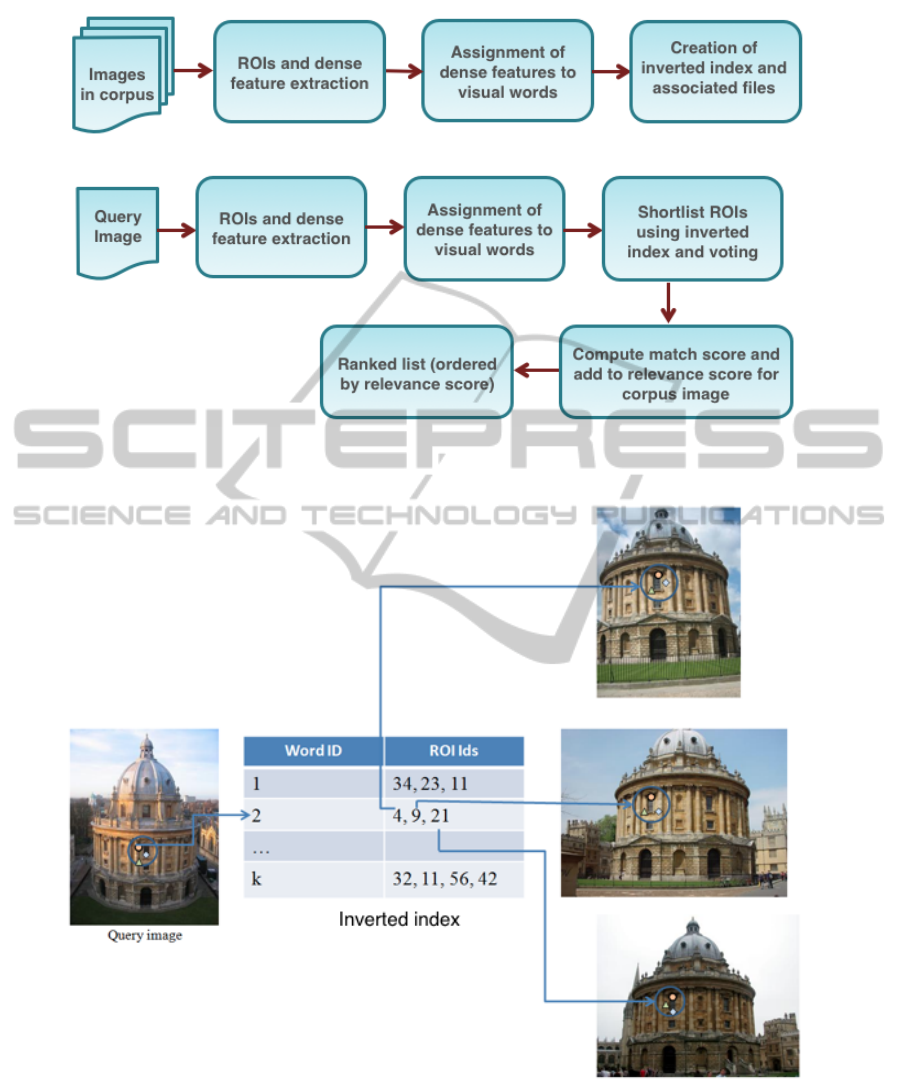
(a) Offline processing
(b) Online processing
Figure 2: Flowchart for proposed method.
Figure 3: Visual words representing dense features inside an ROI voting for ROIs in corpus (landmark images from Oxford
5K (Philbin et al., 2007)). Blue circles represent the ROIs and the shapes inside represent dense features mapping to various
visual words.
dius of dense features considered inside a ROI is
based on the radius of the ROI, which is derived
in scale-space, the dense features are scale-invariant
without requiring to compute them at multiple fixed
scales as prevalent in category recognition. This lim-
its the number of dense features to be considered per
ROI. We have observed through experiments that the
recognition quality is not impacted much if the num-
CombiningDenseFeatureswithInterestRegionsforEfficientPart-basedImageMatching
71
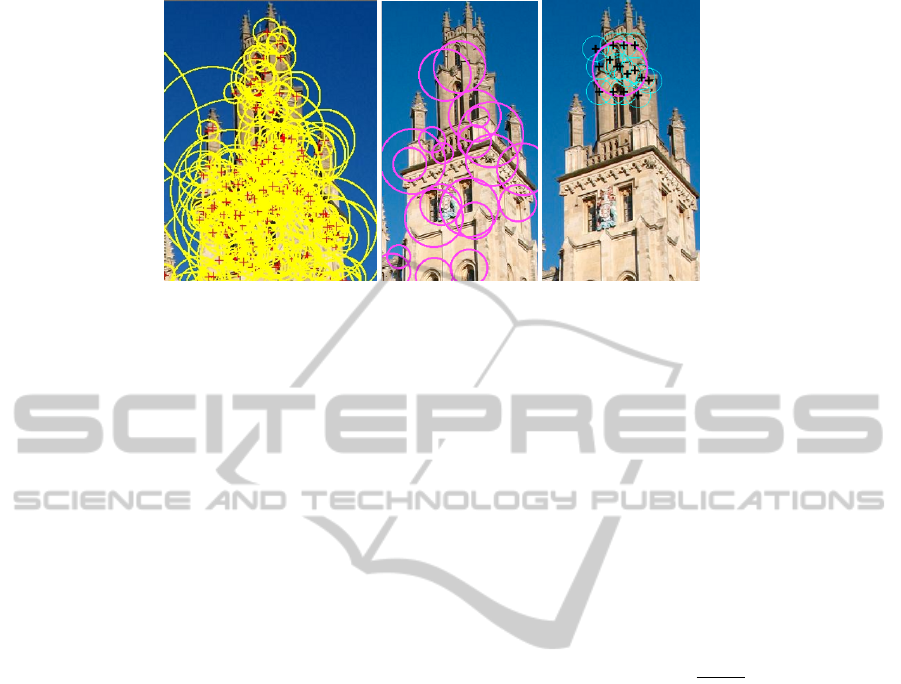
(a) Harris-Laplace interest points (b) Computed ROIs (c) Dense features inside
one of the ROIs
Figure 4: ROIs and dense features (landmark image from Oxford 5K (Philbin et al., 2007)).
ber of scales is ≥ 5.
3.2 Inverted Index and other Files
Codebook is built by clustering the dense features in-
side the corpus ROIs. We use the approximate K-
means of (Philbin et al., 2007) for clustering and con-
sider up to 16 million dense descriptors sampled uni-
formly. The dense features are then mapped to the
codebook. All files generated are in binary format for
fast random access. The inverted index file contains
an entry for each word in the codebook: the number
of ROIs in corpus in which it occurs and then the ROI
ids in sequence (each ROI is assigned a unique id).
Since a record in the inverted index can be of vari-
able length, we maintain an index file on the inverted
index which simply stores the offset of each word in
the inverted index file. There is a separate file created
for storing information about the ROIs. It contains
two entries per ROI - the offset in a binary file where
the visual words inside the ROI are stored and another
offset to a second binary file which stores the x and y
coordinates of the words. A binary file is also created
which stores the inverse document frequency weights
of each word. It is defined as log(N/n
i
) where N is
the number of images in corpus and n
i
is the num-
ber of images in which the word occurs. This penal-
izes words that occur in many images and are hence
less informative. We additionally create a stop list of
words. We count the number of corpus ROIs in which
each word occurs and compute the maximum. Any
word that occurs more than 50% of the maximum is
assigned to the stop list.
3.3 Querying
Given a query image, the ROIs and dense features
are extracted in a similar manner as previously de-
scribed for corpus images. The dense features are
then mapped to the codebook to obtain the represen-
tative visual words. We iterate over all the ROIs in
the image and for each ROI, we use the inverted in-
dex file to determine which are the corpus ROIs that
share visual words. If the number of common visual
words is < 2, we set ROI match score to zero. If the
number is ≥ 2, we compute the match score S
i
for i
th
ROI in query image based on formula introduced by
us in (Bhattacharya and Gavrilova, 2013) with some
modifications:
S
i
= T × log
CP
max
CP
(1)
where T is the sum of inverse document frequency
weights of the common visual words between the two
ROIs being matched, CP is the cumulative penalty for
the sequence, CP
max
is the maximum CP. The compu-
tation of CP and CP
max
can be found in (Bhattacharya
and Gavrilova, 2013). We use the second technique
- match score using relative order which does not re-
quire a descriptor computation for the ROIs. The cu-
mulative score (CS) for a corpus image is then com-
puted over all query ROIs as:
CS =
m
∑
i=1
S
i
∗ P
i
(2)
where P
i
= log(N/n
i
)
Here N is the number of images in corpus and n
i
is the
number of images to which the i
th
ROI contributes a
match score > 0 (this information is obtained as part
of the earlier match score computation) and m is the
number of ROIs in query image. It penalizes ROIs
that yield matches with many images in corpus.
VISAPP2014-InternationalConferenceonComputerVisionTheoryandApplications
72

Table 1: Performance (mAP) for different vocabulary sizes on Oxford 5K dataset.
Vocab.
size
BoW SBOF (Cao
et al., 2010)
HE + WGC
+ wts. + MA
(Jegou et al.,
2010)
Proposed
10K 0.358 − − 0.546
20K 0.385 − 0.605 0.568
50K 0.473 0.523 − 0.592
100K 0.534 0.571 − 0.620
200K 0.561 − 0.615 0.641
4 EXPERIMENTS
We experimented with two popular benchmark
datasets for image retrieval - the Oxford 5K (Philbin
et al., 2007) and INRIA Holidays (Jegou et al., 2008).
The Oxford 5K dataset has a total of 5062 images col-
lected from Flickr of 11 different landmarks in Oxford
area and a large portion of distractor images. Mean
Average Precision (mAP) (as defined in (Philbin et al.,
2007)) is used for evaluation. There are 55 queries in
total (5 for each landmark) with bounding boxes of
query regions given. The INRIA Holidays dataset has
1491 images in total divided into 500 image groups of
various natural and man-made scenes. The first image
of each group is the query and correct retrieval results
are the other images of that group. The evaluation is
again based on Mean Average Precision and we use
the evaluation tools available online from the authors
of (Jegou et al., 2008). Since our method uses new
kind of features instead of standard SIFT, we compute
all features ourselves. The vocabularies are computed
from the dense features in each dataset.
4.1 Results on Oxford 5K Dataset
Table 1 presents the retrieval results for Oxford 5K
dataset for various vocabulary sizes. The improve-
ment over bag-of-words (BoW) is quite significant.
For smaller vocabularies, the improvement percent-
age is more pronounced. Our method exhibits im-
provement in recognition accuracy with increase in
vocabulary size similar to bag-of-words and it is ex-
pected that with larger vocabulary sizes, the retrieval
accuracy will improve further. Although (Jegou et al.,
2010) achieves a higher mAP for 20K vocabulary
compared to our method, we obtain superior results
for 200K vocabulary size. The best accuracy using
Local BoF mentioned in (Lin and Brandt, 2010) for
Oxford 5K is 0.647 but the authors do not specify the
vocabulary size they use.
4.2 Results on INRIA Holidays Dataset
For 20K vocabulary, the mAP achieved by our method
is 0.638 and for 200K vocabulary, the mAP is 0.685.
This is significantly higher than the bag-of-words
mAP of 0.469 and 0.572 (from (Jegou et al., 2010))
for 20K and 200K sized vocabularies. We expect the
mAP of our method to increase further with larger vo-
cabulary sizes. Our mAP is lower than the best re-
ported mAP of 0.75 in (Jegou et al., 2008) but the
method in (Jegou et al., 2008) requires offline learning
and uses priori knowledge of image orientation. (Per-
doch et al., 2009) achieved a mAP of 0.715 on this
dataset using a one million vocabulary. This method
requires learning of geometry representations.
4.3 Analysis of Algorithm Parameters
In order to analyze the impact of parameter selection,
we created a subset of Oxford 5K (Philbin et al.,
2007) which consists of only the Good images for
each of the landmarks. We remove Ok images from
consideration in the evaluation similar to Junk im-
ages. The query images are the same as in the original
dataset. We first analyze the impact of maximum
number of ROIs on the mAP. Figure 5 plots the mAP
for 4 different choices of the maximum number of
ROIs. With more ROIs, there is greater coverage of
the image and we observe a steady increase in mAP
as the maximum number of ROIs per image increases
from 100 to 200. From 200 to 250, the increase is less
dramatic and for higher values (not shown in figure),
it is even less. Figure 6 plots the total query time for
all 55 queries. As can be expected, the query time
increases as more ROIs are considered per image.
There is clearly a trade-off here between query time
and mAP. We set the maximum number of ROIs to
200 for all our experiments as it seems to be a good fit
both with respect to retrieval quality and query time.
If query time is more important however, setting ROIs
CombiningDenseFeatureswithInterestRegionsforEfficientPart-basedImageMatching
73
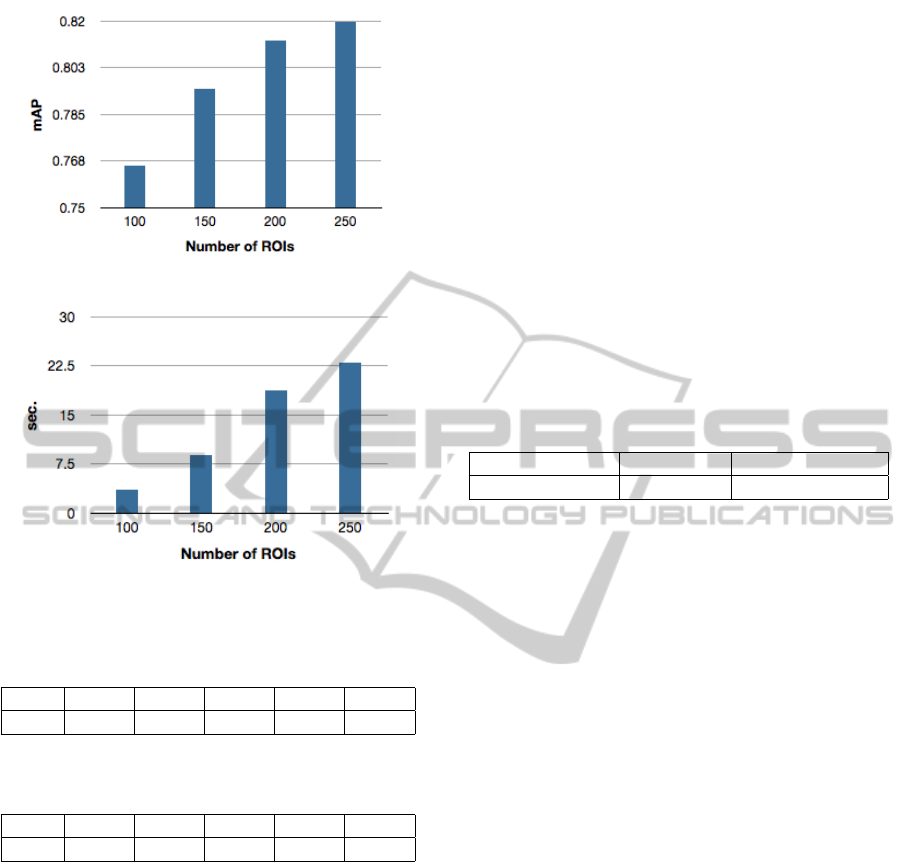
Figure 5: mAP versus Number of ROIs.
Figure 6: Total query time (for 55 queries) versus Number
of ROIs.
Table 2: Performance (mAP) for different values of 4D
(4R = 20).
4D 10 30 50 70 100
mAP 0.826 0.832 0.821 0.814 0.800
Table 3: Performance (mAP) for different values of 4R
(4D = 20).
4R 10 30 50 70 100
mAP 0.828 0.840 0.844 0.844 0.844
to 150 will be beneficial with a slight reduction
in retrieval quality.
With the maximum number of ROIs set to 200, we
analyze the impact of 4D and 4R on the mAP. From
Table 2, it can be observed that a value of 4D be-
tween 10 and 50 pixels yields similar results. With a
higher value of 4D, less ROIs are detected per image
which can reduce query time. As 4D increases more,
the retrieval quality deteriorates with increasing inac-
curacy in ROI localization. As evident from Table 3,
4R has less of an impact on the retrieval quality. It
should be set to a reasonably high value to make sure
we do not select ROIs that represent similar visual el-
ements. For all our experiments on Oxford 5K and
INRIA Holidays, we set both 4D and 4R to 20 pix-
els. The mAP for (4D = 20, 4R = 20) is 0.836 for
this reduced dataset.
4.4 Query Time and Storage Costs
We performed our experiments on a Macbook Pro
laptop with 2.4 GHz Intel Core i5 processor and 16
GB RAM. The query time averaged over 55 queries
for Oxford 5K and 500 queries for INRIA Holidays
is shown in Table 4 for a 200K vocabulary. With
increase in vocabulary size, the number of ROIs in
which a visual word occurs will be less. Since match
score is computed for only those ROIs which have at
least 2 visual words in common, the number of ROIs
for which match score needs to be computed reduces
significantly with larger vocabularies. This result in
faster queries. The query times are significantly lower
than performing geometric verification or query ex-
pansion to improve bag-of-words retrieval results.
Table 4: Average query time for 200K vocabulary.
Dataset Oxford 5K INRIA Holidays
Avg. time (sec.) 0.62 0.18
The storage costs are dependent on the number of
ROIs detected per image and the number of dense
features inside each ROI. Table 5 shows the num-
ber of ROIs and dense features computed for the two
datasets. With the current settings, the memory foot-
print per image is approximately 80 KB. This implies
a corpus size of about 100K images can be handled
in 8 GB memory for querying. For more images, we
prefer a distributed computing/cloud based approach
where the image corpus is distributed across N num-
ber of machines. Each machine retrieves up to m sim-
ilar images and then the results are merged in time
linear on the size of the returned results.
Since our algorithm returns a match score, images
can be easily sorted across machines based on that
score. This is cheaper than renting a high configura-
tion machine on the cloud with very large RAM. Also,
it will be faster as the machines will work in parallel.
5 CONCLUSIONS
In this paper, we developed a part-based image match-
ing framework that combines dense features with in-
terest regions in a novel way to dramatically im-
prove image retrieval quality over bag-of-words. The
method proposed by us is simple and easy to im-
plement and does not require any offline learning or
training overheads. We make new contributions in the
feature extraction and image similarity computation
stages of the recognition pipeline. Future research
will involve looking into approaches for further re-
VISAPP2014-InternationalConferenceonComputerVisionTheoryandApplications
74

Table 5: Number of ROIs and dense features.
Dataset ROIs (total) ROIs (avg. per image) Dense (total) Dense (avg. per ROI)
Oxford 5K 932975 184 33788806 36
INRIA Holidays 259726 174 9534068 36
ducing the number of ROIs to be considered per im-
age by possibly doing foreground-background sepa-
ration or by eliminating ROIs completely from con-
sideration that lead to too many false matches. Since
dense features are not rotation invariant, possible ro-
tation of the image area before computation can be
investigated to further improve recognition quality.
ACKNOWLEDGEMENTS
We are thankful to Natural Sciences and Engineering
Research Council of Canada and Alberta Innovates
Technology Futures for continued support of this re-
search.
REFERENCES
Arandjelovi
´
c, R. and Zisserman, A. (2012). Three things
everyone should know to improve object retrieval. In
IEEE Conference on Computer Vision and Pattern
Recognition.
Bhattacharya, P. and Gavrilova, M. L. (2013). Spatial con-
sistency of dense features within interest regions for
efficient landmark recognition. The Visual Computer,
29(6-8):491–499.
Cao, Y., Wang, C., Li, Z., Zhang, L., and Zhang, L. (2010).
Spatial-bag-of-features. In CVPR, pages 3352–3359.
Chatfield, K., Lempitsky, V., Vedaldi, A., and Zisserman,
A. (2011). The devil is in the details: an evaluation of
recent feature encoding methods. In British Machine
Vision Conference.
Chum, O., Philbin, J., Sivic, J., Isard, M., and Zisserman,
A. (2007). Total Recall: Automatic Query Expansion
with a Generative Feature Model for Object Retrieval.
In ICCV, pages 1–8.
Jegou, H., Douze, M., and Schmid, C. (2008). Hamming
embedding and weak geometric consistency for large
scale image search. In ECCV, pages 304–317.
Jegou, H., Douze, M., and Schmid, C. (2010). Improving
bag-of-features for large scale image search. Interna-
tional Journal of Computer Vision, 87(3):316–336.
Lin, Z. and Brandt, J. (2010). A local bag-of-features model
for large-scale object retrieval. In European confer-
ence on Computer vision.
Mikolajczyk, K. and Schmid, C. (2004). Scale & affine in-
variant interest point detectors. International Journal
of Computer Vision, 60(1):63–86.
Mikulk, A., Perdoch, M., Chum, O., and Matas, J. (2010).
Learning a fine vocabulary. In European Conference
on Computer Vision, volume 6313 of Lecture Notes in
Computer Science, pages 1–14. Springer.
Perdoch, M., Chum, O., and Matas, J. (2009). Efficient
representation of local geometry for large scale object
retrieval. In CVPR, pages 9–16.
Philbin, J., Chum, O., Isard, M., Sivic, J., and Zisserman, A.
(2007). Object retrieval with large vocabularies and
fast spatial matching. In CVPR.
Philbin, J., Chum, O., Isard, M., Sivic, J., and Zisserman,
A. (2008). Lost in quantization: Improving particu-
lar object retrieval in large scale image databases. In
CVPR.
Vedaldi, A. and Fulkerson, B. (2012). VLFeat: An open and
portable library of computer vision algorithms. Avail-
able at http://www.vlfeat.org/.
Wu, Z., Ke, Q., Isard, M., and Sun, J. (2009). Bundling
features for large scale partial-duplicate web image
search. In CVPR, pages 25–32.
Zhao, W. (2010). LIP-VIREO: Local interest point extrac-
tion toolkit. Available at http://www.cs.cityu.edu.hk/
∼wzhao2/.
CombiningDenseFeatureswithInterestRegionsforEfficientPart-basedImageMatching
75
