
Storyboard Augmentation of Process Model Grammars
for Stakeholder Communication
Nardella Kathleen
1
, Brown Ross
1
and Simone Kriglstein
2,3
1
Information Systems School, Science and Engineering Faculty, QUT, Brisbane, Australia
2
SBA Research, Vienna, Austria
3
University of Vienna, Faculty of Computer Science, Vienna, Austria
Keywords:
3D Virtual Worlds, Process Visualization, Storyboards.
Abstract:
Process models are often used to visualize and communicate workflows to involved stakeholders. Unfor-
tunately, process modeling notations can be complex and need specific knowledge to be understood. Sto-
ryboards, as a visual language to illustrate workflows as sequences of images, provide natural visualization
features that allow for better communication, to provide insight to people from non-process modeling expert
domains. This paper proposes a visualization approach using a 3D virtual world environment to visualize
storyboards for business process models. A prototype was built to present its applicability via generating
output with examples of five major process model patterns and two non-trivial use cases. Illustrative results
for the approach show the promise of using a 3D virtual world to visualize complex process models in an
unambiguous and intuitive manner.
1 INTRODUCTION
Business Process Management (BPM) encompasses
the analysis and improvement of business practices
and is a valuable and much-applied area in existing
companies. Communication, in many ways, is criti-
cal to BPM success (e.g., to avoid misunderstandings
between the different stakeholders) (Bandara et al.,
2007). For this reason, the communication of busi-
ness process models is a key area of BPM, and an im-
portant topic of research (Recker et al., 2009a). Pro-
cess model communication has impact on a number of
key areas in business process management, in particu-
lar, model validation processes requires high levels of
stakeholder engagement to ensure a quality modeling
outcome (Bandara et al., 2005).
A number of visualization methods for business
process models have been investigated, in terms of
their abilities to facilitate communication (Moody,
2009). The research work shows that there are prob-
lems with the effectiveness of existing visualization
methods for business processes (Bandara et al., 2007).
Most process models are represented using abstract
graphical modeling notations that consist of basic 2D
geometric shapes with some formal syntax to give
them meaning (Recker et al., 2009b). To stakehold-
ers with little to no formal modeling experience, these
diagrams can be difficult to understand. This is detri-
mental to the modeling effort, when business analysts
need to work and communicate with enterprise stake-
holders for maximum success (Trkman, 2010).
Storyboarding is a powerful descriptive method
which can be used to present events and actions in or-
der to support communication between stakeholders,
independently from their expertise with the modeling
language (cf. (Weitlaner et al., 2013)). The sequences
of images providing by storyboards in combination
with the background information and external knowl-
edge of stakeholders help to identify problems and to
support discussions on improvements.
In this paper we describe our ongoing research
that aims to provide an approach to visually show-
ing business process models, so that the problem of
stakeholder communication can be alleviated by pre-
senting intuitive 3D visualizations of operational as-
pects of a process model. The storyboards are shot-
by-shot visualizations. The shots are automatically
generated by using an extension of the 3D virtual
world for business processes developed by (Brown
and Rasmussen, 2010). Existing research has shown
that domain experts and business representatives ben-
efit from a hands-on, operational view of the business
process being designed (Clancey et al., 1998). Virtual
worlds can provide such an operational view by fill-
114
Kathleen N., Ross B. and Kriglstein S..
Storyboard Augmentation of Process Model Grammars for Stakeholder Communication.
DOI: 10.5220/0004668101140121
In Proceedings of the 5th International Conference on Information Visualization Theory and Applications (IVAPP-2014), pages 114-121
ISBN: 978-989-758-005-5
Copyright
c
2014 SCITEPRESS (Science and Technology Publications, Lda.)

ing a 3D simulated world with objects, resources and
animations that map to the real domain being mod-
eled. An intended outcome of our research is an in-
tuitive tool for business analysts to easily create rich
3D visualizations of process model diagrams, improv-
ing the uptake of such approaches and the related 3D
technology for the BPM domain.
2 RELATED WORK
Storyboarding is a popular method from movie pro-
duction (Hart, 2007). Recently, several methods
have been developed to support video viewing/editing
which range from different representation techniques
(see, e.g., (Dony et al., 2005; Goldman et al., 2006))
to methods for realizing films (see, e.g., (Jhala et al.,
2008; Jung et al., 2010)). In other domains, such as
game design, storyboards are also commonly used.
For example, (Pizzi et al., 2010) presented a solu-
tion to generate 2D-storyboards in order to support
level design for games. Furthermore, storyboarding,
in combination with use cases and personas, is a well-
known Human Computer Interaction (HCI) method
for the specification of requirements (cf. (Truong
et al., 2006)). The results of the study by (Weitlaner
et al., 2013) showed that the usage of storyboards also
has potential for the description of process models.
In addition to the linear representation (e.g., shots
along a timeline), several systems provide non-linear
representations (e.g., to show different story paths)
and visualize the scene flow as a graph to make the re-
lationships between the individual scenes visible (see,
e.g., (Gebhard et al., 2003; Dade-Robertson, 2007;
Sauer et al., 2006; Yeo and Yeung, 1997)). For our
approach, we apply the workflow language YAWL
1
(Yet Another Workflow Language) in combination
with workflow patterns (Van Der Aalst et al., 2003)
to define the control flow of the process model as a
graph to form the backbone of our storyboard repre-
sentation.
3 BACKGROUND
Business analysts use formal graphical modeling no-
tations to express process models. Communication is
therefore difficult, especially when stakeholders are
not familiar with these notations. Ironically, commu-
nication is an overarching element of BPM success
1
http://www.yawlfoundation.org/ accessed
01/06/2013
because business analysts frequently have to collabo-
rate with stakeholders to validate a model, to ensure
that it correctly represents the real process (Weske,
2007). Deficiencies have been identified in the rep-
resentational properties of modeling grammars (Ban-
dara et al., 2007), which are closely tied to a lack of
user buy-in (Rosemann, 2006). For this reason, fo-
cus in the BPM research community has now shifted
towards developing better ways of representing busi-
ness process models to improve understanding and
communication (Rosemann et al., 2009). The widely
cited Media Richness Theory (Daft and Lengel, 1986)
provides the theoretical underpinning for our story-
board approach. The theory states that equivocal tasks
will benefit from richer media, e.g. media provid-
ing more communication channels and more rapid
feedback. Furthermore, Media Synchronicity theory
(Dennis and Valacich, 1999) emphasizes the task-
media fit. It argues that media differ in more than one
dimension, and different media support fundamental
communication processes in different ways, best sup-
porting tasks for which their specific mix of commu-
nication processes is most useful. Recent work has
also supported, in theory, the efficacy of iconic repre-
sentations when added to personalised process model
graphs (Koschmider and Dijkman, 2012). From this
basis, we propose that a media rich process model,
incorporating graph representations and augmented
with contextualised operational imagery, will assist in
communication processes by lessening the cognitive
load for understanding. In essence, providing a space
for the business analyst and stakeholders to communi-
cate, and thus correctly validate the presented process
model.
Because many people understand work in a hands-
on manner, rather than in conceptual space, a repre-
sentation of the real world provides a relatable rep-
resentation to business stakeholders (Clancey et al.,
1998). Virtual spaces can provide previously un-
seen insights, because the user experiences a visu-
ally close representation of the process, as in most
cases the domain can be completely mapped to a
virtual space. The order in which tasks are chosen
can be aided by their location and distance, so that
they can be completed in the most efficient manner
(Leoni et al., 2008). In addition, by presenting the
model physically in a 3D simulation, collisions, bot-
tlenecks and other spatially-related problems can be
determined which aren’t immediately obvious in a di-
agram (Kindler and Ples, 2004). An average business
analyst would be largely unfamiliar with manipulat-
ing objects in 3D modeling tools (Sch
¨
onhage et al.,
2000) and would simply be unable to create a virtual
world representation with the current tools on their
StoryboardAugmentationofProcessModelGrammarsforStakeholderCommunication
115
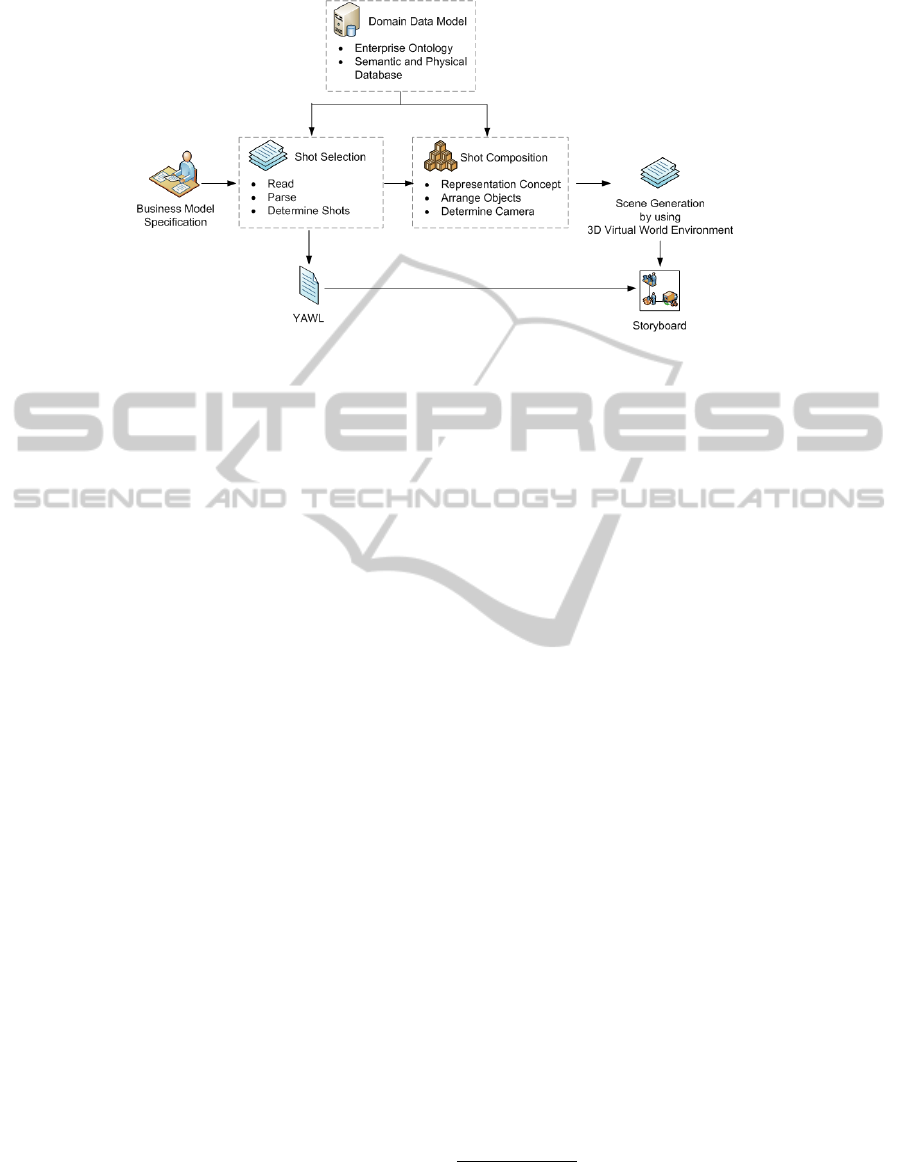
Figure 1: High level architecture for our approach.
own. As a solution, the 3D modeling process may
be automated through techniques, such as procedural
and declarative modeling (Tutenel et al., 2008). The
core of declarative modeling approaches is the con-
straint solver. This is because low-level constraints
restrict the solution space and can be programmati-
cally solved for one or more solutions (Le Roux et al.,
2004). In declarative modeling, the designer needs
to first describe the scene in some way. Description
involves defining the properties, relationships and ap-
pearance of the scene (Gaildrat, 2007) often using nat-
ural language sentences (Coyne and Sproat, 2001), as
we have done. Explicit and implicit constraints and
semantics are frequently used in the 3D modeling pro-
cess. These are described as an ontology (Tutenel
et al., 2008), and are stored in a semantic database
(Bidarra et al., 2010). Generated scenes do not usu-
ally incorporate narrative, or flow structures, which
exist in process modeling. Our contribution is to ap-
ply these declarative modeling approaches to create a
meaningful scene in the context of business process
modeling. To the best of our knowledge, automati-
cally creating 3D virtual environment representations
from business processes has not been attempted.
4 APPROACH
This section gives a high level overview of the ar-
chitecture and main components of our approach (cf.
Figure 1) which was implemented as proof of con-
cept in Java. Conceptually, in our approach, the op-
erational view of the business is being melded with
the process model in a virtual world. The virtual
world scene is created using inputs such as content,
positions and semantic information about the virtual
world. The actual setup and image capture of the vir-
tual world can either be done during the application’s
processing, or completed afterwards. We have imple-
mented the approach as a post-processing system, be-
cause it allows for less coupling between the system
and virtual world application. The final specification
can be loaded into a virtual world at any time to pro-
duce the visualization images. While the storyboards
are automatically generated, the images are hand in-
tegrated into a YAWL diagram to illustrate the final
result intended.
4.1 Shot Selection
A business process model encompasses many tasks,
actions, events and state-changes. These are actions
that must be performed during model execution, so it
is desirable that these tasks be shown in the visualiza-
tion. Task descriptions are commonly written in a nat-
ural, yet structured language (Mendling et al., 2010).
In order for them to be used, they need to be parsed
and formed into a consistent, meaningful language
structure that encompasses the range of perspectives.
Specifically for visualization, task labels give the pro-
gram information about what needs to be shown in
that image. By interpreting the plain text label using
language processing, the program can determine the
objects, actors and actions of that task. In our case, we
implemented a method for reading a business process
model specified in the YAWL modeling language and
then converting it to a generic task-based workflow
data structure. For the interpretation of the task de-
scriptions, natural language processing is used, aided
by the Stanford Parser
2
and WordNet
3
.
2
http://nlp.stanford.edu/software/
lex-parser.shtml accessed 01/06/2013
3
http://wordnet.princeton.edu/ accessed
01/06/2013
IVAPP2014-InternationalConferenceonInformationVisualizationTheoryandApplications
116

The parsing process provides the basic founda-
tion for extra information gathering about the busi-
ness function the task represents. In order to provide a
full specification to load into the virtual world, infor-
mation about each task, including actions, roles and
locations, are added to the task specification by query-
ing the enterprise knowledge base to provide a seman-
tic annotation (Born et al., 2007) from the modeling
grammar (in our case YAWL ). The YAWL model
thus provides the basic logic and temporal ordering
structure for the storyboard that is generated. Based
on this information, the process model structure is
split into a number of shots. The tasks that contained
a control flow element are split into separate shots,
the task itself and the control flow pattern. The final
output of the Shot Selection module is a collection of
shots specified in a data definition language.
4.2 Shot Composition
The Shot Composition module involves determining
what objects, resources and actions need to be shown
in the scene and how they can be shown to their best
effect. The output of the Shot Composition module
is the necessary scene specification that can be visu-
alized and captured in a virtual world. The first step
is to define the core representation concepts to be ap-
plied to a particular process model. At this stage that
task is to decide how the specified shots in the Shot
Selection module are shown, based on the type of ac-
tion in the shot. For our use case, which is presented
in detail in Section 5, we have a movement group that
encompasses actions like ‘move’, ‘transfer’, ‘unload’,
and ‘load’ as well as an observe group which encom-
passes actions like ‘check’ and ‘determine’ (see e.g.,
Figure 2). Furthermore, there exists a control flow
group. The control flow events have no inherent phys-
ical representation and are largely logical. For this
reason, a method for translating workflow concepts
into a physical, operational form is proposed here.
The fundamental approach to generating the visu-
alizations is based on a visualization metaphor, where
the workflow system is shown as a supervisory agent
in the virtual world. The other avatars in the scene
are simulated human worker agent threads within the
system. When branching occurs in the model, the su-
pervisor decides which tasks need to be completed
and assigns avatars to complete the work. Because
this metaphor is a physical manifestation of the most
basic workflow concepts, it can be used to visualize
different types of control flow in domain specific ap-
plications. In our case, the control flow group consid-
ers the five major workflow patterns (Van Der Aalst
et al., 2003): Exclusive Choice, Simple Merge, Paral-
lel Split, Synchronization, and Sequence.
Moreover, it is necessary that the viewer will be
placed in the scene so that important actions are not
blocked from view. To make the process automatic,
arranging objects, actors and the camera in the scene
needs to be done programmatically. A camera model
was implemented to support this shot selection pro-
cess. For the control flow actions, a camera specifi-
cation is determined to encompass all the actors and
icons. This was important because the number of ac-
tors and icons could change, based on the number of
subsequent or previous branches. For the actions from
the movement group and observation group, a camera
was chosen from a predefined set of camera positions,
and then focused on the average position of all the rel-
evant objects in the scene.
The integration with the virtual world was not im-
plemented directly into the program. This allows for
any virtual world application to theoretically be used
with the tool. In addition, the chosen virtual world
application has several limitations in the way of read-
ing custom scene specifications. The virtual world
that was used to create the visualization was Open-
Sim
4
. The scene specification for each of the shots is
passed to the virtual world through a structured plain-
text file. This file included the camera position and
focus, each geometry’s position, rotation, texture, and
state, and each avatars position, rotation, and optional
parameters. Using a custom region module in Open-
Sim, the text file is read and its information is made
available in-world. To create each scene, the user logs
into the virtual world and activates scripts housed in-
side in-world geometry.
4.3 Domain Data Model
In order to create an accurate visual representation
of a business process, information about the context
is required. Without knowledge of what actions are
possible, who completes certain tasks and which re-
sources are used, a visualization will be very limited.
The modules Shot Selection and Shot Composition
benefit from information external to the system itself.
While the system is generalized in nature, the addi-
tion of specific data stores can focus the visualization
to a particular domain. Two key external data stores
were identified to be necessary. The first is the En-
terprise Ontology, which holds domain-specific infor-
mation about the business. The second is the Seman-
tic and Physical Database, which holds 3D and 2D
content (e.g., sizes and positions in the virtual world),
4
http://www.opensimulator.org/ last accessed
01/06/2013
StoryboardAugmentationofProcessModelGrammarsforStakeholderCommunication
117
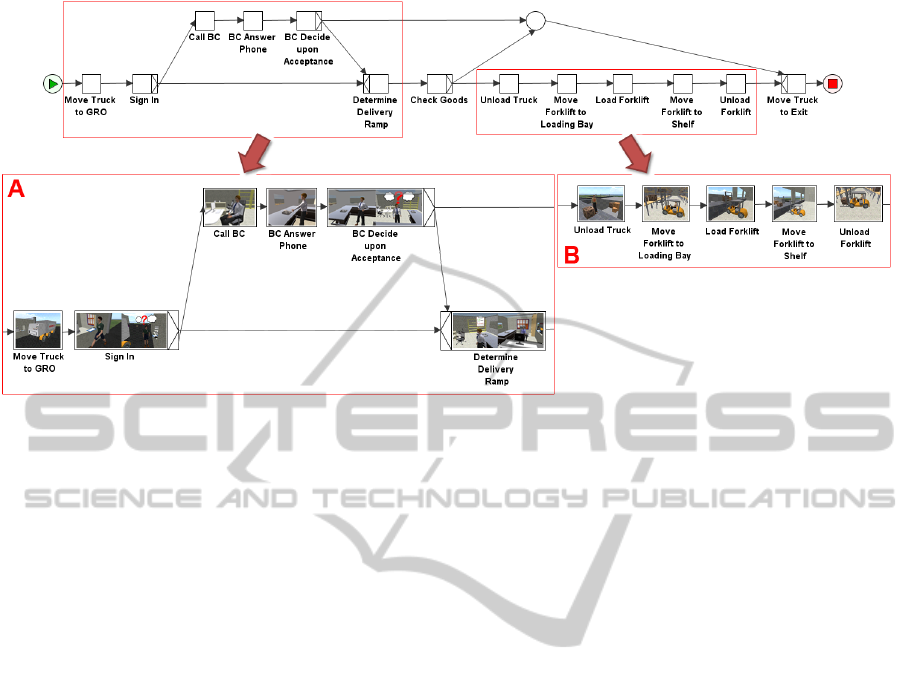
Figure 2: Top: The YAWL version of the Warehouse Order Acceptance model. A,B: The annotated version of the highlighted
parts from the YAWL version.
as well as semantic information about these resources
for more accurate placement.
5 USE CASE: WAREHOUSE
Figure 2 and Figure 3 present two use cases which
show typical warehouse delivery procedures. Both
use cases are illustrated as YAWL diagrams alone and
in combination with the automatically generated im-
ages. The first use case (Figure 2) illustrates goods
being brought in, signed for, checked and unloaded.
The second business process model (Figure 3) shows
a procedure for rejecting goods that are found to be
defective. For each model, the interpretation of the
workflow, using natural language processing, aided
by a world knowledge base, was successfully per-
formed. The tool read the process model, and deter-
mined the action, location and actors for each task.
After the interpretation had occurred, the task infor-
mation, along with 3D content was used to logically
arrange the scene. This produced a text output file
defining the avatars, geometry, camera and descrip-
tion for each scene. The visualization methods for
the various control flow methods correctly took into
account branching as well as the roles of the agents
in the control flow scenes. Our implementation for
automatically creating 3D visualizations of business
process models was evaluated by running the imple-
mentation against the five major workflow patterns:
Sequence. With sequence, an activity is only en-
abled after the previous task is completed. The impor-
tant aspects of representing sequence are arrangement
and consistency. Firstly, the images will show the ac-
tivity being carried out. In order to maintain chrono-
logical order, the images should be arranged one after
the other, in a temporal sequence (see e.g., part B in
Figure 2). The resources being used in each of the
tasks must be consistent across sequential tasks.
Parallel Split. A parallel (AND) split is ‘where a
single thread of control splits in to multiple threads
of control which can be executed in parallel’ (Van
Der Aalst et al., 2003). We choose to visualize this
pattern using a task list metaphor. The manager, as a
metaphor for the workflow system, holds a list show-
ing all the following tasks with checkboxes next to
them, implying that all of them need to be completed
(see Figure 4). This metaphor is generalizable, as a
checklist could feasably be used in any process appli-
cation domain.
Synchronization. Synchronization is where multi-
ple activities converge into one single thread of con-
trol. In order for this join to be enabled, all preceding
sub processes must be completed. Most AND joins
correspond to an AND split. The synchronization vi-
sualization method should therefore be similar to the
visualization method of the split. We propose that
completing all sub processes can be thought of tick-
ing off all tasks on a list (see Figure 4). In the image,
the manager, as a metaphor of the workflow system,
would be shown holding a list of tasks (similar to that
in the AND split) with all the tasks marked as com-
pleted. This method is again general, and can easily
be adapted to different domains. Synchronization is
performed when all workers (or ‘workflow threads’)
IVAPP2014-InternationalConferenceonInformationVisualizationTheoryandApplications
118
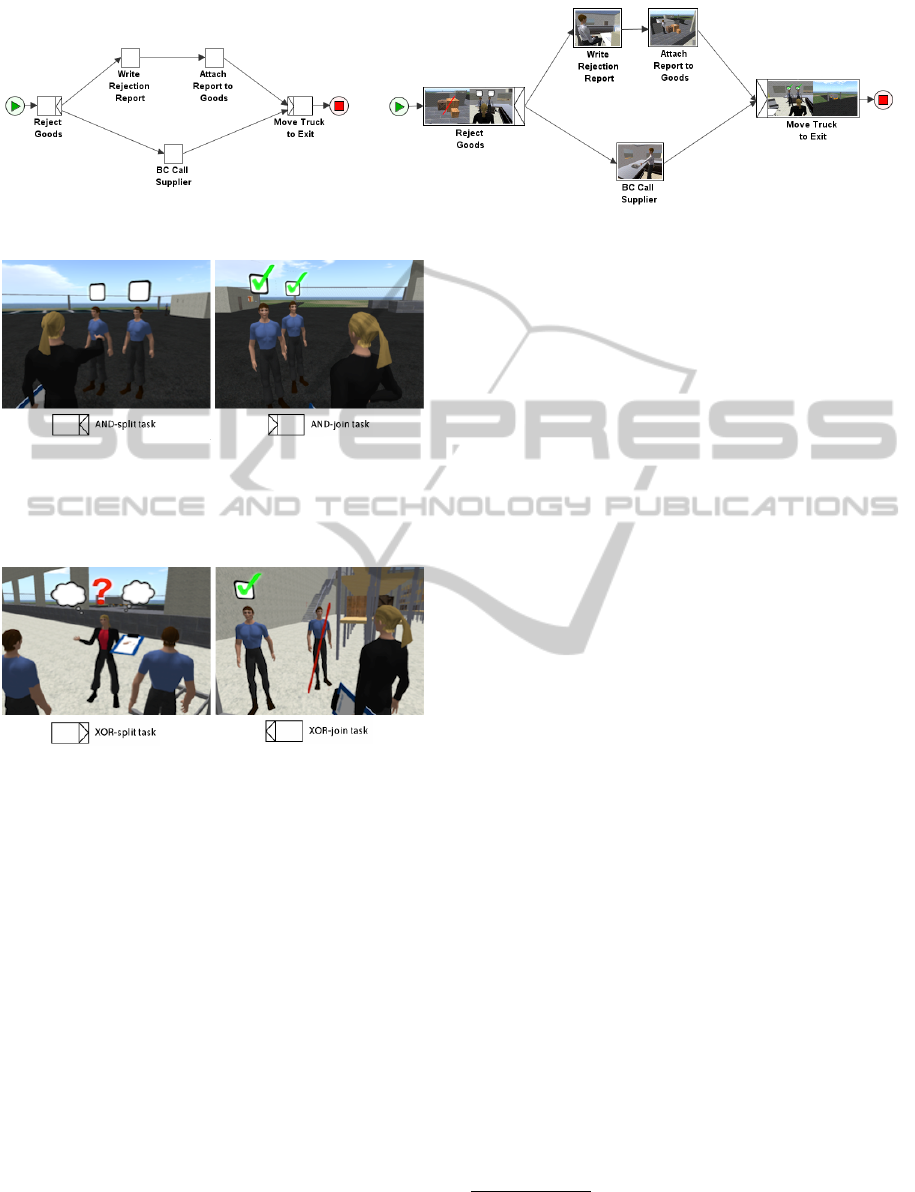
Figure 3: Left: The basic YAWL version of the Goods Rejection model. Right: The annotated model.
Figure 4: Unchecked check boxes (left image) imply tasks
that have been split in parallel, to be completed. A Syn-
chronization pattern example (right image) shows all check
boxes checked, implying completion of multiple activities.
Original YAWL grammar icons are shown below.
Figure 5: An example of an exclusive choice (left image),
where the manager is making a decision between possible
options, followed by a simple merge (right image), where
one of the tasks has been completed, and the other is ig-
nored. Original YAWL grammar icons are shown below.
complete their tasks. The image may show the man-
ager surveying the workers who were performing the
parallel tasks. The workers will be marked in some
way to denote their completion.
Exclusive Choice. Exclusive choice (XOR) is when
one and only one of the following branches is exe-
cuted, either by a decision or by some system con-
dition. In other words, the workflow manager must
make a decision as to which avenue to take. Because
choice involves cognition, the visualization of such
a non-physical action requires the use of images and
icons. In addition, there are two forms of choice, that
executed by a workflow system, and that executed by
the workflow consumer, a human agent. We illus-
trate the latter in our examples, to contrast with the
automated parallelisation performed by the workflow
management system. Human cognition is shown us-
ing thought bubbles, and choice is shown via a ques-
tion marker between thoughts of the available options
(see Figure 5). To this end, one option would be to
show the person in a thinking pose. Above his head
are thought bubbles containing icons or diagrams of
the possible choices with a question mark between
them.
Simple Merge. A simple merge, also called an XOR
join, involves combining one or more alternative
branches back into one without synchronization. It
is assumed that only one of the previous branches is
executed before enacting this join. It is usually as-
sociated with a corresponding exclusive choice con-
struct. The workflow manager waits until one of the
branches is completed. At this point, any other incom-
ing branches are discarded and the workflow moves
on. If we again imagine the workflow as a human
manager, the join may be visualized using a sequence
of images (see Figure 5). The first shows the manager
waiting with a checklist with boxes representing each
potential choice. In the second image, when a worker
returns, one of the tasks is marked as completed and
the other is crossed out, implying that it does not need
to be done.
The five main workflow patterns are represented at
least once in each of the two use cases generated by
the system. The first use case (cf. Figure 2) contains
examples of the Exclusive Choice, Simple Merge and
Sequence workflow patterns and the second use case
(cf. Figure 3) contains an example of both Parallel
Split and Synchronization. Once transferred to the vir-
tual world, the process model scenes were visualized
and then used to manually augment a YAWL process
model diagram
5
.
5
In future versions of the software we expect this to
be readily automated using the Scalable Vector Graphics
(SVG) standard - www.w3.org/Graphics/SVG
StoryboardAugmentationofProcessModelGrammarsforStakeholderCommunication
119

6 LIMITATIONS
A limitation of this approach to visualising process
models is the focus on spatial and manual activities.
A large proportion of business processes are informa-
tion flow focussed, having little physical interaction
between human or non-human resources. We conjec-
ture that the visualisation techniques described in this
paper should therefore only be applied to spatially and
manually dependent process models.
OpenSim was also problematic for some of the
tasks necessary in the automated set-up of a virtual
scene. A key issue was that the OpenSim function-
ality could not guarantee that the avatar would move
into the exact position, or be at the correct angle, due
to threading issues and bugs in the server code. All
these abilities can be achieved with the user’s own
manually-controlled avatar, but cannot be done auto-
matically with avatar bots. For the implementation,
a setup phase at the start of the session is required
to attach objects to avatars. Regardless, the process
to create the scene specification included these poses
and held items, and could output them correctly.
In many shots the camera model worked perfectly
and the creation of the images was quick and unprob-
lematic. However, the camera implementation was
imperfect in a number of cases due to the position of
the objects (which were being used to calculate the
focus point) not corresponding to the object center, or
best focus point. However, this problem is amelio-
rated in the latest versions of OpenSim, with the ad-
vent of mesh objects, removing the need to use linked
geometries with ambiguous centres of mass for most
process resources in an activity.
7 CONCLUSIONS
This work can be seen as a first step at creating a 3D
multimedia representation for process models, and
shows promise as a stakeholder communication tool
for process model validation tasks. The implemen-
tation has been tested with the five basic workflow
patterns, with consistent visual results. The approach
has been implemented as a preliminary prototype and
needs to be extended to incorporate other workflow
control patterns, and more refined multimedia fea-
tures. At present, the implementation creates a set
of still images at key points in the process model. An
interactive, movie like representation could be more
amenable to user engagement, due to higher levels of
insight via direct interaction. Ambiguities in the vi-
sualizations of the workflow patterns, however, need
to be improved. An example of this issue is the repre-
sentation difficulties that occur when two or more of
the XOR branches are completed by the same worker
representation. In addition, these visualization need
to be subjectively evaluated by stakeholders, to ob-
tain a measure of their effectiveness, e.g., to compare
if users understand the process more easily with the
storyboard-style presentation than with the commonly
used approaches.
ACKNOWLEDGEMENTS
The research was funded by COMET K1, FFG - Aus-
trian Research Promotion Agency.
REFERENCES
Bandara, W., Gable, G. G., and Rosemann, M. (2005).
Factors and measures of business process modelling:
Model building through a multiple case study. Eur. J.
Inf. Syst., 14(4):347–360.
Bandara, W., Indulska, M., Chong, S., and Sadiq, S. (2007).
Major issues in business process management: An
expert perspective. In Proc. of the 15th European
Conf. on Information Systems (ECIS), pages 1240–
1251. University of St. Gallen, Switzerland.
Bidarra, R., de Kraker, K., Smelik, R., and Tutenel, T.
(2010). Integrating semantics and procedural gener-
ation: key enabling factors for declarative modeling
of virtual worlds. In Proc. of the FOCUS K3D Conf.
on Semantic 3D Media and Content, pages 51–55.
Born, M., D
¨
orr, F., and Weber, I. (2007). User-friendly se-
mantic annotation in business process modeling. In
Proc. of the 2007 Int’l Conf. on Web Information Sys-
tems Engineering, pages 260–271. Springer.
Brown, R. A. and Rasmussen, R. K. (2010). Virtual en-
vironment visualisation of executable business pro-
cess models. In Rao, R., editor, Virtual Technologies
for Business and Industrial Applications : Innovative
and Synergistic Approaches, pages 68–88. IGI Global
Press.
Clancey, W. J., Sachs, P., Sierhuis, M., and van Hoof, R.
(1998). Brahms: Simulating practice for work sys-
tems design. International Journal of Human Com-
puter Studies, 49(6):831–865.
Coyne, B. and Sproat, R. (2001). WordsEye: an automatic
text-to-scene conversion system. In Proc. of the 28th
Annual Conf. on Computer Graphics and Interactive
Techniques, pages 487–496. ACM.
Dade-Robertson, M. (2007). Visual scenario representation
in the context of a tool for interactive storytelling. In
Cavazza, M. and Donikian, S., editors, Virtual Story-
telling. Using Virtual Reality Technologies for Story-
telling, LNCS, pages 3–12. Springer.
Daft, R. L. and Lengel, R. H. (1986). Organizational in-
formation requirements, media richness and structural
design. Manage. Sci., 32(5):554–571.
IVAPP2014-InternationalConferenceonInformationVisualizationTheoryandApplications
120

Dennis, A. R. and Valacich, J. S. (1999). Rethinking media
richness: Towards a theory of media synchronicity. In
Proc. of the 32nd Annual Hawaii Int’l Conf. on System
Sciences-Volume 1. IEEE Computer Society.
Dony, R., Mateer, J., and Robinson, J. (2005). Techniques
for automated reverse storyboarding. IEE Proc. - Vi-
sion, Image and Signal Processing, 152(4):425–436.
Gaildrat, V. (2007). Declarative modelling of virtual en-
vironments: Overview of issues and applications. In
Proc. of the Int’l Conf. on Computer Graphics and Ar-
tificial Intelligence, pages 5–15.
Gebhard, P., Kipp, M., Klesen, M., and Rist, T. (2003).
Authoring scenes for adaptive, interactive perfor-
mances. In Proc. of the 2nd Int’l Joint Conf. on Au-
tonomous Agents and Multiagent Systems, pages 725–
732. ACM.
Goldman, D. B., Curless, B., Salesin, D., and Seitz, S. M.
(2006). Schematic storyboarding for video visualiza-
tion and editing. ACM Trans. Graph., 25(3):862–871.
Hart, J. (2007). The Art of the Storyboard: A filmmaker’s
introduction. Focal Press, 2nd edition.
Jhala, A., Rawls, C., Munilla, S., and Young, R. M. (2008).
Longboard: A sketch based intelligent storyboarding
tool for creating machinima. In Wilson, D. and Lane,
H. C., editors, Proc. of the 21st Int’l Florida Artificial
Intelligence Research Society Conf., pages 386–390.
AAAI Press.
Jung, Y., Wagner, S., Jung, C., Behr, J., and Fellner,
D. (2010). Storyboarding and pre-visualization with
X3D. In Proc. of the 15th Int’l Conf. on Web 3D Tech-
nology, pages 73–82. ACM.
Kindler, E. and Ples, C. (2004). 3D-visualization of petri
net models: Concept and realization. In Cortadella,
J. and Reisig, W., editors, Applications and Theory of
Petri Nets 2004, LNCS, pages 464–473. Springer.
Koschmider, A. Reijers, H. and Dijkman, R. (2012). Empir-
ical support for the usefulness of personalized process
model views. In Christian, M. Field, S., editor, Proc.
of the Computer Science Industry Multi Conference,
MKWI 2012.
Le Roux, O., Gaildrat, V., and Caubet, R. (2004). Con-
straint satisfaction techniques for the generation phase
in declarative modeling. In Sarfraz, M., editor, Geo-
metric Modeling: Techniques, Applications, Systems
and Tools, pages 193–215. Springer.
Leoni, M., Aalst, W., and Hofstede, A. (2008). Visual sup-
port for work assignment in process-aware informa-
tion systems. In Dumas, M., Reichert, M., and Shan,
M.-C., editors, Business Process Management, LNCS,
pages 67–83. Springer.
Mendling, J., Reijers, H. A., and Recker, J. (2010). Activity
labeling in process modeling: Empirical insights and
recommendations. Inf. Syst., 35(4):467–482.
Moody, D. (2009). The ”physics” of notations: Toward
a scientific basis for constructing visual notations
in software engineering. IEEE Trans. Softw. Eng.,
35(6):756–779.
Pizzi, D., Lugrin, J.-L., Whittaker, A., and Cavazza, M.
(2010). Automatic generation of game level solutions
as storyboards. Computational Intelligence and AI in
Games, IEEE Transactions on, 2(3):149–161.
Recker, J. C., Rosemann, M., Indulska, M., and Green, P.
(2009a). Business process modeling: A comparative
analysis. Journal of the Association for Information
Systems, 10(4):333–363.
Recker, J. C., zur Muehlen, M., Siau, K., Erickson, J., and
Indulska, M. (2009b). Measuring method complexity:
Uml versus bpmn. In Proc. of the 15th Americas Conf.
on Information Systems. Association for Information
Systems.
Rosemann, M. (2006). Potential pitfalls of process model-
ing: part b. Business Process Management Journal,
12(3):377–384.
Rosemann, M., Green, P., Indulska, M., and Recker, J. C.
(2009). Using ontology for the representational anal-
ysis of process modelling techniques. International
Journal of Business Process Integration and Manage-
ment, 4(4):251–265.
Sauer, S., Osswald, K., Wielemans, X., and Stifter, M.
(2006). U-Create: Creative authoring tools for edu-
tainment applications. In G
¨
obel, S., Malkewitz, R.,
and Iurgel, I., editors, Technologies for Interactive
Digital Storytelling and Entertainment, LNCS, pages
163–168. Springer.
Sch
¨
onhage, B., van Ballegooij, A., and Elli
¨
ens, A. (2000).
3D gadgets for business process visualization - a case
study. In Proc. of the 5th Symposium on Virtual Real-
ity Modeling Language, pages 131–138. ACM.
Trkman, P. (2010). The critical success factors of business
process management. International Journal of Infor-
mation Management, 30(2):125–134.
Truong, K. N., Hayes, G. R., and Abowd, G. D. (2006). Sto-
ryboarding: an empirical determination of best prac-
tices and effective guidelines. In Proc. of the 6th
Conf. on Designing Interactive Systems, pages 12–21.
ACM.
Tutenel, T., Bidarra, R., Smelik, R. M., and Kraker, K. J. D.
(2008). The role of semantics in games and simula-
tions. Comput. Entertain., 6(4):57:1–57:35.
Van Der Aalst, W. M. P., Ter Hofstede, A. H. M., Kie-
puszewski, B., and Barros, A. P. (2003). Workflow
patterns. Distrib. Parallel Databases, 14(1):5–51.
Weitlaner, D., Guettinger, A., and Kohlbacher, M. (2013).
Intuitive comprehensibility of process models. In Fis-
cher, H. and Schneeberger, J., editors, S-BPM ONE -
Running Processes, CCIS, pages 52–71. Springer.
Weske, M. (2007). Business Process Management: Con-
cepts, Languages, Architectures. Springer.
Yeo, B.-L. and Yeung, M. M. (1997). Retrieving and visu-
alizing video. Commun. ACM, 40(12):43–52.
StoryboardAugmentationofProcessModelGrammarsforStakeholderCommunication
121
