
Investigation of the Sensorimotor Training
Analyzing Exercisers with One-dimensional and Multidimensional Instability
Angelina Thiers
1
, Annett l’Orteye
2
, Katja Orlowski
1
and Thomas Schrader
1
1
Brandenburg University of Applied Sciences, Department of Informatics and Media, Brandenburg an der Havel, Germany
2
St
¨
adtisches Klinikum Brandenburg GmbH, Akademisches Lehrkrankenhaus der Charit
´
e,
Abteilung Medizinische Schule, Brandenburg, Germany
Keywords:
Sensorimotor Training, EMG Data, Motion Data.
Abstract:
The importance and the attractivity of the sensorimotor training is still growing. Up to now the impact of
the training on the body is not yet fully investigated. Hence, nowadays the planning of the therapy is mainly
based on the experiences of the physiotherapist and on the conditions of the practice. For the development
of the therapy the physiotherapist is supported by manufacturer’s information about the exercisers as well as
by general assumptions regarding the sensorimotor training. For the validation of this information two setups
were investigated. In the first part, the behavior of two students was studied on three exercisers. Here the EMG
data and the motion data were analyzed. In the second part, the behavior of the left and the right body side
was analyzed for 16 subjects. The study revealed that the major work for the maintenance of the equilibrium is
done by the distal musculature. Furthermore, it was shown that there is a different behavior of the musculature
at both body sides. Additionally, it has been proven that each test person had an individual behavior on the
exercisers. Consequently, it would be hard to make general assumptions regarding the impact of the training
on the body.
1 INTRODUCTION
The sensorimotor training offers a great variety of ap-
plication fields as well as a lot of different exercis-
ers. Hence, it is going to be more and more attractive.
Nevertheless, the training itself is not completely in-
vestigated until now (R
¨
uhl and Laubach, 2012).
In the physiotherapists practice the training is es-
pecially used for prevention, therapy, rehabilitation as
well as for the improvement of the athletic perfor-
mance (H
¨
afelinger and Schuba, 2010).
Firstly Dr. Vladimir Janda noticed that regard-
ing the control of human movement there is a direct
correlation of the sensory and the motor system. He
pointed out that both systems react as one and that
changes in one system also lead to reactions in the
other system. He also introduced the term “sensori-
motor system”. His studies showed that the proprio-
ception, also known as depth sensitivity, is the most
significant aspect for the coordination of movement.
As part of his investigations he developed the senso-
rimotor training (Page, 2005; Lukas et al., 2011).
Besides that the motor unit activity is also a key-
word of the sensorimotor training. Motor unit activity
comprises the terms of reflexes, controlled voluntary
movements as well as rhythmic and cyclical motion
patterns. The overall process of the coordination of
the movement is a complex process. Consequently,
the success of the training depends mostly on the cor-
rect and professional execution of the training (Lukas
et al., 2011).
The growing popularity of the sensorimotor train-
ing causes a huge range of different exercisers for sup-
porting. The great amount of different exercisers and
the fact that the sensorimotor training, especially the
therapy planning is not fully investigated, make the
execution of an effective training quite difficult.
Nowadays the application of the exercisers as
well as the planning of the whole therapy is mainly
based on the experiences of the physiotherapist and
of the given possibilities in their practice (R
¨
uhl and
Laubach, 2012). The information about the exercis-
ers published by the manufacturers or in the literature
may have an influence on the planning of the training.
For example, the Balance Board should strengthen
the musculature of the buttocks, the legs, the back
and the abdomen (Sport-Thieme, 2012). The mainte-
nance of the equilibrium on the Balance Board should
71
Thiers A., l’Orteye A., Orlowski K. and Schrader T..
Investigation of the Sensorimotor Training - Analyzing Exercisers with One-dimensional and Multidimensional Instability.
DOI: 10.5220/0004637700710078
In Proceedings of the International Congress on Sports Science Research and Technology Support (icSPORTS-2013), pages 71-78
ISBN: 978-989-8565-79-2
Copyright
c
2013 SCITEPRESS (Science and Technology Publications, Lda.)
have different effects. The first effect is the improve-
ment of the inter- and intramuscular coordination of
the muscles of the feet and the legs. The second ef-
fect, staying with both feed on the Balance Board,
is the enhancement of the stabilization in the region
of the lumbar spine, the pelvis and the hip. The last
effect is the optimization of the inter- and intramus-
cular coordination of muscles of the lumbar spine,
the thoracic spine and the cervical spine (Bertram
and Laube, 2008). Another example says that the
beginners should use an exerciser like the Rocker
Board. Rocker Boards have a one-dimensional insta-
bility. The principle behind: the higher the instability
the more the musculature has to stabilize (Grifka and
Dullien, 2008).
In summary there are the following problems re-
garding the planing of the sensorimotor training:
1. Great variety of exerciser
2. Assumption of the expected trainings effects of
the exercisers are based on:
(a) the manufactures informations
(b) the literature
(c) the physiotherapists knowledge
3. It is difficult to verify the expected trainings ef-
fects
For the analyzes of the sensorimotor training, es-
pecially regarding the first two items, an investiga-
tion of the effects of three different exercisers was
made. Thereby two exercisers with a one-dimensional
and one exerciser with an multidimensional instabil-
ity were compared.
2 MATERIAL & METHODS
2.1 Measurements
The Shimmer
TM
measuring instruments are small
wireless sensors. The Bluetooth technology enables
to stream the data online and in real-time. The used
sensors were a combination of the baseboard and dif-
ferent daughterboards. The used daughterboards were
the electromyogram (EMG) as well as the gyroscope
sensor (Shimmer Research, 2011).
The EMG module allows the one channel mea-
surement of the electrical activity of a muscle. Provid-
ing pre-amplification of EMG signal the non-invasive
method represents the whole activity of a muscle
(Shimmer Research Support, 2012).
The gyroscope daughterboard consists of a single
and a dual axis angular rate gyroscope and is able to
measure three angular velocity (Kuris, 2010).
2.2 Exercisers
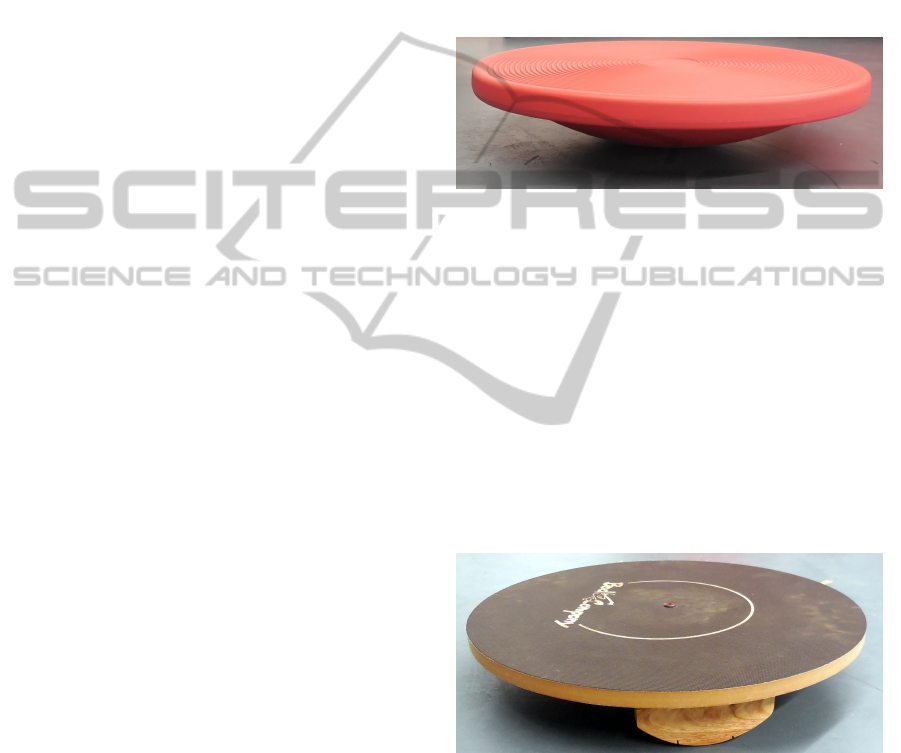
2.2.1 Balance Board
The Balance Board is an exerciser with a multidi-
mensional instability, figure 1, which offers different
fields of application. The height of the exerciser is
9 cm. The Balance Board supports the strengthening
of the musculature of the buttocks, the legs, the back
as well as the abdomen (Sport-Thieme, 2012).
Figure 1: Balance Board.
2.2.2 Rocker Board
The Rocker Board is characterized by its one-
dimensional instability with a height of 7.5 cm, fig-
ure 2. The exerciser offers either a forward-backward
or a left-right instability. The Rocker Board is made
to train the coordination, the stamina, the strength as
well as the motor skills (Bad-Company, 2013).
The left-right deflection requires movement pat-
terns performed by the extension and the flexion of
the knee joints. In contrast, the forward-backward de-
flection aims for the reaction of the ankle joint.
Figure 2: Rocker Board.
2.3 Experimental Setups
During the investigation two different setups were an-
alyzed. The main part of the analyzed data is orig-
inated in the first setup. The second setup derived
from a previous study (Thiers et al., 2013b) and was
added for statistical analyzes. The first setup is meant
to prove the assumption that the training on the exer-
ciser has got some effects on the whole body. The aim
icSPORTS2013-InternationalCongressonSportsScienceResearchandTechnologySupport
72

of the second setup was the investigation of the par-
ticipation of both body sides during the sensorimotor
training (Thiers et al., 2013a).
Supporting the objective to develop a user-
oriented experimental setup the design of the study
was made in cooperation with experienced physio-
therapists of a medical school. The requirement to
develop a test procedure which can also be executed
with patients causes the drop out of the maximum vol-
untary contraction measurement. Instead of the MVC
normalization a reference measurement in front of the
exerciser took place.
2.3.1 Setup 1
The first setup comprised of two young (age under
30 years) and healthy students. Both subjects were
not familiar with the exercisers. An equal distribution
of the sexes was given.
For the investigation two different types of
Shimmer
TM
measurement units were used. A pair
of gyroscope sensors were centrally placed on the
different exercisers. For the verification of the as-
sumption that the training on the exercisers has ef-
fects to the whole body the sensors were placed at
five different muscles along the body. The following
five muscles were recorded: the M. tibialis anterior,
the M. vastus lateralis, the M. gluteus maximus, the
M. erector spinae (longissimus) and the M. trapezius.
All test points have been measured on the right and
on the left body side. Ag/AgCl surface electrodes
were applied at the skin. The skin preparation as
well as the placement of the electrodes considered the
recommendations of the SENIAM project (SENIAM
project, 2012).
The test persons had to perform the complete test
sequence for each of the three exercisers. The sub-
jects stand on both legs for the whole time. One test
sequence comprised of a reference measurement in
front of the exerciser with a duration of 15 s as well as
of a measurement on the equipment. This part of the
procedure was divided into four consecutive phases
of changing difficulty, table 1. All phases were char-
acterized by symmetrical requirements to both body
sides. All recordings have been done without shoes.
The instructions and the supervision of the correct ex-
ecution were made by an experienced physiotherapist.
Table 1: Setup 1 - Test procedure.
Phase Task Duration
1 Eyes open 30 s
2 Eyes closed 30 s
3 Throwing a medicine ball 60 s
4 Eyes open 30 s
2.3.2 Setup 2
The second setup involved 16 healthy subjects of the
medical school and the university. Two test persons
of the original study were not included. The selection
criterion, the subjects have to be a right-hander was
not full filled. The test persons ranged from 20 years
to 53 years in age. One half of the test persons was
familiar with the used exercisers.
For the current investigation only the data of the
Balance Board is of interest. Again, different sensors
were used. Nevertheless, only the EMG data of the
left and right M. tibialis anterior were important for
the current analyzes. The skin preparation and the
placement of the electrodes followed the recommen-
dations of the SENIAM project (SENIAM project,
2012).
The exercises were characterized by standing the
whole time on both legs and symmetrical require-
ments to the body sides. In this setup one test se-
quence consists of a reference recording in front of
the exerciser and the measurement with five differ-
ent phases on the Balance Board. Four of the phases
were identical to the phases of the first setup. Con-
sequently, only these four phases were considered in
the analyzes of the behavior of the left and right body
side. Again, all test persons have not worn shoes.
2.4 Data Analyzes
Firstly the EMG data was notch filtered with a block-
ing frequency of 50 Hz. Secondly a band-pass filter
was applied to the data (Merletti and Parker, 2004).
The next step comprised the normalizations of the
EMG data. The calculation of the average muscu-
lar activity when staying in front of the exerciser was
used as normalization value. Subsequently, the ab-
solute values of the measurement on the exercisers
were transformed into relative values by using the
normalization value. Consequently, the values were
presented as percentage of the stance.
The signal processing also implies the full-wave
rectification of the EMG data (Merletti and Parker,
2004). The evaluation of the data in the time domain
includes the calculation of different statistical param-
eters. The maximum and mean values were computed
for the whole signal over a time window of 512 ms
(Gu et al., 2010). These values were used for further
calculations. On the one hand the course of the maxi-
mum values over time was documented. On the other
hand the mean value of the maximum voltage values
for each phase as well as for the complete procedure
was calculated. Next to the mean and the maximum
of the EMG the accumulated EMG activity (iEMG)
InvestigationoftheSensorimotorTraining-AnalyzingExerciserswithOne-dimensionalandMultidimensionalInstability
73

was evaluated. Therefore, the EMG was integrated
over time. Consequently, the total accumulated activ-
ity was computed by the calculation of the area un-
der the EMG for a chosen time period (Robertson and
Caldwell, 2004; Medved, 2000). This calculation was
performed for each phase as well as for the complete
test procedure. Furthermore, the course of the iEMG
was documented by the summation of the iEMG over
the time.
The transformation of the EMG signal from time
into frequency domain was achieved by using the Fast
Fourier Transformation over signal segments of 512
ms (Kaplanis et al., 2009; P. Grimshaw and Fowler,
2006). This transformation allows the computation of
parameters in the frequency domain. The total power
is described as the accumulation of the power density
spectrum (SPD) of the whole frequencies (f), equation
1 (Kaplanis et al., 2009).
E
totalPower
=
Z
∞
0
S
PD
( f )d f (1)
The parameter is used as an indicator for muscle fa-
tigue. An increase of the total power indicates that the
muscle is fatigued.
In addition to the EMG data the gyroscope data
was also analyzed. The motion data was low-pass fil-
tered. Afterwards the direction of motion as well as
the current deflection was computed.
3 RESULTS
The accumulated EMG activity was calculated for
each muscle and for each exerciser. For the com-
parison of the participation of the individual muscles
the one with the highest activity value was declared
as 100 %. All other activity values of the remaining
muscles were set in relation to the 100 %.
Figure 3 shows the course of the accumulated
EMG activity of the M. tibialis anterior and the M.
vastus lateralis for both body sides of test person two
on the left-right Rocker Board. In this case the 100 %
were achieved by the right M. vastus lateralis. This
observation goes along with the expected relationship
of the participation of the individual muscles. The
left-right Rocker Board especially requires the flexion
and the extension of the knee which is among other
things realized by the M. vastus lateralis.
Another outcome of figure 3 is that both sides of
the M. tibiales anterior perform less work than the
right M. vastus lateralis. It is also shown that the
left muscles only carry out half of the activity com-
pared to the right side. Additionally, it can be seen
that with the beginning of the second phase the val-
ues of the EMG activity as well as the difference in
the amount of the activity between the two muscles
increases. Both muscles have in common that the dif-
ference in the amount of the activity level raises over
time.
This behavior was analyzed in the context of the
direction of motion. However the distribution of the
direction does not depend on the overall time the
board moved to right is similar to the overall dura-
tion of the left movements. Hence, the dominance of
the right musculature depends not on the supremacy
of one direction of motion.
Figure 3: Left-right Rocker Board - Accumulated Activity
(TP 02).
Figure 4 visualizes the average maximum values
for each phase for each muscle when test person two
used the Rocker Board (left-right). The first finding
is, that during the initial phase nearly for all muscles
the lowest values were documented. Although, the
first and the last phase require an identical task, the
measured values of the last phase were higher. This
highlights that there is a slow relaxation of the muscle
activity.
The second finding is, that the highest values were
always reached by the distal musculature. Especially,
for the left and right M. gluteus maximus and the left
and right M. trapezius descendens relatively low volt-
age values were documented.
The highest values for nearly all muscles can be
seen during the third phase “Medicine ball”. The
catching and throwing of the ball causes an additional,
external stimulus which influences the maintenance
of the balance. Furthermore, the execution of this
motion sequence requires the left and right M. erec-
tor spinae. Consequently, for a higher participation of
the back muscles an external stimulus is needed. This
also supports the assumption that the major part of the
work for the maintenance of the equilibrium is done
by the distal musculature and that for a participation
of the proximal musculature an external stimulus is
required.
Another outcome of figure 4 is that in most cases
the higher voltage values were reached by the right
body side. In particular, the difference between the
icSPORTS2013-InternationalCongressonSportsScienceResearchandTechnologySupport
74

documented values of the left and right body side of
the leg muscles supports the assumption that there
is a dominance of the strain in the right body side
although a symmetrical requirement to both sides is
given, again.
Figure 4: Forward-backward Rocker Board - Average Max-
imum Values (TP 02).
Figure 5 shows the course of the average maxi-
mum values as well as the course of the total power
of the left and right M. gluteus maximus of test person
one during the usage of the Balance Board.
Figure 5: Balance Board - Average Maximum Values and
Total Power (TP 01).
On the one hand the illustration points out that
the right body side is generating higher voltage val-
ues over the whole time. On the other hand, it can
be seen that nearly for the whole time the values of
the left muscle show an amount of under 100 %. This
means that the left muscle is producing lower voltage
values during the measurement on the Balance Board
than during the reference recording in front of the ex-
erciser. On the contrary, the voltage values of the right
M. tibialis anterior were between 200 and 2000 %.
This finding is a reason to assume, that the accessory
muscles, like the ischiocrural muscles, are mostly re-
sponsible for the maintenance of the functions of the
M. gluteus maximus.
The lower section of figure 5 shows the course
of the total power of the left and right M. gluteus
maximus. Fatigue is defined in muscle physiology
as a state when a subject can no longer maintain a
required force (Merletti and Parker, 2004). Hence,
the maintenance demands an increasing recruitment
of motor units (Lukas, 2000). Although, the left M.
gluteus maximus produces lower voltage values, the
total power of the left muscle is nearly the whole time
higher than the total power of the right body side.
Consequently, the left muscle had recruited a higher
number of motor units despite the lower voltage val-
ues.
The illustration 6 provides a brief overview of the
complete muscular activity of each muscle on each
exerciser for both test persons. The muscle with
the highest strain from both subjects represents the
100 %. The values of the remaining muscles from
both test persons were presented in relation to the
100 %.
The complete muscular activity for test person one
for each muscle and each exerciser is documented
in the upper part of the figure 6. The 100 % were
achieved by the right M. tibiales anterior during the
execution of the trial on the forward-backward Rocker
Board. Furthermore, the second highest value was
achieved on the same exerciser but in this case by the
left M. tibialis anterior.
The figure also points out that the strain of the
individual exercisers aims to different muscles. Us-
ing the Balance Board mostly burdens the left and
right M. vastus lateralis. In contrast, the M. erector
spinae shows for both body sides the highest values
on the left-right Rocker Board. As already mentioned
the forward-backward Rocker Board shows the high-
est strain in the M. tibialis anterior. Nevertheless, the
first and last exerciser have in common, that the distal
musculature shows the highest values. The ranking
of the overall strain of the three exercisers shows the
order (highest strain first): forward-backward Rocker
Board, Balance Board, left-right Rocker Board.
The values of the complete activity of all muscles
on all exercisers of test person two are presented in
the lower part of figure 6. Test person two obtained
the highest values with the right M. vastus lateralis on
the left-right Rocker Board. The overall comparison
of the three exercisers shows that the Balance Board
seems to be the smallest challenge for the test person.
In contrast, the highest complete strain was achieved
by the left-right Rocker Board. The various forms
of the Rocker Board required different muscles. The
left-right Rocker Board has the highest effort in the
right M. vastus lateralis. On the contrary, the right M.
tibialis anterior shows the highest values during the
usage of the forward-backward Rocker Board. Again,
all exercisers have in common, that the highest values
were documented for the distal musculature. The dif-
ference of the amount of the activity of the leg mus-
cles on the individual exercisers is greater than the
InvestigationoftheSensorimotorTraining-AnalyzingExerciserswithOne-dimensionalandMultidimensionalInstability
75

single values of the M. gluteus maximus, M. erector
spinae and the M. trapezius descendens.
The illustration also figures out, that on each exer-
ciser all muscles, except the M. trapezius descendens,
show the highest values for the right body side. All
exercisers have in common, that the EMG activity of
the test person differs. Although the test persons used
the same exercisers and had to handle identical tasks
the individual requirements seem to be different.
Figure 6: Activity - Comparison of the three exercisers.
The current figure 7 shows the deflection into the
direction forward-backward. In the upper part of the
figure the deflection for the Balance Board is shown.
The course of the forward- backward Rocker Board is
shown in the lower part of the figure.
Figure 7: Balance Board and forward-backward Rocker
Board - Deviation (TP 01).
The Balance Board shows no drift in one direction
over the whole time. Only during the phase “Eyes
closed” (Phase two) a drift can be seen. Immedi-
ately after the visual analyzers, the eyes, are turned on
again, the drift is corrected. In the third phase greater
deflections were measured, they are caused by the ad-
ditional difficulty induced by the external stimuli of
the medicine ball. On the whole, the course is char-
acterized by small and short deflections around the
baseline.
The course of the forward-backward Rocker
Board only shows slight differences during the indi-
vidual phases in the amount of the values of the de-
flection. In the first and second phase a short and
small drift was documented. In both cases the drift is
correct after 15/ 20 s. The comparison of the strength
of the deflection from the forward-backward Rocker
Board to the intensity of the forward-backward de-
flection of the Balance Board shows differences. The
intensity of the deflection of the Rocker Board is
much greater than the intensity of the Balance Board.
Figure 8 serves the comparison of the left-right re-
lation of the M. tibialis anterior on the Balance Board.
Therefore the average maximum voltage values of 18
test persons (two from setup one and 16 subjects from
setup two) were summed up in the box plot.
The figure points out, that the highest voltage val-
ues were produced by the right M. tibialis anterior
during the second phase “Eyes closed”. One addi-
tional finding of the right body side during this phase
is, that it has the largest range between the maximal
and the minimal values. This may mean that the in-
dividual persons react in different ways to the elim-
ination of the visual analyzer. The behavior of the
test persons depend on their age, their balance skills,
their muscles, their motor and coordination skills and
so on. This influential factors cause, that for some
people the consequences regarding the maintenance
of the equilibrium are greater than for others. The fig-
ure 8 also brings out, that in the overview of all test
persons the right side is the dominant body side for
all considered scenarios. On the one hand, every time
the median value is higher on the right side of the M.
tibialis anterior. On the other hand, the 75 th per-
centile is also always greater on the right body side.
In addition, the left body side has always the lowest
minimum values (25 th percentiles).
Figure 8: Comparions of the average maximum voltage val-
ues of both body sides.
The current box plot of figure 9 shows the aver-
age maximum voltage values of the test person from
both setups for the M. tibialis anterior and the M. glu-
teus maximus. On the one hand the measured val-
ues again document that the major part of the work
is done by the distal musculature. The median value
of the M. tibialis is up to four times higher than the
median value of the M. gluteus maximus. The docu-
icSPORTS2013-InternationalCongressonSportsScienceResearchandTechnologySupport
76

mented values of the M. gluteus maximus correspond
to the activity values during the reference measure-
ment in front of the exerciser. Consequently, it is
shown that the continuation of the muscular activity
up to the proximal musculature has only a small ex-
tent because the demand to the musculature is slightly
higher than in demand in front of the exerciser.
Figure 9: Comparions of the average maximum voltage val-
ues of M. tibialis anterior and M. gluteus maximus.
For further statistical analyzes the “Chi-squared”
test was performed for the 18 test persons from setup
one and setup two when using the Balance Board.
The statistical investigation was made for the average
maximum values for the left and right M. tibialis an-
terior. Therefore a comparison of the voltage values
of each test person was computed. For each subject
a decision which body side reached the higher values
was made. The evaluation was fulfilled for each phase
and for the overall measurement. Consequently, the
H
0
hypothesis, that there is no dependency between
the maximum values and the body side, was rejected
to significance level of 5 %.
4 DISCUSSION
The experimental study points out four important
findings. Firstly, the assumption that the muscles of
nearly the whole body were involved in the process
of the maintenance of the equilibrium on the exer-
cisers could not be proofed. Secondly, there is a
different behavior regarding the left and right mus-
culature. The third finding is, that it is not pos-
sible to make a general assumption, that exercisers
with a one-dimensional instability are easier to handle
than the exercisers with a multidimensional instabil-
ity. The last finding is, that each test person shows an
individual behavior on the exercisers.
The analyzes of setup one showed, that the major
part of the work for the maintenance of the equilib-
rium is done by the distal musculature. To achieve
a higher participation of the proximal musculature
an external stimuli, like catching and throwing of a
medicine ball is needed. Especially, for the left and
right M. gluteus maximus low voltage values were
documented. This observation leads to the hypothe-
sis that the ischiocrural musculature takes the job of
the M. gluteus maximus.
The study of the voltage values of the left and right
body side was carried out for both setups. The investi-
gation of setup one showed that in most cases the right
musculature achieved the higher voltage values. In
particular, the distal musculature of the left and right
body side often shows great differences between the
maximum voltage values as well as between the accu-
mulated EMG activity. This finding was supported by
the statistical analyzes of the maximum voltage val-
ues for subjects of setup one and two.
Both, the EMG data and the motion data of the
three exercisers, showed, that it is not possible to
determine the difficulty of an exerciser by one- or
multidimensional instability. The exercisers with the
one-dimensional instability were in both cases the
one with the greater deflection and the greater volt-
age values. However, both test persons from setup
one achieved the highest values on different Rocker
Boards.
The overall finding is, that it is not possible to
make general assumptions about the usage as well as
about the effects of the exercisers. This is due to the
fact that the test persons showed an individual behav-
ior on the equipment.
5 CONCLUSIONS
The investigation of the three exercisers reveals that
it is necessary to analyze the sensorimotor training
more detailed. It is not enough to take the manufac-
tures information, the literature as well as the practical
knowledge in consideration. Rather the results show
that the application and the corresponding effects of
the exercisers depend on the behavior of the subject.
One solution for the improvement and the verification
of the training is the application of wireless sensors.
The usage of wireless sensors is a helpful instrument
to analyze the behavior of different subjects on the
exercisers. Consequently, the physiotherapist has to
consider the characteristics of the patient in the plan-
ning of the therapy. Furthermore, the use of wireless
sensors are a very good way to document the develop-
ment and the results of the therapy. The physiothera-
pist are able to control the changes of the behavior of
the muscles.
A second point for an effective planning of the
therapy is excellent knowledge about the exerciser. In
the majority of cases the product descriptions include
InvestigationoftheSensorimotorTraining-AnalyzingExerciserswithOne-dimensionalandMultidimensionalInstability
77

information of the material, the height, the diameter
and sometimes the angle of deflection. All analyzed
exercisers have similar values regarding the height,
the diameter as well as the angle of deflection. Nev-
ertheless, the test persons showed different activation
patterns. This leads to the recommendation that the
product descriptions should include additional infor-
mation, for example about the own weight of the ex-
erciser or information about the special characteristics
of the supporting surface.
The current results can be extended to a more de-
tailed investigation of the behavior of the muscles in
dependency of the movement on the exerciser and
with a greater number of test persons. With the help
of the mobile sensors it is also possible to give an im-
mediate feedback for the correction of the dominance
of one body side. This different behavior of the body
sides will be analyzed more detailed in further stud-
ies. In this context we will also analyze whether the
dominance of the right side is caused by the fact that
the test persons were all right handed.
REFERENCES
Bad-Company (2013). Deluxe balance board set 45cm aus
holz in studio-qualit
¨
at. Website. Available online
at http://www.webcitation.org/6Fg4kjCXJ, visited on
April 6th 2013.
Bertram, A. M. and Laube, W. (2008). Sensomotorische Ko-
ordination: Gleichgewichtstraining auf dem Kreisel.
Thieme.
Grifka, J. and Dullien, S. (2008). Knie und Sport:
Empfehlungen von Sportarten aus orthop
¨
adischer
und sportwissenschaftlicher Sicht. Deutscher Arzte-
Verlag.
Gu, Y., Li, J., Ruan, G., Wang, Y., Lake, M., and Ren,
X. (2010). Lower limb muscles semg activity dur-
ing high-heeled latin dancing. In Lim, C. and Goh, J.,
editors, IFMBE Proceedings. Springer.
H
¨
afelinger, U. and Schuba, V. (2010). Koordinationsthera-
pie: Propriozeptives Training. Meyer & Meyer Ver-
lag.
Kaplanis, P., Pattichis, C., Hadjileontiadis, L., and Roberts,
V. (2009). Surface emg analysis on normal subjects
based on isometric voluntary contraction. Journal of
Electromyography & Kinesiology, pages 157–171.
Kuris, B. (2010). Kinematics Guide Revision 1e. Shimmer
Research.
Lukas, C., Fr
¨
ohlich, V., Kapferer, H., and Zelder, C.
(2011). Sprunggelenksverletzungen im Basketball:
Hintergr
¨
unde, Therapie und Prophylaxe. Books on
Demand.
Lukas, C. M. (2000). Kraftverhalten und elektromyo-
graphische Untersuchungen an der Unterschenkel-
muskulatur bei Patienten nach operativ versorgter
Achillessehnenruptur. PhD thesis, Eberhard-Karls-
Universit
¨
at zu T
¨
ubingen.
Medved, V. (2000). Measurement of Human Locomotion.
CRC Press.
Merletti, R. and Parker, P. A. (2004). Electromyography.
John Wiley & Sons.
P. Grimshaw, A. L. and Fowler, N. (2006). Sport and Exer-
cise Biomechanics (BIOS Instant Notes). Bios Scien-
tific Publ.
Page, P. (2005). Sensorimotor Training: A global approach
for balance training.
Robertson, D. G. E. R. and Caldwell, G. (2004). Research
Methods in Biomechanics. Human Kinetics.
R
¨
uhl, J. and Laubach, V. (2012). Funktionelles Zirkel-
training: Das moderne Sensomotoriktraining f
¨
ur alle.
Meyer & Meyer Verlag.
SENIAM project (2012). Sensor placement. Website.
Available online at http://www.seniam.org; visited on
October 25th 2012.
Shimmer Research (2011). Shimmer-brochure-pack. Tech-
nical report.
Shimmer Research Support (2012). EMG User Guide Rev
1.2. Shimmer Research.
Sport-Thieme (2012). Sport-thieme
R
: Sport- und
therapiekreisel. Website. Available online at
http://www.webcitation.org/6BgicOk7Y; visited on
October 25th 2012.
Thiers, A., l’Orteye, A., Orlowski, K., and Schrader,
T. (2013a). Analyse der muskul
¨
aren stabilisation
w
¨
ahrend des sensomotorischen trainings bei verwen-
dung von ger
¨
aten mit ein- und mehrdimensionaler in-
stabilit
¨
at mit hilfe von drahtlosen sensoren. GMDS
2013 58. Jahrestagung der Deutschen Gesellschaft fr
Medizinische Informatik, Biometrie und Epidemiolo-
gie (GMDS) e.V.
Thiers, A., Meffofok, L., Orlowski, K., Schrader, K., Titze,
B., l’Orteye, A., and Schrader, T. (2013b). Investiga-
tion of the sensorimotor training using wireless sensor
networks. Healthinf 2013.
icSPORTS2013-InternationalCongressonSportsScienceResearchandTechnologySupport
78
