
Testing the Differences of using RGB and HSV Histograms during
Evolution in Evolutionary Art
P. Garc
´
ıa-S
´
anchez
1
, J. J. Merelo
1
, D. Calandria
2
, A. B. Pelegrina
3
, R. Morcillo
4
, F. Palacio
4
and R. H. Garc
´
ıa-Ortega
5
1
Dept. of Computer Architecture and Computer Technology and CITIC-UGR, ETS. Inform
´
atica y Telecomunicaci
´
on,
University of Granada, Granada, Spain
2
Proemium, Granada, Spain
3
Department of Translation and Interpreting, University of Granada, Granada, Spain
4
ETS. Inform
´
atica y Telecomunicaci
´
on, University of Granada, Granada, Spain
5
Fundaci
´
on I+D del Software Libre, Granada, Spain
Keywords:
Evolutionary Art, HSV, RGB, Processing.
Abstract:
This paper compares the use of RGB and HSV histograms during the execution of an Evolutionary Algorithm.
This algorithm generates abstract images that try to match the histograms of a target image. Three different
fitness functions have been used to compare: the differences between the individual with the RGB histogram
of the test image, the HSV histogram, and an average of the two histograms at the same time. Results show
that the HSV fitness also increases the similarities of the RGB (and therefore, the average) more than the other
two measures.
1 INTRODUCTION
Evolutionary Art (Corne and Bentley, 2001) is a
branch of generative art (Fernandes et al., 2012) cre-
ated using a computer, following the principle of the
survival of the fittest, using Evolutionary Computa-
tion methods (Eiben and Smith, 2005). A population
of artistic works (individuals) are evaluated with an
aesthetic measure to yield a score (fitness). These in-
dividuals are combined and mutated to generate an
offspring with inherited properties of the parents, dur-
ing a certain number of times.
There exist several metrics to score the gener-
ated images, such as opinion from humans, or image
characteristics (for example, specific combination of
colours). The main goal of this paper is to study the
differences of using the information of the HSV (Hue,
Saturation, Value) and RGB (Red, Green, Blue) his-
tograms during the evolution. Although the two his-
tograms represent the same information, using HSV
(instead as RGB) as a color model increases the ac-
curacy in image retrieval and indexing, as explained
in (Sebe and Lew, 2000). The results of this investi-
gation can help in future evolutionary art algorithms,
adding the most appropiate color model feature with
other features available in the literature. For example,
to be used as one of the features of any kind of classi-
fier. In this work the Processing (Reas and Fry, 2007)
framework is used inside an Evolutionary Algorithm
(EA) to model the individuals, generate their associate
images and extract information of them (HSV, RGB
and Average histograms) to fit with the histograms of
a test image. Processing has been integrated in the
OSGiLiath (Garc
´
ıa-S
´
anchez et al., 2013) evolution-
ary framework to take advantage of the capabilities
offered in image manipulation and analysis.
The rest of the work is organized as follows: in
Section 2, a brief review on Evolutionary Art is pre-
sented. Processing framework and image informa-
tion are described next (Section 3). The experimental
setup and results are presented in Sections 4 and 5,
respectively. Finally, the conclusions and future work
can be found in Section 6.
2 STATE OF THE ART
Computational Aesthetics “is the research of compu-
tational methods that can make applicable aesthet-
168
García-Sánchez P., Merelo J., Calandria D., Pelegrina A., Morcillo R., Palacio F. and García-Ortega R..
Testing the Differences of using RGB and HSV Histograms during Evolution in Evolutionary Art.
DOI: 10.5220/0004629701680174
In Proceedings of the 5th International Joint Conference on Computational Intelligence (ECTA-2013), pages 168-174
ISBN: 978-989-8565-77-8
Copyright
c
2013 SCITEPRESS (Science and Technology Publications, Lda.)

ics decisions in a similar fashion as humans can”
(Hoenig, 2005). In the field of computational aesthet-
ics, evolutionary systems can play an important role,
by enabling the evolution of aesthetically pleasing
or innovative structures (DiPaola and Gabora, 2009).
Evolutionary art is characterized by the use of evolu-
tionary principles and natural selection as a genera-
tive process. One of the earliest applications of evo-
lutionary systems to generate art is the proposal of
Sims to use an EA to create complex images (Sims,
1991) or virtual creatures (Sims, 1994). In evolution-
ary art systems, the evaluation of the aesthetics can
be done using human feedback, with some interactive
evaluation of the population, such as (Ashlock, 2006;
Draves, 2006; Moroni et al., 2000) and (Sims, 1991).
It also can be achieved by using an automatic evalu-
ation of fitness, as presented in (Aguilar and Lipson,
2008; Den Heijer and Eiben, 2010; DiPaola and Gab-
ora, 2009; Li et al., 2012), and (Sims, 1994).
One of the main challenges in Evolutionary Art is
how to measure aesthetic value of a piece of evolu-
tive art. The source of this difficulty lies in the in-
herent complexity, subjectivity and dynamism of aes-
thetics. Nevertheless, a wide number of metrics has
been presented. According to (Galanter, 2012), these
measures can be classified into several categories in
several pieces of research. The first category involves
the evaluation of the aesthetics of a piece of art by a
formula or principle (e.g., pythagorean proportions).
Other measures apply certain principles of design,
such as the rule of thirds or color theory (e.g., us-
ing complimentary colors in Pop Art (den Heijer and
Eiben, 2012)), neural networks or complexity mea-
sures.
This classification also provides a sub-
classification for evolutionary systems. First, it
identifies interactive evolutionary systems, where the
fitness of the individuals is determined by human
agents. Another category is performance based goals:
certain properties of the art piece are evaluated and
optimized based on performance measures (e.g.,
usable surface in a furniture design generator). Other
systems use an exemplar (i.e., real world example)
as a way to measure the fitness of the individuals.
Finally, some models use the idea that the complexity
is directly related to aesthetics and follow the path
firstly stablished in (Birkhoff, 2003). Given the
multidimensional nature of aesthetics judgement,
multi-objective EAs are a straightforward option to
deal with this multidimensionality. Other extensions
to EA, like coevolution or agent swarm behavior, can
be used in evolutionary art systems.
A brief classification of the aesthetic measures
found in the evolutionary art systems mentioned in
the previous paragraph is shown in Table 1.
Several methods for the representation of the art
in evolutionary art have been proposed. In symbolic
expression, the genotype is a tree of expressions and
the phenotype consists in the image produced by the
evaluation of the tree. Shape grammars can also be
used as a formal description of the image. Previously
existing images can be used as a basis for the evo-
lution process. Finally, other representations can be
based on mathematical models, like fractals or cellu-
lar automata.
3 PROCESSING AND
HISTOGRAMS
In this section we describe Processing
1
and the his-
tograms used. Processing (Reas and Fry, 2007) is
a framework formed by a simple programming lan-
guage and an integrated development environment
(IDE) primarily created for electronic and visual
artists, designers, musicians, etc. Processing offers
the following advantages:
• Processing was created for artists, rather than pro-
grammers. So, it allows very complex draw-
ings and interactive applications with few lines of
code.
• It is an Open Source software (licensed under the
GNU Lesser General Public License), and counts
with a large development community.
• It is based on OpenGL, thus providing 3D accel-
eration.
• It also includes more than 100 libraries for video,
sound, physics, computer vision, networking, etc.
• Easy integration with Java, HTML5 and Android.
However, being a light framework, there exist
some disadvantages:
• More complex applications require more pro-
gramming skills.
• The calculations of large computer images are a
bit inefficient (although expert programmers can
manage OpenGL at low level to fix this).
There exist a lot of interactive artistic projects
made with Processing; examples include art
generation, artificial life, interactive music
and other. A good selection can be seen in
http://processing.org/exhibition/.
The Color module can be used to analyze images
taking into account their histogram. The color his-
togram represents the frequency of occurrence of each
1
http://www.processing.org/
TestingtheDifferencesofusingRGBandHSVHistogramsduringEvolutioninEvolutionaryArt
169
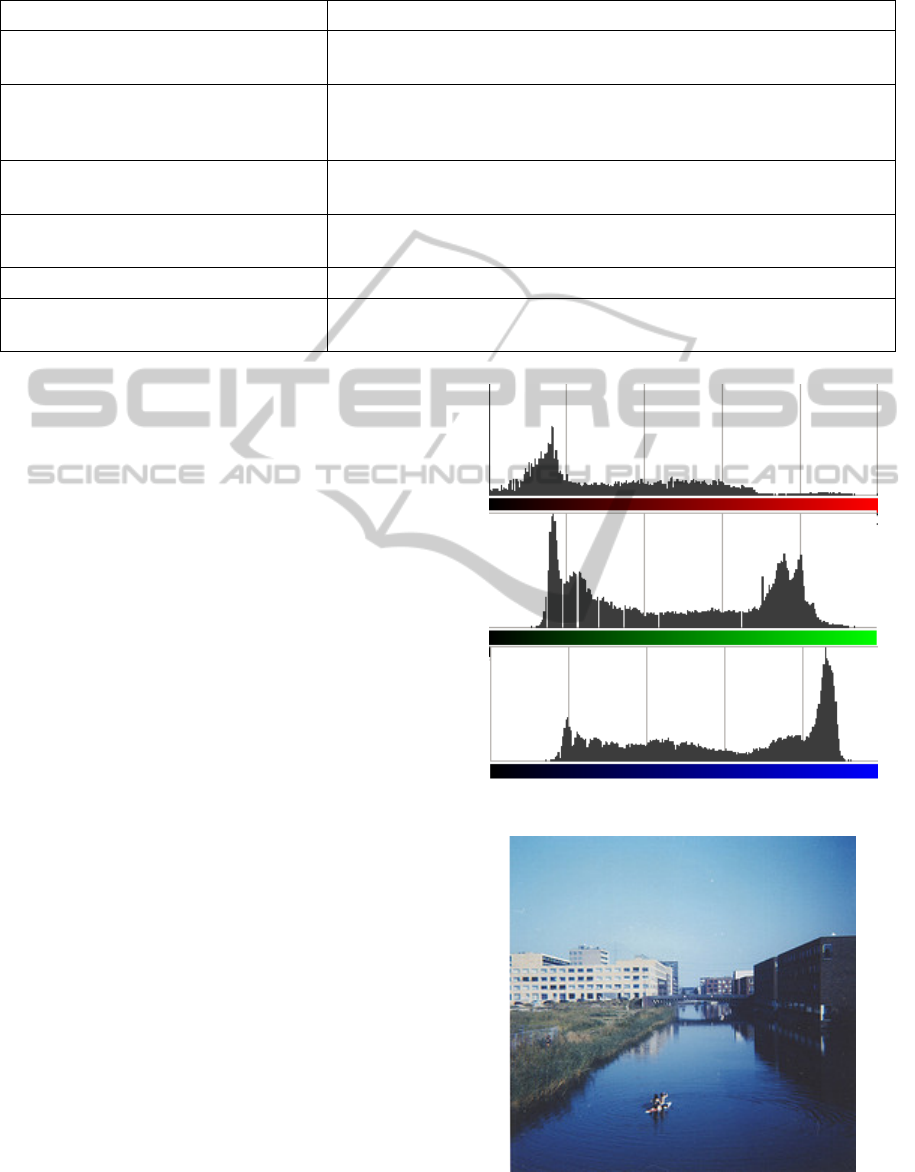
Table 1: Classification of the aesthetic measures used in a brief review of the literature on evolutive art.
Type Aesthetic Measure
Formulaic and Geometric Theories Fractal dimension (Den Heijer and Eiben, 2010), Image order (Li
et al., 2012), Benford Law (Del Acebo and Sbert, 2005)
Based on Design Principles Color contrast (hue) (den Heijer and Eiben, 2012), Color ingredi-
ent (Li et al., 2012), Composition, tonality and color (DiPaola and
Gabora, 2009).
Interactive Evolutionary Computation The electric sheep project (Draves, 2006) (Ashlock, 2006; Moroni
et al., 2000)
Error relative to Exemplars Resemblance score (DiPaola and Gabora, 2009), pixel comparation
(Aguilar and Lipson, 2008)
Performance based goals Evolving virtual creatures (Sims, 1994)
Complexity measures Image complexity (Li et al., 2012), Machado and Cardoso aesthetic
measure (Machado and Cardoso, 1998)
color intensities present in the image, by accounting
for such sharing pixels color intensity values.
The histogram is composed of different ranges or
bins that represent a value or set of values of color
intensity. The color space is defined as a model
representation with respect to color intensity values.
Two color models are used in this paper: RGB (Red,
Green, Blue) and HSV (Hue, Saturation and Value).
The RGB model is an additive color model in which
red, green and blue are added together in different
proportions to reproduce a wide range of colors, while
the HSV is based on hue or tone, saturation and
brightness. While the RGB model is the closest to the
way color is processed in some machines, the HSV
representation provides a more accurate way to model
how humans perceive colors, and also provides more
information in image retrieval (Sebe and Lew, 2000).
Figure 1 shows the RGB histogram of the image in
Figure 2 (photo taken by the first author).
4 EXPERIMENTAL SETUP
This section shows how Processing has been used in
the EA, the individual representation, the fitness func-
tions, and the parameters of the experiments.
4.1 Integrating Processing in Java
Processing can be integrated with Java just by adding
a jar (a Java library) to existing software. In this
work, Processing has been integrated to an existent
EA framework, OSGiLiath (Garc
´
ıa-S
´
anchez et al.,
2013), a service-oriented framework based on Java
that includes a lot of primitives and services for Evo-
lutionary Computation. A new module called OS-
Figure 1: RGB histogram of Figure 2.
Figure 2: Test image to compare with the Fitness functions
of our algorithm.
IJCCI2013-InternationalJointConferenceonComputationalIntelligence
170

GiLiART has been added to the publicly-available
source code of OSGiLiath (available in
http://www.
osgiliath.org
) under a LGPL License. Then, us-
ing the packages available in the Processing library
the EA can generate individuals, manipulate images
or extract information.
4.2 Individual Representation
To perform the experiments, the genome of the indi-
vidual is a list of circles. Each circle has a position,
radium and color. This list can be recombined or mu-
tated (changing the color, position or radium of a cir-
cle of the list).
4.3 Fitness used
For this piece of research, we focused on the aes-
thetics measure of histogram comparison. The fitness
functions are included in the “Error relative to Exem-
plars” category, using Galanter (Galanter, 2012) clas-
sification. The idea is to obtain an image with the
same proportion of tones and colors of a aesthetical
existent image.
Three different fitness functions have been tested:
• RGB Difference: The difference of the RGB his-
togram of the individual with the RGB histogram
of the test image.
• HSV Difference: The difference of the HSV his-
togram of the individual with the HSV histogram
of the test image.
• Average Difference: An average of the two previ-
ous differences.
The range of the these fitness function has been
normalized to vary from 0 (totally different his-
tograms) to 1 (the same histogram).
For every color property (i.e., RED, GREEN,
BLUE, HUE, SATURATION and VALUE), the his-
togram is computed using the expression (1) for each
possible value (0-255). Then, again for every prop-
erty, the difference between the target image and the
individual histograms is obtained using (2). Finally,
the three fitness are calculated: RGB fitness (6), HSV
fitness (10) and AVERAGE fitness (11).
H(c, prop) =
1
N
N
∑
j=0
{
1 prop( j ) = c
0 otherwise
(1)
di f f (h
1
, h
2
) =
255
∑
j=0
|h
1
( j) − h
2
( j)| (2)
d
R
(i) = di f f (H(i, RED), H(target, RED)) (3)
d
G
(i) = di f f (H(i, GREEN), H(target, GREEN)) (4)
d
B
(i) = di f f (H(i, BLUE), H(target, BLUE)) (5)
f itness
RGB
(i) = 1 − 128
d
R
(i) + d
G
(i) + d
B
(i)
3
(6)
d
H
(i) = di f f (H(i, HUE), H(target, HUE)) (7)
d
S
(i) = di f f (H(i, SAT ), H(target, SAT )) (8)
d
V
(i) = di f f (H(i, VAL), H(target, VAL)) (9)
f itness
HSV
(i) = 1 − 128
d
H
(i) + d
S
(i) + d
V
(i)
3
(10)
f itness
AV ERAGE
(i) =
f itness
RGB
+ f itness
HSV
2
(11)
4.4 Parameters used
A steady-state evolutionary algorithm has been used.
Each individual is randomly generated at the initial-
ization of the EA. The genome size is 50 elements
(circles of maximum radium of 128 pixels). Popu-
lation size has been set to 32 individuals. Uniform
crossover rate is 0.5, and a binary tournament has
been chosen for selection (that is, a pool of 16 par-
ents is selected and crossed). Mutation probability is
0.04 (the usual value of 1/genomesize). Finally, the
image size for each individual is 256x256 pixels. The
individuals have been compared with the histograms
obtained from the image of Figure 2 to guide the evo-
lution.
5 RESULTS
Because of the stochastic nature of the EAs, each al-
gorithm has been executed 30 times for each differ-
ent fitness. Table 2 shows the average differences
(and standard deviation) attained with each fitness
used. As can be seen, using the HSV histogram dif-
ferences as fitness produces a higher RGB similarity
(and therefore, average) than using the RGB or Av-
erage fitness. However, using the average between
the two histogram differences produces higher sim-
ilarity in HSV (0.294) than only taking into account
the HSV. The maximum fitness is around 25% of sim-
ilarity with the original image since the individual is
a list of 50 circles, and therefore, only a maximum
of 50 different colors are used (while in the origi-
nal jpg image can be more than millions). See the
histogram of a generated best individual by the algo-
rithm in Figure 3. An example of evolution for each
fitness can be seen in Figure 4, 5 and 6. Comparing
TestingtheDifferencesofusingRGBandHSVHistogramsduringEvolutioninEvolutionaryArt
171
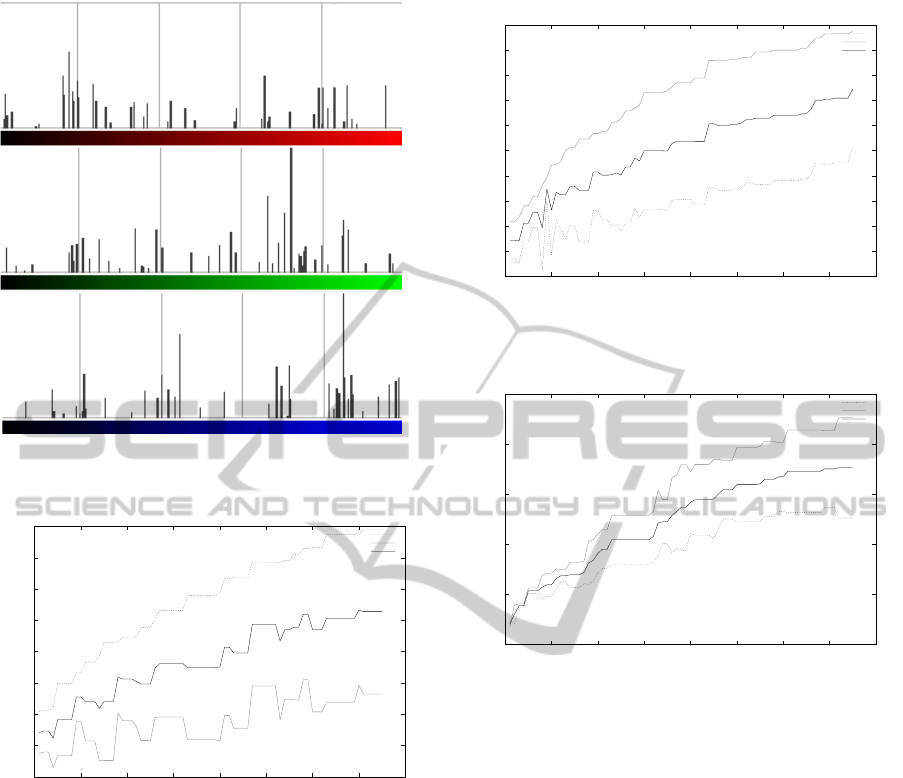
Figure 3: RGB histogram of a solution generated by the
algorithm.
0.1
0.12
0.14
0.16
0.18
0.2
0.22
0.24
0.26
0 10 20 30 40 50 60 70 80
Fitness
Generations
Using RGB Histogram Fitness
RGB
HSV
AVERAGE
Figure 4: Evolution of the difference in RGB histogram of
the best individual compared with the test image.
with the RGB histogram as fitness, a bigger fluctua-
tion in the HSV is produced (Figure 4). This can be
explained because the RGB information tends to be
more noisy than HSV information: in fact, in (Sebe
and Lew, 2000) authors explain the problems this his-
togram offers with respect to HSV in image retrieval.
Although there is the same information modeled in
both histograms, the transformation from one to an-
other is not linear, so there is no relation with the his-
tograms of individuals generated during the evolution.
The best individuals attained are shown in Figure
7. Note that, although the numeric fitness is similar,
they produce different color tones. This can be ex-
plained for the limitation of colors used in the indi-
vidual representation, as previously said, or the noisy
characteristic of the RGB histogram. Figure 8 shows
0.1
0.12
0.14
0.16
0.18
0.2
0.22
0.24
0.26
0.28
0.3
0 10 20 30 40 50 60 70 80
Fitness
Generations
Using HSV Histogram Fitness
RGB
HSV
AVERAGE
Figure 5: Evolution of the difference in HSV histogram of
the best individual compared with the test image.
0.1
0.15
0.2
0.25
0.3
0.35
0 10 20 30 40 50 60 70 80
Fitness
Generations
Using Average Histogram Fitness
RGB
HSV
AVERAGE
Figure 6: Evolution of the difference of average of RGB
and HSV histogram of the best individual compared with
the test image.
one evolution of the best individual using the HSV
fitness in the first 64 generations.
6 CONCLUSIONS AND FUTURE
WORK
This paper introduces an Evolutionary Algorithm that
uses the Processing framework to generate images
and to extract image information using HSV and RGB
histograms. In this work individuals are represented
as a list of Processing primitives (circles) and the fit-
ness functions used are based on the similarity with an
existent aesthetic image. Three different fitness func-
tions using color histogram have been tested: differ-
ence between the HSV and RGB histograms, and an
average difference of the two histograms at the same
time. Experiments show that better results in terms
of similarity are obtained using the HSV comparison
(due to the noisy information provided by the RGB).
IJCCI2013-InternationalJointConferenceonComputationalIntelligence
172
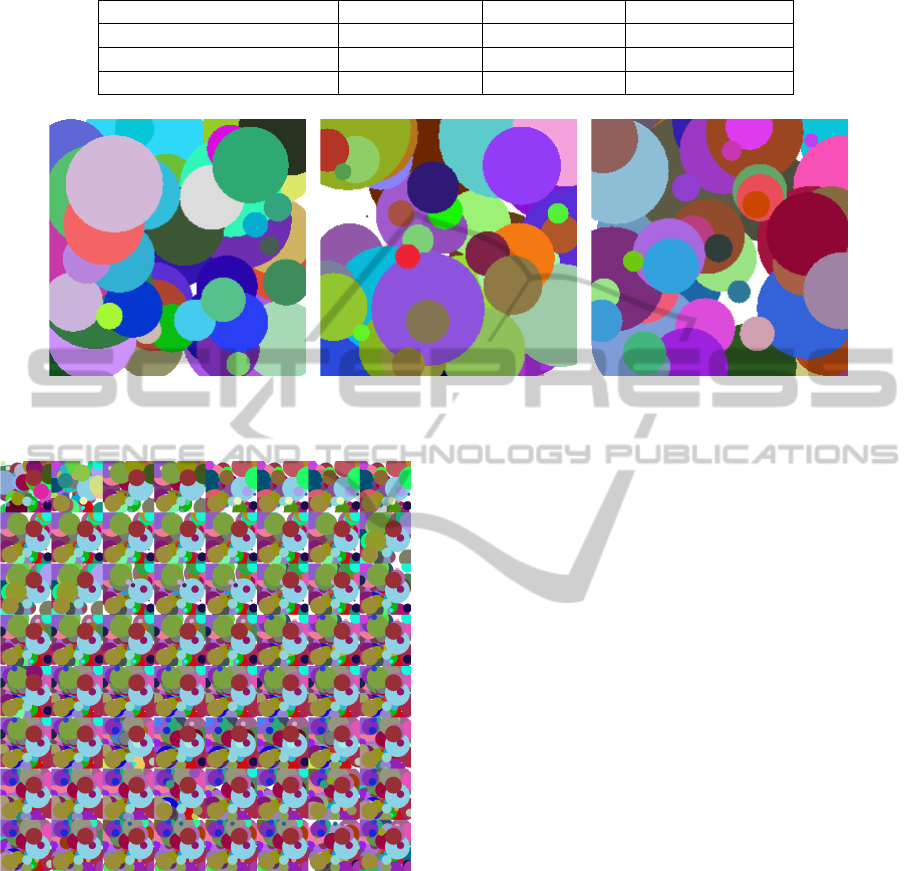
Table 2: Results for the different fitness (average of the 30 executions and standard deviation). Only one histogram type is
used for fitness calculation, but the other values obtained are also added.
Differences used in Fitness Obtained RGB Obtained HSV Obtained Average
RGB Histogram 0.267 ± 0.012 0.170 ± 0.010 0.218 ± 0.009
HSV Histogram 0.227 ± 0.017 0.265 ± 0.021 0.246 ± 0.010
Average Histogram 0.173 ± 0.012 0.294 ± 0.013 0.234 ± 0.010
(a) Best individual using RGB. (b) Best individual using HSV. (c) Best individual using AVERAGE.
Figure 7: Best individuals obtained with the three fitness used (HSV, RGB and AVERAGE).
Figure 8: Evolution of the best individual using the HSV
histogram difference.
The future work for this research also includes
more experiment with other kind of individuals,
apart from circles: using other primitives, such as
rectangles or triangles, for example. The use of tex-
tures and gradients will generate images with higher
number of colors, obtaining more fidelity (more than
25%) with the test image. Other metrics explained in
previous sections will be also implemented. Finally,
our intention is not only to create only static images,
but use the Processing libraries to create evolution-
ary interactive art combining sounds and motion.
A human guidance tool is also being developed
to obtain human feedback to create a knowl-
edge base for future experimentation (available in
http://evorq.ugr.es:8080/HumanGuidance).
The results will be gathered to create a database
of different features to guide the evolution. More
complex measurements will be studied in next works,
taking into account that the HSV is the color mode
that provides more information during the evolution,
having less noisy behaviour.
The used software and algorithms presented are
Open Source under a GPL license, and can be ob-
tained from
http://www.osgiliath.org.
ACKNOWLEDGEMENTS
This work has been supported in part by FPU
research grant AP2009-2942 and projects EvOrq
(TIC-3903), SINECA (0100DGT21285, Spanish Di-
reccion General de Trafico), TIN2011-28627-C04-
02 and FFI2011-22397 (funded by Spanish Min-
istry for Economy and Productivity). This work
was developed during the 5 Hackathon of the
Office of Open Software of the University of
Granada
http://sl.ugr.es/5hackathon,
where
several members of different disciplines collaborated
during its creation.
TestingtheDifferencesofusingRGBandHSVHistogramsduringEvolutioninEvolutionaryArt
173

REFERENCES
Aguilar, C. and Lipson, H. (2008). A robotic system for
interpreting images into painted artwork. In Proceed-
ings of the 11th Generative Art Conference (GA2008),
Politecnico di Milano University, Milan, Italy.
Ashlock, D. (2006). Evolutionary exploration of the man-
delbrot set. In Evolutionary Computation, 2006. CEC
2006. IEEE Congress on, pages 2079–2086. IEEE.
Birkhoff, G. (2003). Aesthetic Measure 1933. Harvard Uni-
versity Press.
Corne, D. W. and Bentley, P. J. (2001). Creative evolution-
ary systems. Morgan Kaufmann.
Del Acebo, E. and Sbert, M. (2005). Benford’s law for natu-
ral and synthetic images. In Computational Aesthetics
in Graphics, Visualization and Imaging, pages 169–
176. The Eurographics Association.
Den Heijer, E. and Eiben, A. (2010). Comparing aesthetic
measures for evolutionary art. Applications of Evolu-
tionary Computation, pages 311–320.
den Heijer, E. and Eiben, A. (2012). Evolving pop art using
scalable vector graphics. Evolutionary and Biologi-
cally Inspired Music, Sound, Art and Design, pages
48–59.
DiPaola, S. and Gabora, L. (2009). Incorporating charac-
teristics of human creativity into an evolutionary art
algorithm. Genetic Programming and Evolvable Ma-
chines, 10(2):97–110.
Draves, S. (2006). The electric sheep. ACM SIGEVOlution,
1(2):10–16.
Eiben, A. and Smith, J. (2005). What is an evolutionary
algorithm? In Rozenberg, G., editor, Introduction to
Evolutionary Computing, pages 15–35. Addison Wes-
ley.
Fernandes, C. M., Garc
´
ıa, A. M., Guerv
´
os, J. J. M., and
Rosa, A. C. (2012). Pherogenic drawings - generat-
ing colored 2-dimensional abstract representations of
sleep eeg with the kants algorithm. In IJCCI 2012 -
Proceedings of the 4th International Joint Conference
on Computational Intelligence, Barcelona, Spain, 5 -
7 October, 2012, pages 72–80.
Galanter, P. (2012). Computational aesthetic evaluation:
past and future. In Computers and Creativity , pages
255–293. Springer.
Garc
´
ıa-S
´
anchez, P., Gonz
´
alez, J., Castillo, P., Arenas, M.,
and Merelo-Guerv
´
os, J. (2013). Service oriented evo-
lutionary algorithms. Soft Computing, 17(6):1059–
1075.
Hoenig, F. (2005). Defining computational aesthetics. In
Proceedings of the First Eurographics conference on
Computational Aesthetics in Graphics, Visualization
and Imaging, Computational Aesthetics’05, pages
13–18, Aire-la-Ville, Switzerland, Switzerland. Euro-
graphics Association.
Li, Y., Hu, C., Chen, M., and Hu, J. (2012). Investigating
aesthetic features to model human preference in evo-
lutionary art. Evolutionary and Biologically Inspired
Music, Sound, Art and Design, pages 153–164.
Machado, P. and Cardoso, A. (1998). Computing aesthetics.
Advances in Artificial Intelligence, pages 105–119.
Moroni, A., Manzolli, J., Zuben, F. V., and Gudwin, R.
(2000). Vox populi: An interactive evolutionary sys-
tem for algorithmic music composition. Leonardo
Music Journal, pages 49–54.
Reas, C. and Fry, B. (2007). Processing: A Programming
Handbook for Visual Designers and Artists. Working
paper series (National Bureau of Economic Research).
Mit Press.
Sebe, N. and Lew, M. S. (2000). A maximum likelihood
investigation into color indexing. Proceedings Visual
Interface, pages 101–106.
Sims, K. (1991). Artificial evolution for computer graphics.
Computer Graphics, 25(4).
Sims, K. (1994). Evolving virtual creatures. In Proceedings
of the 21st annual conference on Computer graphics
and interactive techniques, pages 15–22. ACM.
IJCCI2013-InternationalJointConferenceonComputationalIntelligence
174
