
Comfort in Cars
Estimating Equivalent Temperature for Comfort Driven Heating, Ventilation
and Air Conditioning (HVAC) Control
Diana Hintea
1
, James Brusey
1
, Elena Gaura
1
, John Kemp
1
and Neil Beloe
2
1
Coventry University, Priory Lane, Coventry, CV1 5FB, U.K.
2
Jaguar Land Rover Ltd, Abbey Road, Whitley, Coventry, CV3 4LF, U.K.
Keywords:
Equivalent Temperature, Multiple Linear Regression, Thermal Comfort, HVAC.
Abstract:
Equivalent Temperature is generally considered an accurate predictor for thermal comfort in car cabins. How-
ever, direct measurement of this parameter is impractical in fielded applications. The paper presents an em-
pirical, multiple linear regression based approach for estimating body segment equivalent temperatures for car
cabin occupants from different sensors within the car. Body part equivalent temperature at eight segments and
cabin sensor data (air temperature, surface temperature, mean radiant temperature, humidity and solar load)
was gathered in a variety of environmental and cabin conditions. 38 experimental hours of trials in a con-
trolled environment and 26 experimental hours of realistic driving trials were used for training and evaluating
the estimator’s performance. The estimation errors were on average between 0.5 °C and 1.9 °C for different
body parts for trials within a controlled environment, while for trials in realistic driving scenarios they ranged
between 1 °C and 2 °C. This demonstrates that passenger body part equivalent temperature can be estimated
using a multiple linear regression from environmental sensors and leads the way to comfort driven Heating,
Ventilation and Air Conditioning control.
1 INTRODUCTION
Car buyers expect that climate control systems will
make them comfortable. In order to control comfort
and not merely climate temperature, one must first
be able to estimate it. Estimating comfort, however,
is acknowledged to be a difficult task given that the
cabin is a rapidly changing environment, non-uniform
with respect to parameters such as air temperature, air
velocity and solar load. Furthermore, current Heating,
Ventilation and Air Conditioning (HVAC) systems are
power hungry and thus not well suited to electric ve-
hicles as they may substantially reduce the vehicle’s
range.
In order to enable efficient control we need a
better understanding of the relationships between
environments and perceived comfort levels. Prior
work established that Equivalent Temperature (ET)
can be an accurate predictor for comfort (Mayer
and Schwab, 1999), (Curran et al., 2010), (Mola et
al., 2004). Dry heat loss transducers allow in-field
calculation of ET (Madsen et al., 1986), however they
are too large and costly to be used in a production car.
An alternative approach is clearly needed.
In this paper, we propose a method for estimat-
ing ET at several body locations for cabin occupants,
based on easily measured cabin variables, such as
air temperature and mean radiant temperature. The
method requires only a small number of cheap sen-
sors placed within the car and accounts for the dy-
namic nature of the cabin environment. The method
can be used to perform estimation in real-time and is
intended to lead to high performance HVAC control
systems which can be optimized for energy usage in
low carbon vehicles.
The main contributions of this paper are: 1) to
demonstrate an ET estimation method that requires
non-expensive and non-intrusive sensors, 2) optimi-
sation of the estimation method through sensor lo-
cation selection based on Mutual Information and
3) validation of the method on data gathered in a vari-
ety of conditions, from controlled trials in stable envi-
ronments to daily driving trials. Although the results
here are specific to environmental conditions found
within car cabins, the method itself is applicable to
other environments, given appropriate empirical data.
The paper is structured as follows: Section 2 re-
views related work in the area of remote estimation
507
Hintea D., Brusey J., Gaura E., Kemp J. and Beloe N..
Comfort in Cars - Estimating Equivalent Temperature for Comfort Driven Heating, Ventilation and Air Conditioning (HVAC) Control.
DOI: 10.5220/0004595205070513
In Proceedings of the 10th International Conference on Informatics in Control, Automation and Robotics (ICINCO-2013), pages 507-513
ISBN: 978-989-8565-70-9
Copyright
c
2013 SCITEPRESS (Science and Technology Publications, Lda.)

of a range of parameters. Section 3 describes the ex-
perimental data sets gathered for evaluation purposes,
while Section 4 presents the multiple linear regres-
sion ET estimation method. Section 5 presents the
results obtained through training and testing the esti-
mator. Finally, Section 6 concludes the paper.
2 RELATED WORK
Traditionally, vehicle HVAC systems control cabin
air temperature and humidity to a target set-point.
However, it has long been established that ther-
mal comfort is influenced by a variety of factors
in addition to air temperature, such as mean radi-
ant temperature, relative air velocity, relative hu-
midity, metabolic rate and clothing thermal resis-
tance (Fanger, 1973), (Gagge et al., 1967). More-
over, it is known that occupants feel comfortable over
a range of temperatures rather than at one specific
temperature (Fanger, 1973), (ANSI/ASHRAE, 2004),
(Singh et al., 2010). Estimating the level of passen-
ger comfort allows generating the exact amount of
energy needed, instead of wasting additional energy
by warming-up or cooling-down the whole cabin to
a certain set-point temperature. It can therefore be
concluded that the traditional approach is not opti-
mal with regards to ensuring comfort and energy ef-
ficiency. This indicates that in order to develop im-
proved HVAC control algorithms, there is a need to
1) sense more than just air temperature and 2) utilise
thermal comfort estimates for cabin occupants in the
control feedback loop.
ET is formally defined as the uniform tempera-
ture of the imaginary enclosure with air velocity equal
to zero in which a person will exchange the same
dry heat by radiation and convection as in the actual
non-uniform environment (SAE Journal, 2012). In-
tuitively, ET corresponds more closely to the human
sensation of environmental temperature than air tem-
perature alone. ET is an accurate predictor for ther-
mal comfort (Mayer and Schwab, 1999), (Curran et
al., 2010), (Mola et al., 2004), which integrates the ef-
fect of air temperature, mean radiant temperature and
relative air velocity. However, its direct measurement
can be intrusive, expensive and bulky. An alternative
to measuring ET is to estimate it from measurements
made at more convenient locations.
A variety of learning based models have been cre-
ated for the remote estimation of several parameters
in different environments. Mehnert et al. (2000), for
example, used a multiple linear regression to estimate
average skin temperature from parameters such as air
temperature, mean radiant temperature, air velocity,
metabolic rate, rectal temperature and partial vapour
pressure. Buller et al. (2010) developed an estima-
tor of human core body temperature using Kalman
filters, with only heart rate as input. Lee (2007) de-
veloped an artificial neural network for car cabin air
temperature prediction from 17 inputs, such as direct
sun intensity, air temperature outside the car, outside
air velocity and ventilation temperature.
Similar to the work presented in this paper, Mola
et al. (2001) developed an ET estimation model that
can be used to control the car cabin environment. A
series of trials in a controlled environment were per-
formed to identify the estimator, during which a ther-
mal manikin occupied the driver seat and measured
overall ET. The cabin air temperature, HVAC outlet
air temperature, external air temperature and mean ra-
diant temperature were also recorded. Of these mea-
sured parameters, mean radiant temperature, HVAC
outlet air temperature and air velocity were found to
allow the best estimate of ET. A linear mathemati-
cal expression was inferred for estimating ET. The
method was only assessed qualitatively and it was
concluded to successfully drive HVAC control. A
downside of this method is the fact that only one sen-
sor was used to measure the cabin temperature, while
different air temperature sensor locations within the
cabin can increase the estimator’s accuracy (Hintea et
al., 2011). Moreover, the data used for training and
testing the system came from controlled trials, leav-
ing open the question of how well it would perform in
realistic driving scenarios.
There are several gaps in the state of the art that
this paper tries to fill: 1) using a large number of sen-
sors for data gathering as this enables optimisation of
sensor location (Hintea et al., 2011) and leads to a
more efficient estimator, 2) validating the estimator
on data gathered in a variety of conditions, not only
in stable, controlled environments and 3) quantifying
the ET estimation error for multiple occupant body
parts, rather than overall.
3 EXPERIMENTAL DATA
GATHERING
The training and testing of the algorithm implemented
here was based on experimentally gathered car cabin
data within a variety of conditions. Throughout all
113 trials, ET was monitored at eight locations (cor-
responding to head, chest, left lower arm, right lower
arm, left upper arm, right upper arm, thigh and calf)
using the INNOVA Flatman thermal manikin, shown
in Figure 1 (right), positioned in the front passenger
seat of the test car. Cabin air and surface tempera-
ICINCO2013-10thInternationalConferenceonInformaticsinControl,AutomationandRobotics
508

Figure 1: Experimental data gathering. Left: Mean radi-
ant temperature sensor. Right: Upper body of the Flatman
thermal manikin.
ture data was gathered using type K thermocouples
and was recorded by a Grant Instruments DataTaker
DT85 data logger.
Surface temperature was collected at the follow-
ing locations: left and right instrumentation panel,
steering wheel, front row passenger seat back and seat
cushion, back row left seat back and seat cushion,
left and right windscreen, front row left and right side
glazing and back row left side glazing. Air tempera-
ture was collected at the following locations: external
temperature, front row left and right headrest, front
row belt, front row left and right foot, back row left
and right headrest, back row belt, back row left and
right foot. HVAC vent discharge temperature was col-
lected at the following locations: front row left inner
face vent, front row left out face vent, back row left
face vent. A total of seven subjects (four males and
three females) occupied the driver seat in turn and an
observer occupied the rear right seat.
Four types of trials were performed corresponding
to two main categories, as described in Sections 3.1
and 3.2.
3.1 Controlled Environment Trials
The trials described in Sections 3.1.1 and 3.1.2 in-
volve controlling the external environment (solar
load, ambient temperature, wind) while varying the
HVAC control.
3.1.1 Variable Cabin Temperatures within
Steady state external conditions (T1)
These trials were performedwithin an enclosed space,
characterized by stable ambient air temperature. Both
the subjects and the test car cabin were precondi-
tioned to 22 °C. At the outset of the experiment the
subject entered the car and remained in static con-
ditions (same HVAC set-point) for 10 minutes. The
temperature was then increased by 1 °C every 3 min-
utes until it reached 28 °C. The same trial was per-
formed with the HVAC set-point decreased by 1 °C
every 3 minutes until it reached 16 °C. The air flow
from the HVAC system was set to high or medium
settings and trials with and without simulated solar
loading on the driver side of the car were performed.
The conditions are characterized by interior tempera-
ture rates of change less than 1.5 °C per minute, sta-
ble outside temperature (less than 1 °C difference per
trial) and no wind or precipitation.
3.1.2 User control within Steady State External
Conditions (T2)
These trials were performedwithin an enclosed space,
characterized by stable ambient air temperature. The
car cabin and the subjects were preconditioned to a
neutral (22 °C), hot (28 °C), or cold (16 °C) tempera-
ture. The subjects entered the car and remained inside
for 15 minutes, during which they were permitted to
adjust the air conditioning at will in order to make
themselves more comfortable. These trials were per-
formed both with and without simulated solar loading
on the driver side of the car. Higher car cabin interior
temperature rates of change were encountered (up to
7 °C per minute) with stable outside temperature (less
than 1 °C difference per trial) and no wind or precipi-
tation.
3.2 Realistic Driving Trials
The trials described in Sections 3.2.1 and 3.2.2 were
aimed at providing realistic driving scenarios within
both short and long trips. They involve no control
over the external environment (solar load, ambient
temperature, wind) while varying the HVAC control.
3.2.1 User Control during Driving within Short
Trips (T3)
These trials consisted of subjects driving the test car
on private roads. The car and the subjects were pre-
conditioned to a neutral (22 °C), hot (28 °C), or cold
(16 °C) temperature. The subjects entered the car and
drove for 15 minutes, during which they were per-
mitted to adjust the air conditioning at will in order
to make themselves more comfortable. The subjects
were required to turn and change speed at frequent
intervals in order to simulate to an extent the daily
driving routine. These trials were characterized by
interior temperature rates of change of up to 6 °C per
minute and less stable outside temperature (up to 3 °C
difference per trial), alone with ambient wind, solar
load and precipitation.
ComfortinCars-EstimatingEquivalentTemperatureforComfortDrivenHeating,VentilationandAirConditioning
(HVAC)Control
509

3.2.2 Automatic and User Control during
Driving within Long Trips (T4)
These trials consisted of a five day road-trip through-
out the UK in a test vehicle. On each day there were
four trials, lasting around 2 hours each and differenti-
ated by the HVAC control mode: automatic mode at
20 °C, automatic mode at 22 °C, automatic mode at
24 °C and manual mode. The car cabin instrumen-
tation consisted of the sensors used for the previous
three types of trials and an additional set of sensors:
mean radiant temperature collected at a center ceiling
location, shown in Figure 1 (left); solar load, collected
at locations corresponding to dashboard left and right
and at the car centre; air temperature, collected at
locations corresponding to dashboard left and right.
The experimental conditions encountered are charac-
terized by interior temperature rates of change of up
to 5 °C per minute and external temperature differ-
ences up to 5 °C per trial, along with ambient wind,
solar load and precipitation.
Experiment types will be referred in the paper by
the T1, T2, T3 and T4 abbreviations.
4 EQUIVALENT TEMPERATURE
ESTIMATION METHOD
Figure 2: Equivalent temperature estimation method train-
ing and validation.
This section describes the method developed to esti-
mate ET at different body part locations from one or
more sensors located within the cabin (shown in Fig-
ure 2). The first step of the method consists of data
gathering (described in detail in Section 3). Build-
ing an accurate ET estimation model also relies on
the selection of an appropriate set of sensors within
the car cabin. Here the sensors are selected through a
Mutual Information (MI) based method (described in
more detail in Hintea et al., 2011).
Given n sensors within the cabin, S
1
, S
2
, ..., S
n
, and
T
eq
the ET to be estimated, the MI between them,
I(T
eq
;S
1
, ..., S
n
), can be written as:
I(T
eq
;S
1
, ..., S
n
) = H(T
eq
) − H(T
eq
|S
1
, ..., S
n
).
The conditional entropy H(T
eq
|S
1
, ..., S
n
) can be
computed as following:
H(T
eq
|S
1
, ..., S
n
) = H(T
eq
, S
1
, ..., S
n
) − H(S
1
, ..., S
n
),
where H(T
eq
, S
1
, ..., S
n
) is the joint entropy for the
n+ 1 sensors, while H(S
1
, ..., S
n
) is the joint entropy
for the n sensors used for the estimation.
Finally, MI can be defined as:
I(T
eq
;S
1
, ..., S
n
) =
H(T
eq
) + H(S
1
, ..., S
n
) − H(T
eq
, S
1
, ..., S
n
)
The group of m sensors (m = 2 within this paper)
that shares the highest MI with the ET over all body
parts is selected by maximising the MI over the eight
body parts. It should be noted that the sensor locations
selected may vary from one vehicle to another.
Multiple Linear Regression (MLR, Draper and
Smith, 1981) lies at the core of the ET estimator. The
MLR model suitable for this application can be writ-
ten as:
T
eq
= α
0
+ α
1
S
1
+ α
2
S
2
+ ... +α
m
S
m
, where T
eq
is
the body part ET being estimated, α
0
, ..., α
m
are the
regression coefficients and S
1
, ..., S
m
are the sensors
previously selected. Training data gathered from the
experimental trials described in Section 3 is used to
compute the regression coefficients. Due to using
k-fold cross validation to evaluate the performance
of the estimator, training was performed on k-1 data
chunks of the input data set, while testing was per-
formed on the remaining data chunk. This model can
be used in a deployed system by continuously esti-
mating the T
eq
values from real-time measured sensor
values S
1
, ..., S
m
.
Several other estimation methods have been ap-
plied, such as Multilayer Perceptron (Haykin, 1998),
REPTree (Witten and Frank, 2005), K-Nearest Neigh-
bour (Cover and Hart, 1967), Multivariate Adaptive
Regression Splines (Friedman, 1991), Radial Basis
Function network (Haykin, 1998) and Random For-
est (Breiman, 2001). MLR was the third in terms of
accuracy, after the Multilayer Perceptron and Multi-
variate Adaptive Regression Splines methods, how-
ever, MLR outperformed the latter in terms of model-
ing and processing time, while the extra small gain in
accuracy is not of significant impact (a lower average
error of 0.10 °C on a 5 °C to 35 °C range) .
ICINCO2013-10thInternationalConferenceonInformaticsinControl,AutomationandRobotics
510
5 EVALUATION
OF THE METHOD
ON EXPERIMENTAL DATA
K-fold cross validation was used to evaluate the es-
timator’s performance, both on the full set of experi-
mental data and on separate sets of trials in order to
observe the best/worst scenario, indicating how well
the algorithm generalizes to unseen data. The outputs
of the estimator were compared to the original mea-
sured ET and the Root Mean Square Error (RMSE)
was used as an accuracy measure.
5.1 Controlled Environment Trials
The MI sensor selection procedure was performed to
determine the pair of sensors giving the lowest ET es-
timation errors over all body parts for trial sets T1 and
T2. The sensors selected were the surface temperature
sensor located at the back row left seat back and the
air temperature sensor located at the back row right
headrest level.
As Table 1 shows, the lowest estimation errors
were obtained for the trial set T1, ranging from 0.5 °C
for the thigh to 1.3 °C for the head, averaging 1 °C
over all eight body parts. The estimation errors were
higher for the trial set T2, averaging 1.5 °C and rang-
ing from 1.3 °C for the chest to 1.9 °C for the up-
per arm. The higher error for the latter could be due
to significantly higher car cabin temperature rates of
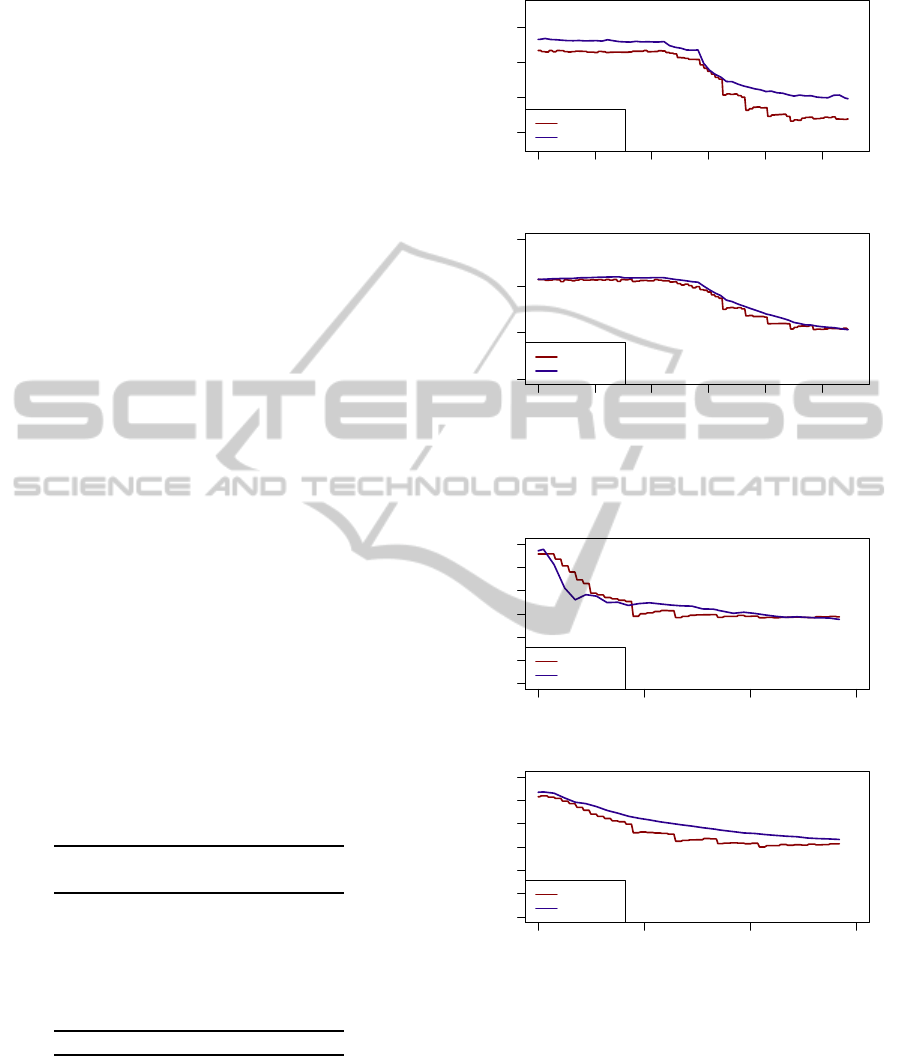
change (up to 7 °C per minute). Figures 3 and 4
show the measured versus estimated ET at the head
and thigh level within one trial of T1 and T2 (starting
from 28 °C and with the HVAC flow set on medium).
Table 1: Equivalent temperature estimation results (RMSE)
from the best two sensors in trials T1 and T2.
Equivalent Trial type
temperature T1 T2
head 1.33 °C 1.71 °C
chest 0.95 °C 1.38 °C
lower arm 1.05 °C 1.59 °C
upper arm 0.96 °C 1.92 °C
thigh 0.53 °C 1.51 °C
calf 1.28 °C 1.44 °C
average 1.02 °C 1.59 °C
5.2 Realistic Driving Trials
The pair of sensors corresponding to the lowest esti-
mation errors for trial set T3 was the same as for T1
and T2. However, as Table 2 shows, the estimation er-
rors were higher than for the previous types of trials,
0 5 10 15 20 25
10 15 20 25
Time(minutes)
Head Equivalent Temp. (°C)
Measured
Estimated
0 5 10 15 20 25
15 20 25 30
Time(minutes)
Thigh Equivalent Temp. (°C)
Measured
Estimated
Figure 3: Estimated versus measured equivalent tempera-
ture at the head and thigh level during one trial of T1.
0 5 10 15
10 20 30 40
Time(minutes)
Head Equivalent Temp. (°C)
Measured
Estimated
0 5 10 15
10 20 30 40
Time(minutes)
Thigh Equivalent Temp. (°C)
Measured
Estimated
Figure 4: Estimated versus measured equivalent tempera-
ture at the head and thigh level during one trial of T2.
averaging 1.9 °C over all body parts and ranging from
1.4 °C for the calf to 2.5 °C for the head. The rea-
sons for this could be the high car cabin temperature
rates of change (up to 6 °C per minute) and variable
external conditions, such as solar load, precipitation
and air temperature.
Among other parameters, ET integrates the effect
ComfortinCars-EstimatingEquivalentTemperatureforComfortDrivenHeating,VentilationandAirConditioning
(HVAC)Control
511
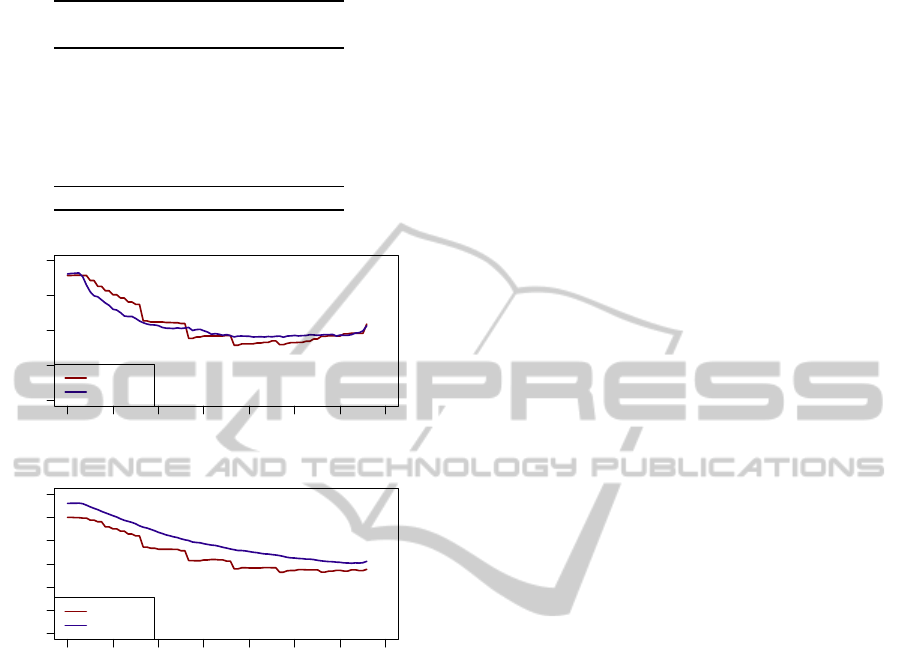
Table 2: Equivalent temperature estimation results (RMSE)
from the best two sensors in trials T3 and T4.
Equivalent Trial type
temperature T3 T4
head 2.5 °C 1.44 °C
chest 1.63 °C 1.42 °C
lower arm 2.32 °C 1.29 °C
upper arm 2.01 °C 1.37 °C
thigh 1.63 °C 1.06 °C
calf 1.47 °C 2.08 °C
average 1.93 °C 1.44 °C
0 2 4 6 8 10 12 14
0 10 20 30 40
Time(minutes)
Head Equivalent Temp. (°C)
Measured
Estimated
0 2 4 6 8 10 12 14
10 20 30 40
Time(minutes)
Thigh Equivalent Temp. (°C)
Measured
Estimated
Figure 5: Estimated versus measured equivalent tempera-
ture at the head and thigh level during one trial of T3.
of mean radiant temperature. The latter was measured
within trial set T4 and was found to relate best to ET.
The pair of sensors giving the lowest estimation errors
were the mean radiant temperature sensor and the air
temperature sensor located at the front row right belt
level. The estimation errors for T4 were lower than
for T3, most likely due to using the mean radiant tem-
perature as an estimation source. They average 1.4 °C
over all body parts, with a minimum error of 1 °C for
the thigh and a maximum error of 2 °C for the calf.
Interesting to note is that throughout most experiment
types the body parts directly exposed to the vent air
flows (head, calf and arms) were estimated with the
largest error. Figure 5 show the measured versus esti-
mated ET at the head and thigh level within one trial
of T3 (starting from 28 °C and with the HVAC flow
set on medium).
Nilsson et al. (1999) conducted empirical trials to
find the ET ranges for 16 body parts that would cor-
respond to thermal comfort. They found that both in
winter and summer conditions, the comfortable range
for each of the body parts was covering up to 7 °C (for
example, for the head the comfortable range was be-
tween 18 °C to 25 °C in the winter and between 20 °C
to 26 °C in the summer), therefore the maximum 2 °C
error introduced by the estimation method here ap-
pears to be low enough to deliver sufficient accuracy
for HVAC control.
6 CONCLUSIONS
A multiple linear regression model that estimates
equivalent temperature at several body parts of the
occupant has been derived. When applying k-fold
cross validation on trials in a controlled environment,
equivalent temperature is predicted with average er-
rors between 0.5 °C and 1.9 °C for various body parts
while using only two sensors as input previously se-
lected. On the trials in realistic driving scenarios er-
rors between 1 °C and 2 °C were achieved. The equiv-
alent temperature estimation method provides suffi-
cient accuracy for controlling the HVAC system.
Since equivalent temperature integrates the effect
of air flow, in future work we will examine the latter’s
impact on the estimation error and find optimal air
flow sensor locations.
ACKNOWLEDGEMENTS
This work followson from initial experimentationand
development performed as part of the Low Carbon
Vehicle Technology Project (LCVTP). The LCVTP
was a collaborative research project between leading
automotive companies and research partners, revolu-
tionising the way vehicles are powered and manu-
factured. The project partners included Jaguar Land
Rover, Tata Motors European Technical Centre, Ri-
cardo, MIRA LTD., Zytek, WMG and Coventry Uni-
versity. The project included 15 automotive technol-
ogy development work-streams that will deliver tech-
nological and socio-economic outputs that will bene-
fit the West Midlands Region. The 19 million project
was funded by Advantage West Midlands (AWM) and
the European Regional Development Fund (ERDF).
The authors would like to thank the anonymous
reviewers for their insightful comments.
ICINCO2013-10thInternationalConferenceonInformaticsinControl,AutomationandRobotics
512

REFERENCES
ANSI/ASHRAE (2004). Thermal environmental conditions
for human occupancy. Technical Report 55-2010,
American Society of Heating, Refrigerating and Air-
conditioning Engineers.
Breiman, L. (2001). Random forests. Machine Learning,
45:5–32.
Buller, M., Tharion, W., Hoyt, R., and Jenkins, O. (2010).
Estimation of human internal temperature from wear-
able physiological sensors. In Proc. of the 22nd Conf.
on Innovative Applications of Artificial Intelligence
(IAAI). AAAI Press.
Cover, T. and Hart, P. (1967). Nearest neighbor pattern clas-
sification. IEEE Transactions on Information Theory,
13:21–27.
Curran, A., Peck, S., Schwenn, T., and Hepokoski, M.
(2010). Improving cabin thermal comfort by control-
ling equivalent temperature. SAE International Jour-
nal Aerospace, 2:263–267.
Draper, N. and Smith, H. (1981). Applied Regression Anal-
ysis. Wiley.
Fanger, P. O. (1973). Assessment of man’s thermal comfort
in practice. British Journal of Industrial Medicine,
30:313–324.
Friedman, J. H. (1991). Multivariate adaptive regression
splines. Annals of Statistics, 19:1–67.
Gagge, A., Stolwijk, J., and Hardy, J. (1967). Comfort
and thermal sensations and associated physiological
responses at various ambient temperatures. Environ-
mental Research, 1:1–20.
Haykin, S. (1998). Neural Networks: A Comprehensive
Foundation. Prentice Hall.
Hintea, D., Brusey, J., Gaura, E., Beloe, N., and Bridge, D.
(2011). Mutual information-based sensor positioning
for car cabin comfort control. In Proceedings of the
15th KES International Conference, KES’11, pages
483–492. Springer.
Lee, T. Y. (2007). Prediction of car cabin temperature using
artificial neural network. Master’s thesis, Technische
Universitat Munchen.
Madsen, T., Olesen, B., and Reid, K. (1986). New methods
for evaluation of the thermal environment in automo-
tive vehicles. Report.
Mayer, E. and Schwab, R. (1999). Correlation between ther-
mal response and equivalent temperature. In CABCLI
Consortium, pages 63–70. ISSN 1401-4963.
Mehnert, P., Malchaire, J., Kampmann, B., Piette, A.,
Griefahn, B., and Gebhardt, H. (2000). Prediction of
the average skin temperature in warm and hot envi-
ronments. European Journal of Applied Physiology,
82:52–60.
Mola, S., Magini, M., and Malvicino, C. (2001). Equivalent
temperature estimator using mean radiant temperature
sensor. Measurement and Control, 34:167–169.
Mola, S., Presti, G. L., Ardusso, R., Malvicino, C., Zussino,
A., and Caviasso, G. (2004). Measuring customer per-
ceived thermal comfort in car cabin compartment: In-
dex of perceived thermal comfort. In FISITA World
Automotive Congress. STA.
Nilsson, H., Holmer, I., Bohm, M., and Noren, O. (1999).
Equivalent temperature and thermal sensation - com-
parison with subjective responses. In Comfort in the
Automotive Industry, Bologna, ATA, pages 157–162.
SAE Journal (2012). Equivalent temperature: Truck and
bus. Technical report, SAE International.
Singh, M., Mahapatra, S., and Atreya, S. (2010). Ther-
mal performance study and evaluation of comfort tem-
peratures in vernacular buildings of north-east India.
Building and Environment, 45:320–329.
Witten, I. and Frank, E. (2005). Data Mining: Practi-
cal Machine Learning Tools and Techniques. Morgan
Kaufmann.
ComfortinCars-EstimatingEquivalentTemperatureforComfortDrivenHeating,VentilationandAirConditioning
(HVAC)Control
513
