
Simulation Modeling of Maritime Piracy using Discrete Event
and Agent-Based Approaches
A. Emre Varol
1
and Murat M. Gunal
2
1
Decision Support Dept., Turkish Naval Command, Ankara, Turkiye
2
Industrial Engineering Dept., Turkish Naval Academy, Istanbul, Turkiye
Keywords: Maritime Piracy, Discrete Event, Agent based, Hybrid, Simulation.
Abstract: In the last decade, maritime piracy has affected the global economy that forced the countries to react. Most
of the reaction is regarding force deployment in the affected regions. In this study, we present a simulation
based analysis tool that aims at understanding the relationship between naval forces deployment and
preventing piracy. We consider three stakeholders’ views; pirates, maritime transportation, and naval forces.
We initially created a classical Discrete Event Simulation (DES) model and adopted event scheduling
approach. However, later, we discovered that since the behaviours of entities, interaction between entities,
and the autonomy properties of entities are significant, Agent Based Simulation (ABS) concepts are
appropriate for modeling. Finally, we ended up with a hybrid DES and ABS model. Our conceptual model
is created using event graphs and the model is implemented using SharpSim DES library. Additionally, we
coupled an open source Geographic Information System (GIS), GreatMap, with SharpSim.
1 INTRODUCTION
Continuing impact of piracy and armed robbery at
sea remains a significant concern to the international
community, nations, non-governmental and
commercial organizations. Over 90 percent of the
world’s trade is carried via maritime transportation
(International Maritime Organization, 2011) and as a
consequence, anything that restrains or imperils the
free transit of vessels in the maritime domain can
have serious social, economic and security
implications. In fact, the major concern is economics
related since maritime piracy is estimated to be
costing to the international economy between $7 to
$12 billion per year (One Earth Future Foundation
2010). The cost incurred is related to ransoms,
insurance premiums, rerouting ships, protection
forces, security equipments, piracy deterrence
organizations, and effects to the regional economies.
Although maritime security has been a major
concern internationally, interestingly, Operational
Research/Management Science (OR/MS)
community had very little involvement at this
problem domain. Jakob et al. (2011a and 2011b) is
an exception since they applied Agent Based
Modelling and Simulation (ABMS) concepts into
maritime security and a simulation tool, AgentC, has
been developed. Although OR/MS toolbox includes
many other methods and tools that can be applied to
help create solutions, the distinction of this problem
domain is that maritime piracy is a matter of
“behaviour”. According to the IMB (International
Maritime Bureau), piracy is “An act of boarding or
attempting to board any ship with the apparent intent
to commit theft or any other crime and with the
apparent intent or capability to use force in the
furtherance of that act”. We believe that this
definition suggests that an OR/MS modeller must
focus on finding ways of modelling behaviours of
pirates, as well as the protection against piracy.
The main motivation of this study is to exploit
modelling and simulation to support decision
making for maritime security issues and the efforts
to protect maritime transportation. We evaluated that
an ABS model would depict the behavioural
complexities in this problem domain and, as a tool,
would also help decision makers understand the
relationship between parties involved. In the next
section, we review ABS briefly and then present our
methodology for this particular study. Rest of the
paper is dedicated to the details of our modelling
work. First, we present Maritime Security
Operations Library (MSOLib), secondly we give
some information about the simulation model we
438
Emre Varol A. and M. Gunal M..
Simulation Modeling of Maritime Piracy using Discrete Event and Agent-Based Approaches.
DOI: 10.5220/0004431004380445
In Proceedings of the 3rd International Conference on Simulation and Modeling Methodologies, Technologies and Applications (SIMULTECH-2013),
pages 438-445
ISBN: 978-989-8565-69-3
Copyright
c
2013 SCITEPRESS (Science and Technology Publications, Lda.)

developed. Thirdly, geographical information
system part of our study is presented. We
additionally give experimental results to draw some
conclusions.
2 BACKGROUND
INFORMATION
2.1 Agent Based Simulation
Agent-based modelling and simulation (ABMS) is a
simulation approach that models the overall
behaviour of a system through use of autonomous
system components (called agents) that
communicate with each other. ABMS continues to
be a rising value of simulation domain for the reason
that the main advantage of ABMS is its potential to
exhibit the system combined behaviour while just
modelling individual agent behaviour.
Siebers et.al (2010) asserts that ABMS enables
people to model their real-world systems in ways
that either not possible or not readily adapted using
traditional modeling techniques. Macal and North
(2010) is a classical ABMS tutorial and they suggest
that an ABS model have three elements: agents,
environment, relation between agents and method of
interaction. An agent independently lives in an
environment, interacts with its environment as well
as with other agents according to its behaviors and
experiences in accordance with local information.
Bonabeau (2002) puts forward that agent-based
modeling has seen a number of applications,
especially in real world business. ABMS
applications are not only in business, but also they
are widely being applied to spanning human social,
physical, healthcare and biological systems. When
we update the review, we see that in the last decade
the number of papers increased, as well as the
domains applied, such as marketing (Siebers et al.,
2007), (Filatova et al., 2009), (North et al., 2010),
agriculture (Bert et al., 2010), air traffic control
(Conway, 2006), biology and health (Emonet et al.,
2005), (Davilia and An, 2010), (Kurahashi and An,
2010), (Tang et al., 2011), and military (Moffat et
al., 2006), (Hill et al., 2006).
2.2 The Framework of this Study
In our study, we coupled three separate systems to
create a tool for evaluating maritime security opera-
tions, as shown in Figure 1. The first part is a class
library, Maritime Security Operations Library
(MSOLib), to maintain the data structures and
provide a backbone for the study. The second part is
the simulation model. We used SharpSim (Ceylan
and Gunal, 2011) DES engine to create an ABS
model. To do this, we built Event Graphs for
modeling behaviors of every class of simulated
units, such as pirates, fishing boats, cargo ships,
naval and air units. Finally, to display information
and animate the entities (agents) on a map, we
created an interface by using GMap.Net (GreatMap,
2011) GIS package.
3 MARITIME SECURITY
OPERATIONS LIBRARY
Maritime Security Operations Library (MSOLib) is
a dynamic link library which maintains basic
maritime contact objects, motion types, detection
tools and navigation tools required to simulate a
maritime security operation. It is created to work
with a simulation library and to maintain objects and
data structures. MSOLib hosts;
• Contact,
• Motion,
• Area,
• Sensor,
• Navigation classes.
We implement MSOLib by using C# and it provides
full support for object-oriented programming. It
works harmoniously with SharpSim and GMap.Net.
Contact class in MSOLib inherits from SharpSim
Entity class. A contact instance is an agent in the
simulation and its behavior is determined by event
graphs as discussed in the next section. There are
three main Contact types: Surface Contact, Air
Contact and SubSurface Contact.
Motion class is the base class for all motion
related activities. There are four motion types and all
inherits from basic linear motion. We used Dead
Reckoning (DR), Latitude Sailing and Longitude
Sailing methods for the linear motion of any
maritime vessel at sea. DR is the process of
estimating present position by projecting course and
speed from a known past position (Bowditch 2002).
It is also used to predict a future position by
projecting course and speed from a known present
position. The DR position is only an approximate
position because it does not allow for the effect of
leeway, current, helmsman error or gyro error. We
neglected these effects and errors. Latitude and
longitude sailing methods also use DR sailing when
a maritime vessel sail on respectively on latitude and
longitude.
SimulationModelingofMaritimePiracyusingDiscreteEventandAgent-BasedApproaches
439
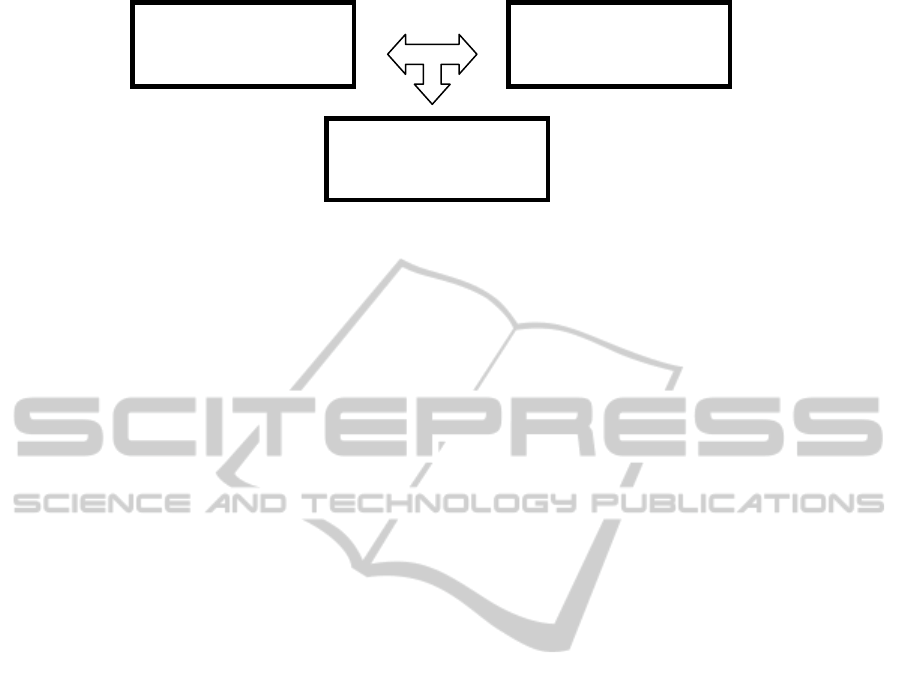
Figure 1: Main component of the analysis tool.
Traverse motion is the motion of the ship between
two positions. It moves back and forth between these
two positions at specified times. When the contact
hits the waypoint, it alters its route to opposite
toward to the other waypoint. In random motion, the
Contact creates random waypoints in a directed area
and when hits the waypoint, it alters its course
towards to the next waypoint until it reaches the end
point. Path motion works like Random Motion
however the waypoints are predetermined by the
user.
Area class is required to maintain the agents in
an area. It is essentially the environment in the ABS
model. Each operation region composed of several
number of areas. Each area has its own color,
identifier, name, list of points on an operation map
and at command and control headquarter.
Geometrically, area is a polygon that is declared and
specified by naval forces.
Sensor class indicates detector component of the
contact. Sensor behaves like a radar system and use
IsInsideTheRange method to sweep the environment
in sensor range to seek and detect the target. The
target’s information is provided to the seeker. For
example, if a pirate agent attacks a cargo ship, it
tries to make a decision according to their freeboard
and physical condition by using this sensor. In the
sensor class, we used the basic cookie-cutter sensor
concept suggested by Buss and Sanchez (2005). This
concept assumes that when an entity enters the range
of the sensor, a detection occurs.
Navigation classes include necessary utilities for
navigational calculations.
4 SharpSim SIMULATION
MODEL
SharpSim is a general purposed DES library written
in C# to implement models developed with Event
Scheduling (ES) approach (Ceylan and Gunal 2011).
SharpSim is an open-source code library
(http://sharpsim.codeplex.com) and was used in
other domains before (Ceylan, Gunal, and Bruzzone
2012).
Since in this study we aimed at building an ABS
model, we created Event Graphs (EG) to reflect the
behaviors of agents. Once EGs are built, it is easy to
convert them to a SharpSim model. Using EGs
approach reveals the thin line between DES and
ABS, or the power of EGs as a conceptual modeling
method.
Our conceptual model (Event Graph) has more
than 50 events and it is not possible to demonstrate
the whole, an excerpt is given in Figure 2. This EG
is a part of navy patrol ship model and is described
in the following section.
At the beginning of the simulation, a Run event
is scheduled to the future event list which triggers
the Ping, Convoy, Group, and all agent creator
events for aircraft, fishing boats, cargo ships, patrol
navy ships, and convoy (escort) navy ships. Ping
event is the basic animation event which essentially
acts as a screen refresher event. It updates all agents’
positions on the map. This approach was used by
Mack (2000).
4.1 Aircraft Model
An aircraft agent starts its motion and turns on its
sensor to detect and identify the contacts in its
environment. If the agent identifies a pirate vessel it
shares this information with naval forces. Aircrafts
use path motion in a patrol area. After patrolling,
each aircraft returns its home base. The “sweep and
detect (SWandDET)” and “Dispatcher” events are
circular events which simulates periodical detection
efforts. For example, if the patrolling aircraft detects
a pirate vessel, the dispatcher event schedules a new
SWandDET event, allow SWandDET event to loop
itself, and also schedules update pirate list event.
When aircraft finishes patrolling and return its home
base, it cancels next SWandDET event by using the
Maritime Security
Operations Library
(MSOLib)
Simulation
Model
(SharpSim)
Geographical
Information System
(GMap.Net©)
SIMULTECH2013-3rdInternationalConferenceonSimulationandModelingMethodologies,Technologiesand
Applications
440
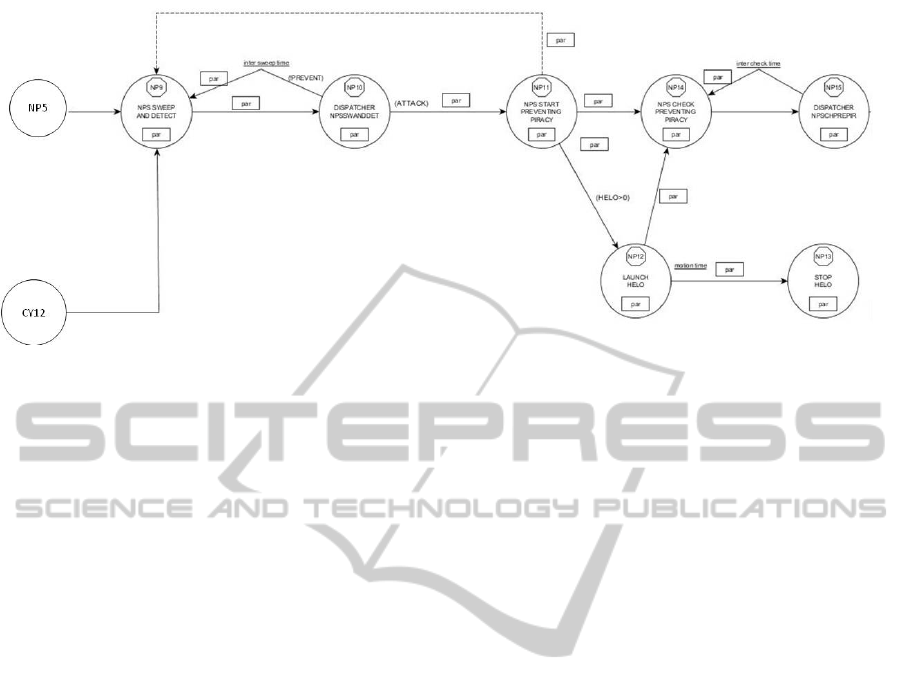
Figure 2: An example of an Event Graph for Navy Patrol Ship.
cancelling edge in the event graph. This edge deletes
first SWandDET event from Future Event List
(FEL) to turn off its sensor.
4.2 Fishing/Pirate Ship Model
Number of fishing boats and their origin ports are
defined by the user. When a fishing ship arrival
occurs, next fishing ship arrival event is scheduled
after a delay (interarrival time of fishing ship). A
fishing boat may also be a pirate ship if certain
conditions are met. For example, if a fishing boat’s
freeboard is low and its speed is high, it is likely that
this boat is a pirate boat rather than a fishing boat.
Piracy events start with proceeding to cargo ship
transit corridor. When the pirate starts to proceed to
transit corridor it turns on its sensor (human vision
with binoculars) to detect any vulnerable cargo ship
to capture and any naval forces to conceal and
protect itself. After each SWandDET event, pirate
considers next step of the strategy at the dispatcher
event. If pirate ship detects any ship, it tries to
classify and identify the contact. After this process,
if pirate ship detects any vulnerable ship, it updates
its attackable ships list and makes a decision to
select a target based on the targets’ freeboard,
distance, and proximity to any naval forces. It
selects the most vulnerable cargo ship (target) by
taking into account of these three elements and
calculates a risk factor. According to the risk factor
it makes a decision to attack. For example, if there is
a naval helicopter in the close perimeter, pirate does
not decide to attack since helicopter movement agile
and nimble, it can easily neutralize the pirate vessel.
Pirate starts fishing after decision of “do not attack”.
On the other hand, it starts to attack the target until
pirate captures it for ransom or is neutralized by the
naval forces. Unfortunately, if it captures the target,
pirate achieved its own mission and successful pirate
attack statistics are updated. If it is neutralized by
the naval forces, failed pirate attack number and
successful naval protection number is incremented.
At the time of pirate attacking, a pirate checks its
own condition (neutralized or not) and decides to
continue the attack or changes its own condition to
neutralized and deletes itself from the simulation.
4.3 Cargo Ship Model
Cargo ships’ behavior is simple since a cargo ship
starts to proceed to the waiting area of the transit
corridor. Cargo ship motion on the transit corridor is
supervised by the convoy and group scheduled
events.
4.4 Navy Ship Model
Naval ships have two tasks; patrolling in a specified
area and escorting cargo ships for secure transit in
the corridor. We refer Naval Patrol Ship (NPS) in
charge of patrolling and Naval Convoy Ship (NCS)
for escorting. As in the other agents, NPS and NCS
have also sensors to sweep and detect (SWandDET)
the environments. After each SWandDET event,
NPS considers next action at the dispatcher event.
When SWandDET event occurs, NPS does not only
sweep and try to detect all over its environment in
distance of sensor range but also checks cargo ships’
alert state. If it detects any piracy act or any alert
state about piracy from cargo ship, it starts to
prevent piracy. First, if its helicopter is airborne, it
gives orders to the helicopter to quit surveillance and
approach to pirate ship. If its helicopter is not
airborne, it takes off immediately and proceeds to
SimulationModelingofMaritimePiracyusingDiscreteEventandAgent-BasedApproaches
441

the pirate ship. Meanwhile the NPS approaches to
the target. After the operation, if it fails to prevent
piracy, NPS ship reports the result to headquarter
and starts to chase the pirate ship. In this case the
cargo ship is taken to the captivity region by the
pirate. On the other hand, if the operation is
successful, NPS neutralizes pirate ship and resumes
its patrolling duty and makes a decision for
helicopter to land or continue to surveillance. When
an NCS arrival occurs, next arrival event is
scheduled after a delay (interarrival time of NCS).
After each arrival, arriving ship proceeds to waiting
area of transit corridor and NCS motion on transit
corridor is supervised by convoy scheduled event
which will be detailed later
4.5 Convoy and Group Model
There are two transit sailing policy at internationally
secured corridors; group transit and convoy transit.
The main difference between these two transits is
that convoy transit has a naval ship in the group to
escort ships, whereas a group transit does not. The
aim is to form ships into groups that sail through the
secured corridor together. For each group, there is a
schedule with entry time and a group speed to
bundle ships together. Participation to these groups
is neither an obligation nor compulsory. This
binding operation is crucial for establishing the
security and controlling the transit corridor.
Convoy and group events are time scheduled
events. A convoy event has a naval ship which
escorts cargo ships to protect them. If the escort
navy ship detects any pirate ship or discerns piracy
attack alert from cargo ships, it starts to prevent and
neutralize pirate ship as mentioned in Navy Ship
Model. After the operation, it continues to its transit
and escort duty. A group event, however, does not
have any naval ship. All cargo ships passes through
transit corridor in a bundle that enlarges sensor
range of group and causes to alert naval ships before
any attack has occurred.
5 GEOGRAPHIC INFORMATION
SYSTEM (GIS)
A Geographic Information System (GIS) is a
computer-based tool for mapping and analyzing
geographic phenomenon on Earth. A GIS is
particularly useful for representing input and output
of a geospatial environment. As discussed earlier, in
our modeling approach we also used a GIS system to
display simulating entities on maps. There are three
ways of coupling GIS with simulation (Westervelt,
2002): (1) Loose Coupling: A loose connection
usually involves the asynchronous operation of
functions within each sys-tem. (2) Moderate
Coupling: This category encapsulates techniques
between loose and tight/close coupling. (3) Tight or
Close Coupling: This type of linkage is depicted by
simultaneous operation of systems allowing direct
intersystem communication during simulation
program execution.
There are many GIS packages and tools available
and some are already used to couple with simulation.
For example OpenMap, an open source Java based
GIS package was coupled with Simkit (Mack, 2000).
GeoKIT is a commercial Java based GIS package
and also was used for a simulation study (Yildirim et
al., 2009). We sought to use a .Net compatible GIS
package, since our simulation package, SharpSim, is
also in .Net. Therefore, we choose GreatMap GIS
software (GreatMap, 2011) which is open-source
and can use many online map providers, including
Google, Yahoo, Bing, OpenStreetMap, ArcGIS,
OviMap and CloudMade. On the other hand, it also
supports offline use.
In Figure 3, the Graphical User Interface (GUI)
of the model is shown. It is the animation of one of
the scenarios created for experimentation. Colored
icons represent animated agents.
6 EXPERIMENTATION
In our experiments, we investigate the effects of
resource allocation and patrolling plans on the
success of preventing piracy to make the transit
corridor safer for cargo ships.
We made some assumptions that weather
conditions are stable and do not influence piracy
activity. We also had to neglect possible effects of
armed guards at cargo ships.
6.1 Design of Experiments
We altered the values of the inputs; NPS and NPH
patrol times, south and west side fishing boat rates,
inhibitor coefficients, helicopter ranges, and volume
of cargo ship traffic. Number of ships passed
through Suez Canal is assumed to be the inputs to
the Gulf of Aden, and on average, 17.000 ships pass
the canal annually. Number of pirate acts, however,
is difficult to adapt into the model. We assumed that
some proportion of fishing boats that exist in the
region, under some conditions, acts as pirate ships.
Examining the historical piracy acts in the Gulf, we
SIMULTECH2013-3rdInternationalConferenceonSimulationandModelingMethodologies,Technologiesand
Applications
442

observe no trends.
The performance values in the model are general
variables for measuring success of naval operations.
Model outputs are average successful piracy ratio,
average neutralized pirate ratio, average success
ratio of pirate ships, average neutralization ratio of
NPS, average neutralization ratio of NPH, average
neutralization ratio of NCH, utilization of NPS, and
utilization of NCS.
Table 1: Factors and Levels of Experimental Design.
Levels/
Factors
Level-1 Level-2 Level-3
Level-
4
MPRA
a patrol in
300 minutes
a patrol in
600
minutes
not
planned
for
patrolling
-
NPS
and
NPH
doubled size
NPS
w/helicopter
support
NPS with
helicopter
support
only NPS
ships
none
of
NPS
and
NPH
NCS
five NCS per
day
one NCS
per day
two or
three
NCS per
day
-
We produced 36 different scenarios (3x4x3=36)
(3:MPRA Levels; 4:NPS Levels; 3:NCS Levels) by
changing parameters of patrol policy and resource
allocation parameters in Table 1. There are normally
3 NPSs, and 5 convoy groups in 24 hours. In table 1,
NCS level 1 means that each convoy is escorted by 1
NCS, and in level 2, 1 NCS per day is scheduled.
Each scenario is run for 5 times. Outputs generated
by the model are average successful piracy ratio,
average neutralized pirate ratio, average success
ratio of pirate ships, utilization of NPS, and
utilization of NCS. The run length is for one
simulation year after a warm-up period of one
month.
6.2 Results
Since we aim to make some general inferences on
the relationship between naval resource levels and
success of operations, simulation results are given in
a relative manner and should not be interpreted in an
absolute manner. In all our experiments, the
confidence interval values are small and negligible;
therefore the mean values are enough for analysis.
Although comprehensive experimentation results
exist (Varol, 2012) we give a limited version in this
paper. For example, as the output variable, we have
only taken “Average Prevent Piracy” (APP) ratio
into account. Scenarios no. 13, 16, 22 and 23 have
generated the uppermost values which are
respectively; 0.9980, 0.9973, 0.9970, and 0.9966.
Additionally, scenarios no. 9, 8, 33, 7, 3, and 6 bring
forth the lowermost values which are 0.5695,
0.8220, 0.8493, 0.9075, 0.9225, and 0.9301,
respectively. Figures 4, 5, and 6 shows that the
uppermost results are gained in NPS factor at
“double sized” level at each level of MPRA and
NCS factors (plus signs). On the other hand, NPS
factor at “no ships” level caused the lowermost
results (diamonds). In addition, increasing the
number of NCS ships in the region causes to
increment in APP ratio. Furthermore, when NCS
factor hits the peak, results also reach topmost level.
Keeping both NCS and MPRA factors levels at
their own highest points, the simulation creates
nearly the same results (all shapes except diamonds
at Figure 6) at different levels of factor NPS except
“no ships” level (diamonds at Figure 6).
In addition, rectangles and triangles at Figure 4,
5, and 6 show us, either using or not using helicopter
to prevent piracy has a little effect on the APP ratio
and the difference is not significant. Therefore,
having helicopter resource on-board is not necessary
if NCS ships carry helicopters.
7 CONCLUSIONS
Maritime piracy has been an issue for over a decade
and caused some economical problems in global
scale. OR/MS methods and tools can help tackle
such issues and in our study we made an attempt to
this end. We created a simulation tool for decision
makers to understand the relations between pirate
behavior and naval force planning.
Our methodology was developed in three stages;
firstly we created a class library to create a back-
bone for the study. This includes contact, motion,
area, sensor, and navigation classes. Secondly, we
built an EG to model behaviours conceptually. Later,
based on the EGs we converted the conceptual
models to DES models. In this way, we treated a
DES model as an ABS model. Finally, to animate
agents on a map, we coupled the MSOLib, the
SharpSim model, and a GIS software.
Experiments presented in this paper are given for
demonstrative purposes. The interpretation for the
given experiments is that deploying a helicopter
either on NPSs or NCSs is fulfilling the tasks for
preventing piracy.
SimulationModelingofMaritimePiracyusingDiscreteEventandAgent-BasedApproaches
443
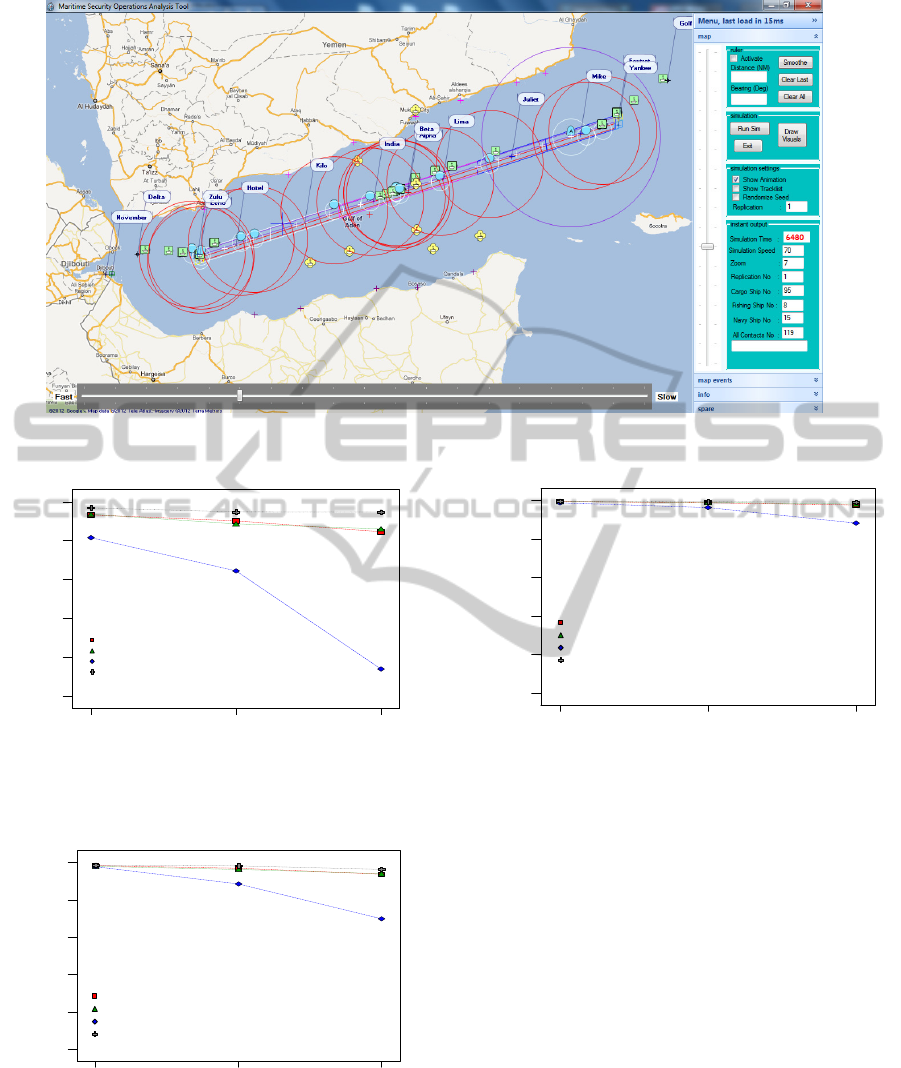
Figure 3: Graphical User Interface of the Model.
B: NPS & NPH
300 mins 600 mins No patrol
A: MPRA
Ave_Prev_Pir_Ratio
0.5000
0.6000
0.7000
0.8000
0.9000
1.0000
Interaction
Figure 4: Interaction of Factors for APP Ratio (NCS at
level 1).
B: NPS & NPH
300 mins 600 mins No patrol
A: MPRA
Ave_Prev_Pir_Ratio
0.5000
0.6000
0.7000
0.8000
0.9000
1.0000
Interaction
Figure 5: Interaction of Factors for APP Ratio (NCS at
level 2 or 3).
B: NPS & NPH
300 mins 600 mins No patrol
A: MPRA
Ave_Prev_Pir_Ratio
0.5000
0.6000
0.7000
0.8000
0.9000
1.0000
Interaction
Figure 6: Interaction of Factors for APP Ratio (NCS at
level 5).
ACKNOWLEDGEMENTS
The views and conclusions contained herein are
those of the authors and should not be interpreted as
necessarily representing the official policies or
endorsements, either expressed or implied, of any
affiliated organization or government.
REFERENCES
Bert, Federico, Guillermo Podestá, Santiago Rovere,
Xavier Gonzalez, Michael North, Angel Menéndez,
Carlos Laciana, Charles Macal, Elke Weber and
Pamela Sydelko. 2010. Agent Based Simulation of
Recent Changes in Agricultural Systems of the
Argentine Pampas. Advances and Applications in
B1 Ships w/helo support
B2 Ships only
B3 No ships
B4 Double ships only
B1 Ships w/helo support
B2 Ships only
B3 No ships
B4 Double ships only
B1 Ships w/helo support
B2 Ships only
B3 No ships
B4 Double ships only
SIMULTECH2013-3rdInternationalConferenceonSimulationandModelingMethodologies,Technologiesand
Applications
444

Statistical Sciences, Vol. 2, Issue 2, pp. 213-231.
Bowditch, N. 2002. The American Practical Navigator.
Bethesda, MD: National Imagery and Mapping
Agency
Buss, Arnold H. and Paul J. Sanchez. 2005. Simple
Movement and Detection in Discrete Event Simula-
tion. Proceedings of the 2005 Winter Simulation
Conference. M.E.Kuhl, N.M. Steiger, F.B. Arm-
strong, and J.A. Jonines, eds. pp.992-1000.
Ceylan, A. and M. M.Gunal. 2011. A Methodology for
Developing DES Models: Event Graphs and
SharpSim. Proceedings of the 2011 European
Modelling and Simulation. Proceedings of EMSS: The
European Modelling & Simulation Symposium 2011 -
ISBN 978-88-903724-4-5
Ceylan A., M. M.Gunal, A. G. Bruzzone. 2012. A New
Approach to Simulation Modeling of Unit-Load
Warehouses. Proceedings of 2012 Spring Simulation
Conference.
Conway, S. R. 2006. An Agent-Based Model for Analyzing
Control Policies and the Dynamic Service-Time
Performance of a Capacity-Constrained Air Traffic
Management Facility, ICAS 2006 - 25th Congress of
the International Council of the Aeronautical Sciences
Hamburg, Germany.
Davilia, A. A., and G. An, 2010. An Agent Based Model of
Liver Damage, Inflammation, and Repair: in Silico
Translation of Cellular and Molecular Mechanisms to
the Clinical Phenomena of Cirrhosis Us-ing Netlogo.
Journal of Surgical Research (ASC Abstracts Issue),
158(2):411.
Emonet, Thierry, Charles M. Macal, Michael J. North,
Charles Wickersham and Philippe Cluzel. 2005.
AgentCell: A Digital Single-Cell Assay for Bacterial
Chemotaxis. Bioinformatics, Vol. 21, No. 11, pp.
2714-2721, Oxford University Press, Oxford, UK.
Filatova, Tatiana, Dawn Parker, and Anne van der Veen.
2009. Agent-Based Urban Land Markets: Agent's
Pricing Behavior, Land Prices and Urban Land Use
Change. Journal of Artificial Societies and Social
Simulation (JASSS), 12(1).
GreatMap. 2011. Accessed [April 2012].
http://greatmaps.codeplex.com.
Hill, R.Raymond, R.G. Carl, and Lance Champagne.
2006. Using agent simulation models to examine and
investigate search theory against a historical case
study. Int.J. Simul. 1(1), p. 29–38.
International Maritime Organization. 2011.
http://www.imo.org [Accessed Jan 2013].
Jakob M., O. Vanek, and M. Pechoucek. 2011a. Using
Agents to Improve International Maritime Trans-port
Security. IEEE Intelligent Systems. 2011, vol. 26, p.
90-96. ISSN 1541-1672.
Jakob M., O. Vanek, B. Bosansky, O. Hrstka, and M.
Pechoucek. 2011b. AgentC: Agent-based System for
Securing Maritime Transit. Proceedings of The 10th
International Conference on Autonomous Agents and
Multiagent Systems. 2011.
Kurahashi, C., and G. An. 2010. Examining the Spatial
Dynamics of the Inflammatory Response with
Topographical Metrics in an Agent-Based
Computational Model of Inflammation and Healing.
Journal of Surgical Research (ASC Abstracts Issue),
158(2):382.
Macal C. M., M. J. North. 2010. Tutorial on agent-based
modelling and simulation. Journal of Simulation,
vol.4, 151-162
Mack P. 2000. THORN: A Study in Designing a Usable
Interface for a Geo-Referenced Discrete Event
Simulation. MSc Thesis, Naval Postgraduate School.
USA.
Moffat, James, Josephine Smith, and Susan Witty. 2006.
Emergent behavior: theory and experimentation using
the MANA model. Applied Mathematics Decision
Science 10, pp.1–13.
North, Michael J., Charles M. Macal , J. St. Aubin, P.
Thimmapuram, M. Bragen, J. Hahn, J. Karr, N.
Brigham, M.E. Lacy, and D. Hampton. 2010. Multi-
scale Agent-based Consumer Market Modelling.
Complexity, Vol. 15, No. 5, pp. 37-47.
One Earth Future Foundation. 2010. The Economic Costs
of Maritime Piracy. One Earth Future Foundation
Working Paper, December 2010.
Siebers, Peer-Olaf, Uwe Aickelin, Helen Celia, and Chris
W. Clegg. 2007. Understanding Retail Produc-tivity
by Simulating Management Practices. Proceedings of
the EUROSIM Congress on Modeling and Simulation
(EUROSIM 2007), Ljubljana, Slovenia.
Siebers, Peer-Olaf, Charles M. Macal, J.Garnett, D.
Buxton, M. Pidd. 2010. Discrete-event simulation is
dead, long live agent-based simulation!, Journal of
Simulation 4(3) 204–210.
Tang, Jonathan, Heiko Enderling, Sabine Becker-
Weimann, Christopher Pham, Aris Polyzos, Chen-Yi
Chen, and Sylvain V. Costes. 2011. Phenotypic
transition maps of 3D breast acini obtained by imag-
ing-guided agent-based modeling. Integrative Biology,
Vol. 3, Issue 4, pp. 408-421.
Varol A. E.(2012) Simulation Modeling of Maritime
Piracy Using Hybrid Agent Based and Discrete Event
Simulation, Masters Thesis, Naval Science and
Engineering Institute, Turkish Naval Academy.
Yildirim U. Z., B.Tansel, İ.Sabuncuoglu. 2009. A Multi-
Modal Discrete-Event Simulation Model For Military
Deployment. Simulation Modelling Practice and
Theory, Volume 17, Issue 4, April 2009, Pages 597-
611, ISSN 1569-190X, DOI: 10.1016/j.simpat.
2008.09.016
SimulationModelingofMaritimePiracyusingDiscreteEventandAgent-BasedApproaches
445
