
Increasing Energy Saving with Service-based Process Adaptation
Alessandro Miracca and Pierluigi Plebani
Politecnico di Milano, Dipartimento di Elettronica, Informazione e Bioingegneria,
Piazza Leonardo da Vinci 32, 20133 Milano, Italy
Keywords:
Complex Event Processing, Data Prediction, Proactive Adaptation.
Abstract:
The aim to reduce the energy consumption in data centres is usually analyzed in the literature from a facility
and hardware standpoint. For instance, innovative cooling systems and less power hungry CPUs have been
developed to save as much more energy as possible. The goal of this paper is to move the standpoint to the
application level by proposing an approach, driven by a goal-based model and a Complex Event Processing
(CEP) engine, that enables the adaptation of the business processes execution. As several adaptation strategies
can be available to reduce the energy consumption, the selection of the most suitable adaptation strategy is
often the most critical step as it should be done timely and correctly: adaptation has to occur as soon as a
critical point is reached (i.e., reactive approach) or, even before it occurs (i.e., proactive approach). Finally,
the adaptation actions must also consider the influence on the performance of the system that should not be
violated.
1 INTRODUCTION
The adoption of the PUE (Power Usage Effective-
ness) to measure how much energy a data centre con-
sumes to run facilities instead of the IT equipments,
has affected the methods proposed in the literature.
Indeed, most of the proposed work are focused on the
reduction of the power consumed by the cooling sys-
tems, or by the optimization of the IT equipments.
On the contrary, less attention has been paid to the
optimization of the applications running in the data
centres. With this work, we want to focus on this as-
pect leveraging on the an adaptive system that detect
anomalies in energy consumption and react by mov-
ing the application to a greener state.
The design and implementation of systems able to
adapt their own behavior with respect to new and un-
foreseen requirements, or to deal and solve problems
that involve the underlying hardware and software,
are some of the most challenging and interesting re-
search questions in the computer science nowadays.
As also discussed in the Autonomic Computing man-
ifesto (Kephart and Chess, 2003), only with a deep
knowledge of the system that we would like to adapt,
the adaptation is possible. This knowledge concerns
the components of the system and how they are orga-
nized, along with the values of indicators that are able
to capture the performance of the system.
According to the MAPE (Monitor - Analyze - Plan
- Execute) cycle, a monitoring infrastructure that con-
tinuously collects information about the status of the
system is required. The analysis of the gathered data
leads the system to better identify any malfunction-
ings and which are the possible adaptations to elimi-
nate them. Finally, the most suitable adaptation action
has to be selected and enacted. In case of service-
based processes, KPIs (Key Performance Indicators)
can be used as a way to evaluate a process in terms of
a set of metrics capturing the most relevant aspects of
the process performance. Among these metrics, en-
ergy saving is gaining more importance. For this rea-
son, we introduce the concept of GPIs (Green Perfor-
mance Indicators) as a way to monitor the greenness
of the process.
The monitoring system should be able to compute
these indicators through the data previously collected.
Actual problems are how their current values can be
used to assess the correctness of the process execu-
tion, how it is possible to react to a critical situation
and, finally, if it is also possible to anticipate the adap-
tation predicting the next values of KPIs and GPIs.
This paper presents a methodology for energy ef-
ficiency in a service-based process context, with the
aim of reducing the impact of the process execution as
much as possible via a set of techniques combined to-
gether. The proposed approach is composed of three
main elements: (i) a goal-based model used to spec-
ify which are the KPIs and GPIs that must be fulfilled
201
Miracca A. and Plebani P..
Increasing Energy Saving with Service-based Process Adaptation.
DOI: 10.5220/0004379802010209
In Proceedings of the 2nd International Conference on Smart Grids and Green IT Systems (SMARTGREENS-2013), pages 201-209
ISBN: 978-989-8565-55-6
Copyright
c
2013 SCITEPRESS (Science and Technology Publications, Lda.)

Server4&
Server2&
Server3&
Server1&
Browse
products
Receive
order
information
Review order
(optional)
Receive
payment
!
!
Cancel
order
Invoke
delivery
Figure 1: e-Commerce sample process.
and, if this is not possible, the actions that might be
performed to adapt the execution; (ii) a prediction sys-
tem used to anticipate possible violations of the indi-
cators; and (iii) an architecture that includes a CEP
(Complex Event Processing) engine (Luckham, 2001)
and combines it with the other elements in order to
detect both the occurring and the predicted violations
and to produce a ranked list of the adaptation actions
that could solve the problem.
Our approach has been validated for a service-
based process running on a testbed where a moni-
toring system exists. The validation shows how the
system is able to detect anomalies in terms of energy
consumption. Moreover, the system is able to support
the selection of the proper adaptation action that will
reduce the energy consumption of the running process
without affecting the performance parameters, as the
response time. Finally, the proposed approach is also
useful for collecting information to further improve
improve the initial goal-based diagram.
The paper is organized as follows. Section 2 in-
troduces a running example used along the paper to
better describe our approach. Section 3 describes the
details of the approach and, in particular, the adopted
goal-based model and the data prediction techniques.
The CEP-based architecture, that combines these ele-
ments, is described in Section 4. A validation of the
approach is the goal of Section 5. After a compari-
son of the work with the state of the art in Section 6,
the paper concludes with a discussion about possible
future extensions in Section 7.
2 RUNNING EXAMPLE
To better understand and provide a validation of our
approach, we use an e-commerce example, inspired
by the TPC-C (Raab et al., 2001) benchmark, where
services are invoked during the execution of a process
for buying a good. Figure 1 shows the structure of the
process and a possible deployment of the services on
a data center (we assume that the orchestrator is run-
ning on another server, i.e., Server0 not included in
the figure). It is worth noting, as it will be also dis-
cussed during the validation, that an alternative “cen-
tralized” deployment is possible: in such a scenario
all the services are executed on the Server1.
For this case study, Table 1 reports some of the
relevant indicators and the metrics to calculate them.
These ones concern both with typical performance di-
mensions (e.g., response time) and with green-aware
indicators (e.g., application green performance). To
compute these indicators, we assume that a proper
monitoring infrastructure is available.
The goal of our approach is to monitor these pre-
defined KPIs and GPIs and to properly adapt the ap-
plication deployment in order to satisfy all the goals
agreed with the users. The achievement of this ob-
jective requires the mediation between two perspec-
tives that often clash. On the one side, the satisfaction
of performance indicators, as the response time, de-
mands more and more resources. On the other side,
the increasing of resources usage raises the energy
consumed; so that the green-aware indicators could
be not satisfied.
3 PROPOSED APPROACH
3.1 Goals and Adaptation
The goal-based model proposed by (Asnar et al.,
2011) has been adapted to represent what we need
to monitor, the occurrences that could affect our ob-
servations, and to exploit the characteristics of adap-
tivity of the process. This model encompasses three
conceptual structures that are organized in three cor-
responding layers, named respectively Asset, Event
and Treatment layer:
• Goals (depicted as ovals) are strategic interests
that actors intend to achieve for generating values;
• Events (depicted as pentagons) are uncertain cir-
cumstances, typically out of the control of actors,
which can have an impact, positive or negative, on
the fulfillment of goals;
• Treatments (depicted as hexagons) are sequences
of actions used to achieve goals or to treat events.
Figure 2 shows an application of the model for our
running case study: (i) Goals represent a set of de-
SMARTGREENS2013-2ndInternationalConferenceonSmartGridsandGreenITSystems
202

CPU
temperature
[60,70]
Response
time [<5]
Application
green
performance
[>700]
CPU usage
[80,90]
Process
power
consumption
[<65]
Increase
CPU
temperature
Reduce
Increase
CPU payload
Increase
server power
consumption
OR
Increase
no. servers
involved in
the process
Reduce
Increase
Dynamic CPU
frequency
scaling
OR
-?
--
--
++
++
Asset Layer
Event Layer
Treatment Layer
+
-
-
-
-
+
-
-
Figure 2: Goal-based model.
Table 1: KPIs and GPIs calculation.
Indicator Threshold Metric
CPU temperature ∈ [60,70] temperature(
◦
C)
CPU usage ∈ [80,90] CPUusage (%)
Process power consumption < 65
∑
server
i
(power
i
(W ))
Application green performance > 700 #transactions/kW h
Response time < 5
∑
(task responsetime(s))
fined constraints on the KPIs and GPIs of the system;
(ii) Events embody possible situations that could af-
fect the integrity of KPIs or GPIs constraints and any
other context that requires the enactment of an adap-
tation action; finally, (iii) Treatments symbolize the
available repair actions.
An added value of the adopted goal-based model
is the possibility to define relationships among goals.
This means that an indicator may depend on other cor-
related indicators. In order to react to the violation of
an indicator, it is possible to take actions influencing
the correlated indicators and, consequently, indirectly
improve the considered indicator. Indicators’ thresh-
olds have to be defined at accurately. It is also possi-
ble to describe how events affect the goals.
It is worth noting that, in order to ensure a pro-
active adaptation, the defined events are determined in
terms of value trends that can have positive or nega-
tive impacts on the goal. A non-trivial task is to figure
out which trends are occurring and when the values
are considered so critical to require a treatment. The
goal of the prediction, as described in the next sec-
tion, is twofold. On the one side, the time series anal-
ysis (a necessary preliminary stage for the prediction
itself) is able to identify and to model the trends of
the monitored data. On the other side, the prediction
is capable of anticipating the achievement of critical
values, so that an adaptation action can be activated
before the indicator violation occurs.
3.2 Data Prediction
In general, a series is defined as a sequence of several
observations of a phenomenon with respect to a quali-
tative nature. If this feature is time, the series is called
historical or, commonly, time series.
Given the phenomenon Y , any observations col-
lected at time t is represented by the notation Y
t
. So,
formally, Y = [Y
t
: 1 ≤ t ≤ L] where L is the total num-
ber of observations gathered.
The classical approach for time series analysis
provides a model that describes any observation as:
Y
t
= f (t) + u
t
in which the value of the observation at time t is
the result of the composition between a determinis-
tic component f (t), called systematic part, and a se-
quence of random variables u
t
, named stochastic part.
It is worth noting that, before any kind of analy-
sis, time series data need to be examined in order to
make some adjustments and replace outliers. These
adjustments are necessary when discontinuity and ef-
fects due to the different duration of time intervals af-
fect the series. Figure 3 shows the effect of an outlier
IncreasingEnergySavingwithService-basedProcessAdaptation
203

Figure 3: Outlier elimination samples.
elimination procedure on a generic time series.
In this paper, time series analysis is used to pre-
dict the values of a KPI, or a GPI. That means using
a model to anticipate the future behavior of the ob-
served variable, based on its past values. Indeed, the
sooner we can figure out a possible violation of an
indicator, the sooner we can react and possibly avoid
that such a violation occurs. In particular, considering
our running example, we noticed that several outliers
arise. As a consequence, and in order to obtain a reli-
able prediction, such outliers need to be deleted.
Models for time series can have many forms and
represent different stochastic processes. AutoRegres-
sive (AR) models, Integrated (I) models and Moving
Average (MA) models are some of the most popular
way to theoretically define a time series. Combina-
tions of them produce well known AutoRegressive
Moving Average (ARMA) and AutoRegressive Inte-
grated Moving Average (ARIMA) models.
In our case, we use autoregressive model to repre-
sent time series data. The notation AR(p) indicates a
p-order autoregressive model which is defined as:
y
t
= φ
1
y
t−1
+ φ
2
y
t−2
+ φ
p
y
t−p
+ η
t
where φ
1
,φ
2
,...,φ
p
are the parameters of the
model which act for the linear regression coefficient
of the random variable y
t
, compared to its past values,
and η
t
is white noise.
The most common manner to identify a model is
through its transfer function W (z). Called u(t) the
function that describes the input values in terms of
time and y(t) the function that represents the output,
knowing that any autoregressive and moving average
model provides an output that is a linear combination
of previous values of both the input and the output,
y(t) is obtained by (1):
y(t) + α
1
y(t − 1) + ... + α
p
y(t − p) = β
0
u(t) + 1
+β
1
u(t − 1) + ... + β
q
u(t − q) (1)
Applying the Discrete Fourier Transformation, (1)
can be rewritten introducing lag operator z, which has
the aim to delay or to anticipate a value:
y(t) =
β
0
+ z
−1
β
1
+ ... + z
−q
β
q
1 + z
−1
α
1
+ ... + z
−p
α
p
· u(t) =
=
C(z)
A(z)
· u(t) = W (z) · u(t) (2)
W (z) is called transfer function and, in order to
compute a reliable prediction, we assume it is already
in the canonical spectral factor form, as required by
the time series analysis theory.
Starting from (2), we can get the one-step ahead
predictor transfer function
1
:
ˆy(t + 1 | t) =
z · (C(z) − A(z))
C(z)
· y(t) (3)
So, in order to estimate the future value of the
series, we need to calculate the difference between
the numerator C(z) and the denominator A(z) of the
autoregressive model transfer function, multiply this
with the lag operator z and then divided by C(z).
Regarding multi-step ahead prediction, the r-step-
ahead predictor transfer function
ˆ
W
r
(z) is the result
of the method of Polynomial Long Division between
C(z) and A(z), applied r times (Cheng et al., 2006).
The prediction accuracy always depends on the
value of an error indicator. In case of ARMA(p,q)
model, the Final Prediction Error (FPE) is used as a
statistical measure of goodness-of-fit. The same indi-
cator can be also used in case of an AR(p) model, as
any autoregressive model is equal to an ARMA model
where q = 0. The Final Prediction Error (FPE) is
given by:
FPE
n
=
(L + (p + 1))
(L − (p + 1))
· σ
2
p
where σ
2
p
is the variance of model residuals, L is
the length of the time series, and p is the number of
estimated parameters in the model. The variance of
model residuals is calculated iteratively by:
σ
2
p
= σ
2
p−1
(1 − (
ˆ
φ
p
· p)
2
)
in which
ˆ
φ
0
2
= 0 and σ
2
0
=
1
L
L
∑
t=1
(Y
t
−Y )
2
is the
variance of the time series.
Several candidate models can be calculated using
different criteria, but only the one with the lowest FPE
value is selected as the best-fit model.
1
Due to the limited number of pages, in this paper we
omitted the complete procedure to obtain the predictor. For
more details, we suggest to read (Hamilton, 1994)
SMARTGREENS2013-2ndInternationalConferenceonSmartGridsandGreenITSystems
204

Service-based process adaptor
Data monitor
Complex Event
Processing
Engine
Data predictor
Adaptation actions
ranker
Goal-based model
instances
repository
Ranked list of
adaptation
actions
Figure 4: System architecture.
4 ARCHITECTURE
After having introduced the goal-based model and the
data prediction in time series, as the cornerstones of
our approach, the Figure 4 shows the architecture that
combines them to support the service-based adapta-
tion. Here, we assume that a monitoring infrastruc-
ture, composed by several probes, is properly de-
ployed to gather information about the execution of
the service-based process. As described in the follow-
ing, the goal-based model instances repository con-
tains information that is useful to understand all the
modules composing our architecture. Indeed, it con-
tains information regarding which are the constraints
that must be satisfied (i.e., the goals) and the avail-
able adaptation actions (i.e., the treatments), along
with information with which instrument the CEP en-
gine to detect the violations (i.e., the events). Finally,
the arrows reported in the figure reflects the data flow
among the modules.
4.1 Data Monitor
Goal of the Data Monitor is to collect all the data
made available by the probes and to compute the indi-
cators used to define the goals to be fulfilled. For this
reason, this module reads the goal-based model to ob-
tain the list of the indicators that have to be calculated
and the metrics to be used (see Table 1). In some
cases, the computation directly reflects a monitored
value (e.g., power consumption is equal to the value
returned by a probe installed on a server). In some
other cases, the computation is more complex and in-
volve several probes (e.g., the MHz/Watt). Data col-
lected by the Data Monitor are made available for the
CEP module and the Data Predictor. In our testbed,
a set of Nagios
2
plugins have been implemented to
collect the required data.
Monitoring system usually has an impact on the
overall performances. As a consequence, the setting
of the monitoring frequency is a critical step. Hav-
ing a high monitoring frequency means greater over-
head and a lot of data to manage. On the contrary,
low monitoring frequency means less impact on the
performances but an higher probability to miss sig-
nificant variations and also violations.
4.2 Data Predictor
For all the monitored indicators, the goal of this mod-
ule is to identify the time series model and to predict
future values starting from the data monitored up to a
given time. The theoretical background of this mod-
ule has been discussed in Section 3.2. Considering the
monitoring frequency, the prediction can have a sig-
nificant impact for the adaptation as it makes possible
to anticipate the violation of several minutes. This
module relies on GNU Octave Engine
3
and, in partic-
ular, on the following functions:
• arburg - it calculates the coefficients of an autore-
gressive (AR) model of complex data using the
whitening lattice-filter method of Burg;
• detrend - it removes the trend from data, handles
NaN’s by assuming that these are missing values
and unequally spaced data;
• interp1 - it helps in replacing the outlier with val-
ues that do not alter the characteristics of the se-
ries, through the interpolation method.
2
http://www.nagios.org/
3
http://www.gnu.org/software/octave
IncreasingEnergySavingwithService-basedProcessAdaptation
205

In order to obtain an accurate prediction, the function
initially performs a deep analysis of the series, cal-
culating the mean and the variance first of all, just be-
fore moving to the elimination of outliers and possible
trend components, cyclicity or seasonality. After that,
the series is rendered with zero mean value, in order to
decrease the prediction error. Now the series is ready
for the calculation of the auto-covariance, a key ele-
ment for the computation of the FPE, and then, finally,
predictions for each model and possible criterion are
estimated. At this point, among all the predictions
calculated, the function will select the one that corre-
sponds to the criterion passed as an input parameter
and, at the same time, with the least value of FPE.
4.3 CEP Engine
Both the real monitored data and the predicted ones
are inputs for the CEP engine
4
, as the goal of this
module is to monitor all the events related to changes
in current, and also in future, values of the indicators.
Each event is included in the initial goal-based model
and might have positive or negative impact on the ful-
fillment of a given goal.
The adoption of a CEP engine is required as the
information continuously flows from the Data Moni-
tor and the Data Predictor. A query in a CEP, indeed,
once it is issued it logically continuously runs over the
incoming data, in contrast to traditional DBMS where
the queries are run once over the current data set. Usu-
ally, queries for a CEP are based on Event Processing
Language (EPL): an SQL-like language extended to
handle event streams and patterns. Sample queries
are reported in the following:
// Current Response time
SELECT * FROM RT(responseTime >5)
// Predicted CPU Usage
SELECT * FROM CPUUsagePrediction
(probability >60.0,CPUUsage <80) OR
CPUPrediction (probability >60.0,
CPUUsage >90)
Thus, the CEP has to verify if one of the events de-
fined in the model is either occurring or, using the pre-
dicted data, will occur in the future. Since the occur-
rence of an event corresponds to a violation, the CEP
will inform the Adaptation actions ranker about the
critical situation to identify the most suitable adapta-
tion strategy. Considering both the current and future
data allows our system to support both reactive and
pro-active adaptations.
4
In our implementation we adopted Esper (http:// es-
per.codehaus.org/) as CEP engine
4.4 Adaptation Actions Ranker
Once a notification for a violation arrives, this module
suggests to the user the best repairing action, among
those implemented, to resolve the current or immi-
nent violation. As a consequence, this module is also
in charge of deciding if an adaptation should be en-
acted to solve the detected problem or not. Indeed,
it depends on the severity of the violation and on the
nature of the analyzed time series.
For time series with a significant stochastic com-
ponent, any time-isolated violation is considered as
an outlier, i.e., a value that is not logical to expect fre-
quently. For this reason, only if several violations for
a given indicator occur in a limited period of time, the
module begins its adaptation selection procedure. In
case of critical indicators, or time series with a limited
stochastic component, the strategy selection will start
as soon as the violation is detected.
Starting from the goal-based model, the Adapta-
tion actions ranker looks for the treatments that can
have a positive impact on the goal under violation.
As different degree of impact can be defined in the
model, this module sorts the suggested actions ac-
cording to a rating that is calculated by the difference
between the number of positive and negative impacts
a repairing action has on the system. These impacts
are determined as relationships that each treatment
has with the other elements of the goal-based model:
the ones that introduce an alleviation of the effect an
event has on the fulfillment of a goal is considered a
positive impact, whilst the ones that promote a viola-
tion have negative impact.
The repairing actions suggested by the tool always
have a score equal to zero if they do not modify the
situation, or greater than zero if they improve the cur-
rent condition of the system.
We assume that the final choice to activate or not
a repairing action always depends on the user. Such
a request for a human being interaction is intended
to reduce false positives problem. According to the
results of the simulations, false positives represent
about 5% of a sample of 300 measurements. We be-
lieved that a human control, together with that of the
machine, may further reduce this percentage.
5 VALIDATION
With this validation we verify the ability of the system
to detect a violation and to produce the list of avail-
able adaptation actions. This requires the correctness
of the prediction offered by the Data predictor and the
ability of the CEP Engine to capture the events of in-
SMARTGREENS2013-2ndInternationalConferenceonSmartGridsandGreenITSystems
206
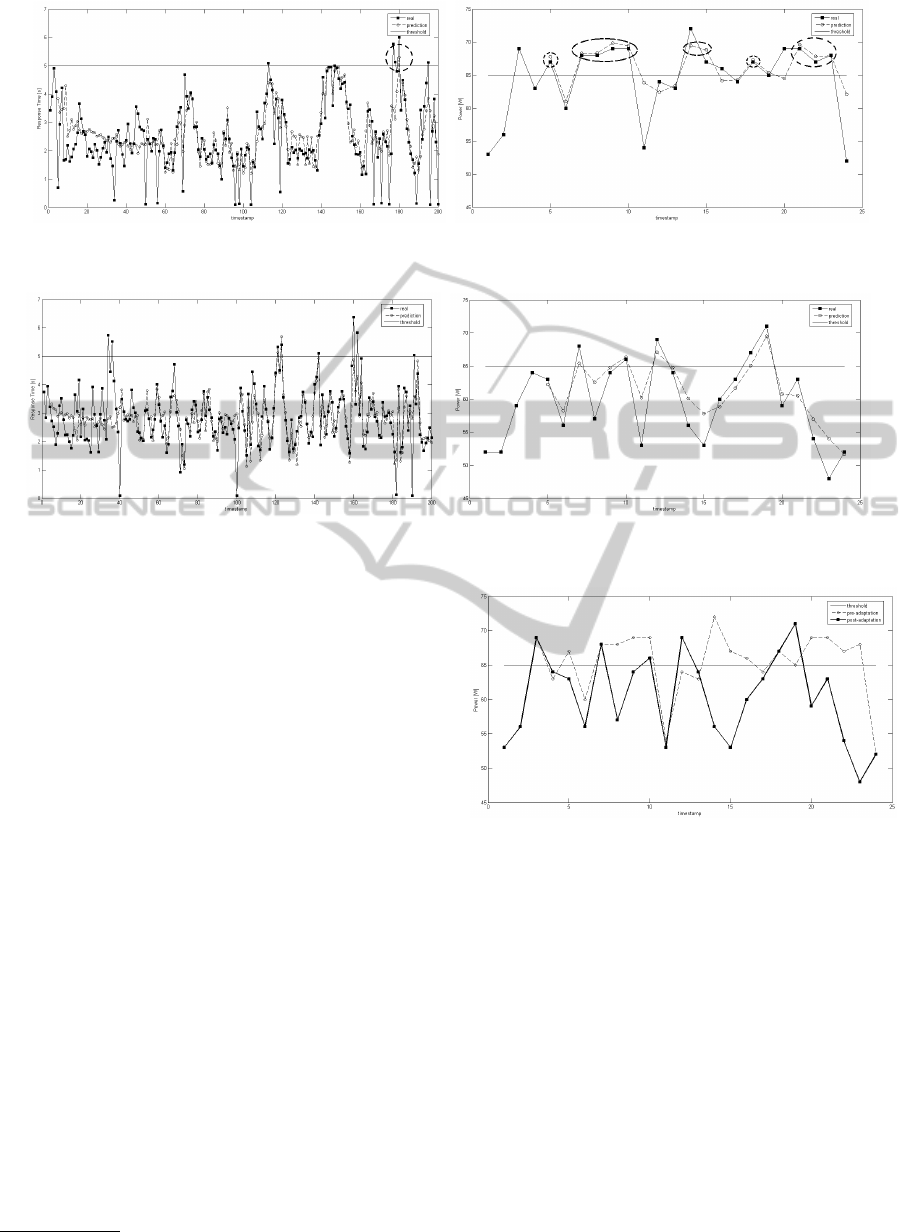
(a) Response time (b) Process power consumption
Figure 5: Centralized deployment.
(a) Response time (b) Process power consumption
Figure 6: Distributed deployment.
terest. The adopted testbed is composed by 4 servers
where Glassfish
5
is installed. The services compos-
ing the process introduced in Section 2 can run on any
of these servers. A fifth server hosts the application
that orchestrates the process: i.e., calling the services
in the proper order (see Figure 1). A set of Nagios plu-
gins are installed to be able to gather all the data that
make possible the computation of the KPIs and GPIs,
as defined in Table 1. In particular, we focused on:
(i) the response time, as a typical KPI, calculated at
the end of each invocation; and (ii) the process power
consumption, representing GPIs class sampled every
180 sec.
As a first trial, we assume that the services com-
posing the process are running only on Server1 (i.e.,
centralized deployment). With such a configuration,
the experiment lasts one hour, during which a new
request to the process is sent every 1.0 sec in the av-
erage. Figure 5 shows the curves obtained for the re-
sponse time and the process power consumption. The
power consumption is computed summing the power
consumption of all the five servers even if some of
them are not used in that moment for the execution of
the process. Indeed, we assume that these servers con-
sume power as they remain in stand-by mode, ready
to run applications. Given these curves, proving the
correctness of a prediction means that we need to en-
5
http://glassfish.java.net/
Figure 7: Process power saving.
sure that the distance between the predicted event at
time t − 1 and the real occurrence of the event at time
t is minimum, in term of numerical value. Such a
property is strongly linked to the goodness-of-fit of
the model that describes the time series of the indi-
cator. On these bases, we can notice how the pre-
diction curves, after an initial set-up time, is able to
follow the same trend of the actual ones. Especially
in case of the power consumption this means that we
are able to know the power consumption, in case of
one-step prediction, three minutes before sensing the
real value. This also means that we can anticipate the
violation and having a proactive adaptation.
Considering the process power consumption, the
CEP module informs about the upcoming violation
the Adaptation actions ranker every time the value is
beyond the threshold (i.e., the horizontal line). As
IncreasingEnergySavingwithService-basedProcessAdaptation
207

a consequence, after five to ten samples (i.e, fifteen
to thirty minutes), the list of adaptation actions will
be produced as the process power consumption sys-
tematically overcomes the limit value. This requires
the goal-based model instance (see Figure 2), that is
used by the Adaptation actions ranker, to realize that
the violation of the constraint on this indicator can be
solved in two ways: either redefining the deployment
with a higher degree of distribution or reducing the
CPU scaling frequency. These two actions compose
the list that represents the result of our approach.
Figure 6 shows the effects of the process workload
split among the various servers installed and running
on the testbed. Despite a slight increase of the average
response time, the benefits introduced with regard to
the process power consumption are evident.
Figure 7 highlights the power saving that can
be achieved applying one of the suggested adapta-
tion strategies, such as a redistribution of the ser-
vices composing the process among the servers. The
dashed line represents the power consumption if no
adaptation strategy was enabled after any detected vi-
olation; instead, the solid line depicts a situation in
which an adaptation action was performed in order to
solve the encountered problems and, at the same time,
to reduce the energy consumption. An estimation of
the value of such a power saving is around 0.085 kWh,
equal to 6.75% of total energy consumption.
6 RELATED WORK
Focusing on the use of prediction in service-based
systems, (Metzger et al., 2012) tries to work with
online quality prediction. However, there are many
challenging issues, as the limited control and visibil-
ity on the third-party services that call for concrete
solutions. In our approach, instead, prediction is cal-
culated based on KPIs and GPIs, that represent the
quality of the system, both in terms of performance
and for what concerns greenness. We defined these
indicators and, with them, we are able to access ev-
ery significant aspect of the system that we want to
monitor. (Wetzstein et al., 2012) provides a detailed
integrated monitoring, prediction and adaptation ap-
proach for preventing KPI violations of business pro-
cess instances. Here, KPIs are used to map the pro-
cess features and prediction is calculated starting from
checkpoint, dislocated through the process itself, via
a classification learning algorithm based on decision
tree, called J48. This is the most closely related work
to our approach. The differences stay in how to calcu-
late the prediction and in the selection of the adapta-
tion actions. We use an AR model to obtain a reliable
prediction, while (Wetzstein et al., 2012) opts for de-
cision trees, that means it needs a significant initial-
ization step in order to built meaningful trees. Even
the selection of the repairing action is computation-
ally much more expensive of our: in (Wetzstein et al.,
2012) there are no predefined actions, but only indi-
vidual adaptation strategies that have to be combined
to solve the ongoing or future violation. Instead, our
tool relies on a goal-based model that contains all the
possible actions that can solve the detected problem.
In (Zeng et al., 2008) the main concern is Qual-
ity of Service Management (QoSM), which is a new
task in IT-enabled enterprises that supports monitor-
ing, collecting and predicting QoS data. (Zeng et al.,
2008) presents an event-driven QoS prediction system
that contains a real-time metric and KPIs prediction
mechanism. The differences with our work stand in
the way of defining the KPIs and in the instruments
they used to examine the events and to estimate the
predictions. KPIs play a marginal role in (Zeng et al.,
2008), as they are intended only as the result of the
aggregation of some metrics, while they are on the
basis of the whole architecture in this paper. We used
Complex Event Processing and AR models to deal re-
spectively with events and prediction; on the contrary,
Event-Condiction-Action (ECA) rules and Exponen-
tial Smoothing are used by (Zeng et al., 2008) to pro-
cess the events and to compute the predictions.
Artificial neural networks theory holds all the
elements to be elected as the foremost prediction
method. It resolves the problem of the identification
of the model easily in respect of both ARMA struc-
tures and Box-Jenkins methodology. However, we
preferred an autoregressive model because the accu-
racy of a neural network model may be seriously com-
promised when it is used recursively for multi-step
prediction purposes. (Nguyen and Chan, 2004) and
(Adya and Collopy, 1998) are both trying to inves-
tigate a hybrid methodology that combines artificial
neural networks and ARMA models.
In the area of process monitoring and adaptation,
using CEP techniques, several approaches have been
proposed. CEVICHE (Hermosillo et al., 2010) is a
framework that combines the strength of Complex
Event Processing, a dynamic business process adap-
tation method via an AOP (Aspect-Oriented Program-
ming) paradigm, which complements the more used
object-oriented one, and an extension of the BPEL
language for communication. It differs from our work
just because is only able to activate a single adapta-
tion action, that consists in skipping some optional
services, and also it has only a reactive behavior.
(Sen, 2008) discusses how the existing state-of-the-art
BAM solutions, of which CEP is an essential compo-
SMARTGREENS2013-2ndInternationalConferenceonSmartGridsandGreenITSystems
208

nent, have not come up to the expectations of provid-
ing real-time information across business processes
and supporting business users decision. Our work,
on the contrary, is not limited to monitoring and vi-
sualization of events, but rather deals with analyz-
ing and providing appropriate decision support for
the users. (Leitner et al., 2010) proposes a frame-
work, named PREvent, which is a system that in-
tegrates event-based monitoring via CEP, prediction
of Service Level Agreement (SLA) violations, using
machine learning techiniques, and automated runtime
prevention of those violations by triggering adapta-
tion actions. It differs from our work, first of all, in
some aspects related to the prediction: in fact, it com-
putes a prediction only when the esecution of the pro-
cess reaches a checkpoint and the prediction targets
are Service Level Objectives (SLOs), not indicators.
Secondly, the predicted value is calculated by mul-
tilayer perceptrons, a variant of artificial neural net-
work, while our approach relies on AR models.
7 CONCLUSIONS AND FUTURE
WORK
This paper has introduced an approach for support-
ing the selection of adaptation actions in case of
service-based processes to reduce the energy con-
sumption. This approach combines the use of a con-
ceptual model for defining the relationships between
the system goals, in terms of KPIs and GPIs, and the
adaptation actions, with a prediction system. The re-
sulting architecture is able to support the reactive and
proactive adaptation of a service-based process.
Future extensions of the proposed approach will
involve the use of a n-step predictor to improve the
proactiveness of the system. At the same time, to
close the loop, an approach to automatically verifies
the positive or negative effects of the selected adapta-
tion actions is required.
ACKNOWLEDGEMENTS
This work has been partially funded by Italian project
“SeNSori” (Industria 2015 - Bando Nuove Tecnolo-
gie per il Made in Italy) - Grant agreeement n.
00029MI01/2011.
REFERENCES
Adya, M. and Collopy, F. (1998). How Effective are Neural
Networks at Forecasting and Prediction? A Review
and Evaluation. J. of Forecasting, 17(5-6):481–495.
Asnar, Y., Giorgini, P., and Mylopoulos, J. (2011). Goal-
driven risk assessment in requirements engineering.
Requir. Eng., 16(2):101–116.
Cheng, H., Tan, P.-N., Gao, J., and Scripps, J. (2006).
Multistep-Ahead time series prediction. In Proc. of
the 10th Pacific-Asia conf on Advances in Knowledge
Discovery and Data Mining, PAKDD’06, pages 765–
774, Berlin, Heidelberg. Springer-Verlag.
Hamilton, J. D. (1994). Time Series Analysis. Princeton
University Press.
Hermosillo, G., Seinturier, L., and Duchien, L. (2010). Us-
ing Complex Event Processing for Dynamic Business
Process Adaptation. In Proc. of the 7th IEEE 2010
Int’l Conf. on Services Computing, SCC ’10, pages
466–473, Washington, DC, USA. IEEE.
Kephart, J. and Chess, D. (2003). The Vision of Autonomic
Computing. Computer, 36(1):41–50.
Leitner, P., Michlmayr, A., Rosenberg, F., and Dustdar, S.
(2010). Monitoring, Prediction and Prevention of SLA
Violations in Composite Services. 2012 IEEE 19th
Int’l Conference on Web Services, pages 369–376.
Luckham, D. C. (2001). The Power of Events: An Intro-
duction to Complex Event Processing in Distributed
Enterprise Systems. Addison-Wesley Longman Pub-
lishing Co., Inc., Boston, MA, USA.
Metzger, A., Chi, C.-H., Engel, Y., and Marconi, A. (2012).
Research Challenges on Online Service Quality Pre-
diction for Proactive Adaptation. In Software Services
and Systems Research - Results and Challenges (S-
Cube), 2012 Workshop on European, pages 51 –57.
Nguyen, H. and Chan, W. (2004). Multiple neural networks
for a long term time series forecast. Neural Comput.
Appl., 13(1):90–98.
Raab, F., Kohler, W., and Shah, A. (2001). Overview of the
TPC Benchmark C: The Order-Entry Benchmark.
Sen, S. (2008). Business Activity Monitoring Based on
Action-Ready Dashboards And Response Loop. In
Proceedings of the 1st International Workshop on
Complex Event Processing for Future Internet.
Wetzstein, B., Zengin, A., Kazhamiakin, R., Marconi, A.,
Pistore, M., Karastoyanova, D., and Leymann, F.
(2012). Preventing KPI Violations in Business Pro-
cesses based on Decision Tree Learning and Proactive
Runtime Adaptation. J. of Sys. Integration, 3(1):3–18.
Zeng, L., Lingenfelder, C., Lei, H., and Chang, H.
(2008). Event-Driven Quality of Service Prediction.
In Bouguettaya, A., Krueger, I., and Margaria, T.,
editors, Service-Oriented Computing - ICSOC 2008,
volume 5364 of Lecture Notes in Computer Science,
pages 147–161. Springer Berlin Heidelberg.
IncreasingEnergySavingwithService-basedProcessAdaptation
209
