
Distance-based Algorithm for Biometric Applications in Meanwaves
of Subject’s Heartbeats
Tiago Araujo
1,2
, Neuza Nunes
2
, Hugo Gamboa
1
and Ana Fred
3,4
1
CEFITEC, New University of Lisbon, Caparica, Portugal
2
Plux Wireless Biosignals, Lisbon, Portugal
3
Instituto de Telecomunicac¸
˜
oes, Scientific Area of Networks and Multimedia, Lisbon, Portugal
4
Department of Electrical and Computer Engineering, Instituto Superior T
´
ecnico, Lisbon, Portugal
Keywords:
Biometry, Classification, Electrocardiography, Meanwave, Signal Processing.
Abstract:
The authors present a new biometric classification procedure based on meanwave’s distances of electrocar-
diogram (ECG) heartbeats. The ECG data was collected from 63 subjects during two data-recording sessions
separated by six months (Time Instance 1, T1, and Time Instance 2, T2). Two classification tests were per-
formed with the goal of subject identification using a distance-based method with the heartbeat waves. In
both tests, the enrollment template was composed by the averaging of the T1 waves for each subject. For
the first test, we composed five meanwaves of different T1 waves; In the second test, five meanwaves of dif-
ferent groups of T2 waves were composed. Classification was performed through the implementation of a
kNN classifier, using the meanwave’s Euclidean distances as features for subject identification. In the first
test, with only T1 waves, 95.2% of accuracy was achieved. In the second test, using T2 waves to compose
the dataset for testing, the accuracy was 90.5%. The T2 waves belonged to the same subjects but were ac-
quired in different time instances, simulating a real biometric identification problem. We therefore conclude
that a distance-based method using meanwaves of ECG heartbeats for each subject is a valid parameter for
classification in biometric applications.
1 INTRODUCTION
Large amounts of confidential data are stored and
transferred through the web every day. In the ac-
cess control the need for more speed and efficiency
in intruders detection is crucial. The new era requires
new concerns about security and authentication. Bio-
metric recognition addresses this problem in a very
promising point of view. The human, voice, finger-
print, face, and iris are examples of individual charac-
teristics currently used in biometric recognition sys-
tems (Jain et al., 2000). Recently, several works stud-
ied the electrocardiography (ECG) signal as an intrin-
sic subject parameter, exploring its potential as a hu-
man identification tool (Silva et al., 2007)(Coutinho
et al., 2010)(Li and Narayanan, 2010).
Biometry based in ECG is essentially done by
the detection of fiducial points and subsequent fea-
ture extraction (Lourenco et al., 2011). Neverthe-
less there are some works that use a classification ap-
proach without fiducial points detection (Plataniotis
et al., 2006), referring computational advantages, bet-
ter identification performance and peak synchroniza-
tion independence.
Since 2007, Institute of Telecommunications (IT)
research group has explored this theme addressing
it, essentially, in two ways: i) analysis of the ECG
time persistent information, with possible applicabil-
ity in biometrics over time; and ii) Development of
acquisition methods which enabled the ECG signal
acquisition with less obtrusive setups, particularly us-
ing hands as signal acquisition point. Following this
goals, a recent work proposed a finger-based ECG
biometric system, that uses signals collected at the fin-
gers, through a minimally intrusive 1-lead ECG setup
recurring to Ag/AgCl electrodes without gel. In the
same work, an algorithm was developed for compari-
son between the R peak amplitude from the heartbeats
of test patterns and the R peak from the enrollment
template database. The results revealed that this could
be a promising technique.
In this work we used the IT ECG database and
follow the same methodology as described before, but
using a new biometrics classification algorithm based
630
Araújo T., Nunes N., Gamboa H. and Fred A..
Distance-based Algorithm for Biometric Applications in Meanwaves of Subject’s Heartbeats.
DOI: 10.5220/0004358106300634
In Proceedings of the 2nd International Conference on Pattern Recognition Applications and Methods (BTSA-2013), pages 630-634
ISBN: 978-989-8565-41-9
Copyright
c
2013 SCITEPRESS (Science and Technology Publications, Lda.)
on the heartbeat meanwave’s Euclidean distances.
In the following section we will depict the proce-
dure for the ECG data acquisition and pre-processing.
We will also explain the methodology followed in this
study to efficiently classify the heartbeat waves as the
respective subject. Section 3 contains the results ob-
tained in the study. Those results are discussed and
conclusions are taken in section 4 of this paper.
2 PROCEDURE
2.1 Data Collection
ECG data were collected from 63 subjects,
166.55±8.26cm, 61.82±11.7Kg and 21±4.46
years old, during two data-recording sessions with six
months between them. The acquisitions were divided
in two groups, T1 and T2, referring respectively to
the first recording instance and the second recording
six months after. The subjects were asked to be
seated and relaxed in both recordings.
2.2 Signal Acquisition and Conditioning
The signals were acquired by two dried electrodes
assembled in a differential configuration(Lourenco
et al., 2011). The sensor uses a virtual ground, an
input impedance over 1MΩ, 110dB of CMRR and
gain of 10 in the first stage. The conditioning circuit
consists of two filtering levels: i) bandpass between
0.05Hz and 1000Hz and ii) notch filter centered in
50Hz to remove network interference. The final am-
plification stage has a gain of 100 to improve the res-
olution of the acquired signal. This system also mag-
nifies the signal after filtering undesired frequencies
in each conditioning stage. The signal is then digi-
talized for further digital processing. This processing
consists in: a) bandpass digital filter (FIR) of 301 or-
der and bandwidth from 5Hz to 20Hz, obtained using
a hamming window, b) detection of QRS complexes,
c) segmentation of ECG and determination RR inter-
vals, d) outliers removal, e) meanwaves computation
and feature extraction, and finally f) the data classi-
fication. The signal acquisition and the processing
steps a), b) and c) were done by the methodology de-
veloped in IT (Lourenco et al., 2011).
In the following section the methodology de-
signed for the implementation of the remaining steps
( d), e) and f) ) will be described.
2.3 Methodology
Our goal was to successfully use the patterns of ECG
heartbeats to identify the correspondent subjects in
different time periods, with a classification method.
Classification is a machine learning technique used to
predict group membership for data instances.
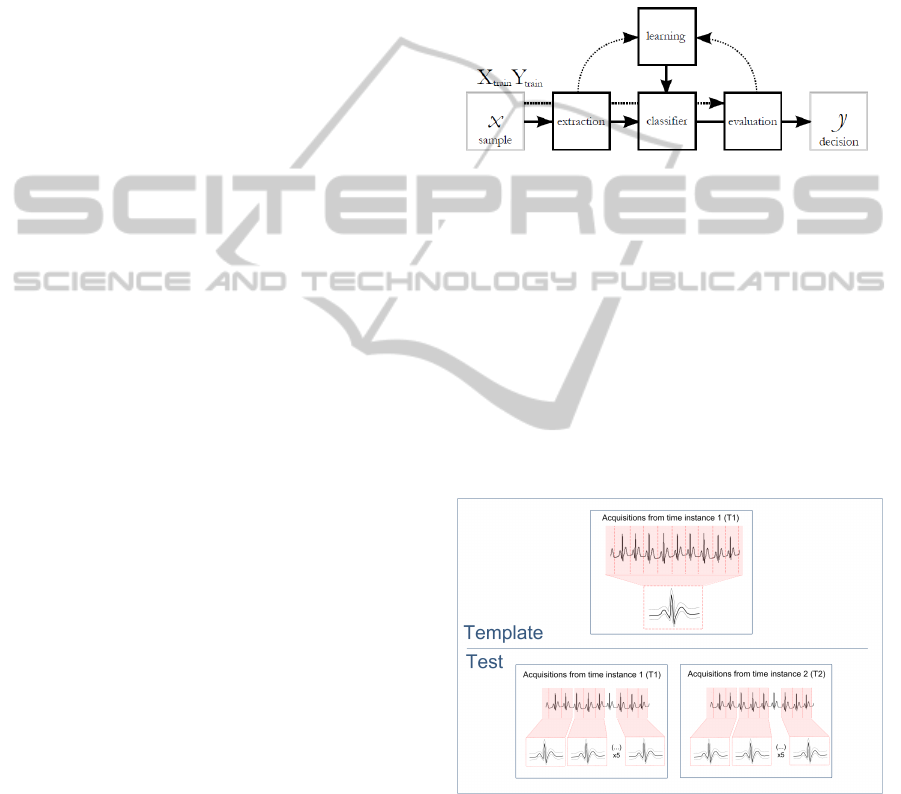
Figure 1 depicts the usual process that is followed
to classify a set of data.
Figure 1: The process of data classification.
This process comprises a first stage of feature extrac-
tion, making data transformations to generate useful
and novel features from a set of candidates. For the
data classification there’s a supervised learning pro-
cess, as we give the classifier a first set of data, called
training set, and the classifier learns about the fea-
tures and correspondent classes. The new sets of data
given, called test set, will match the features with the
input training set and associate each sample to the cor-
respondent classes.
Figure 2 provides a schematics example of the
methodology followed in our work.
Figure 2: Template and Tests of the classification process.
The data used in this study were divided in two
groups: the T1 and T2 acquisitions. In the first test we
work with only T1 waves, and in the second test we
compare the T2 waves with the T1 template - there-
fore we can check the differences in classification ac-
curacy when working with acquisitions separated in
time from the same subject, simulating a real biomet-
ric identification problem.
Distance-basedAlgorithmforBiometricApplicationsinMeanwavesofSubject'sHeartbeats
631
The dataset defined as template is composed with
the T1 subjects’ meanwaves. The features of the clas-
sification process are the distance value between the
template meanwaves and the meanwaves of future ac-
quisitions (tests).
To compose the template, the first step was to
compute a meanwave (Nunes et al., 2012) by the aver-
aging of all T1 waves (which were already segmented
into RR-aligned heartbeats). An outliers removal pro-
cedure followed, by computing the mean square er-
ror distance of each wave to the resulting meanwave.
Equation 1 displays the expression for the computa-
tion of this distance for only one heartbeat (being l the
length, in samples, of the normalized cycle and mean-
wave). After gathering the distance of each wave to
the meanwave, 10% of the waves which presented the
higher values of distance were removed from the tem-
plate. A new meanwave for each subject was then
computed without the outliers. Each subject’s mean-
wave was composed with over 100 heartbeat waves.
distance =
s
∑
l
i=1
(cycle
i
− meanwave
i
)
2
l
(1)
The 63 meanwaves gathered, one for each subject,
completed the template for the classifier.
For the first Test dataset, we also used the T1
waves, but divided them randomly into 5 groups,
computing one meanwave for each group. Each
meanwave was composed with 10 heartbeat waves.
Those five test meanwaves were compared, using a
distance metric, with the T1 template, for each sub-
ject. The distance metric used was the same presented
before in equation 1, where we used the meanwave
computed from each group instead of each subject’s
cycle.
For the second Test we followed the same proce-
dure as before but with a calculation of the distance
between the T1 template meanwave and the 5 mean-
waves from T2 for each subject.
With the distance values computed for both
tests we composed two distances’ matrices with 63
columns or features, representing the distance of each
sample (the Test meanwave) to each subject’s mean-
wave of the template T1, and 315 (5x63) rows or sam-
ples, representing the 5 meanwaves we gathered for
each subject and each Test.
We used a user friendly toolbox (Orange, 2012),
to classify the data, giving the distance matrices as
input and using a k-Nearest Neighbor (kNN) classifier
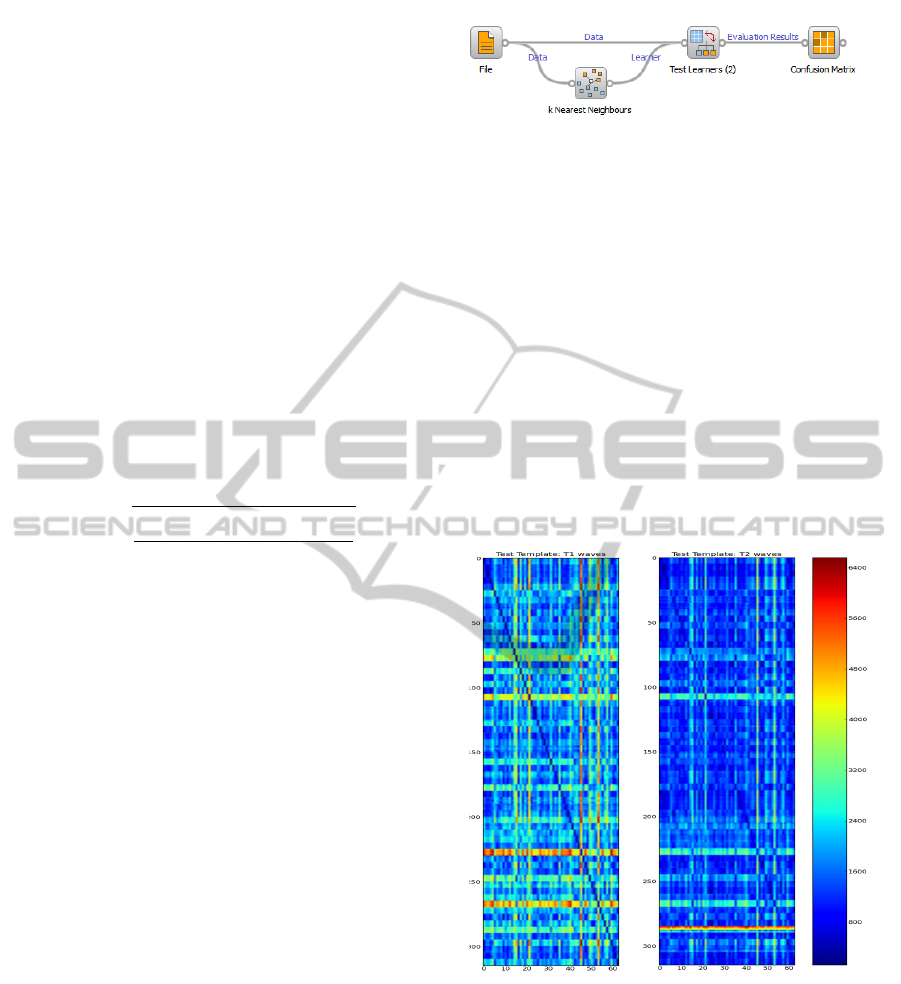
with a ’leave one out’ criterion. Figure 3 shows the
Orange schematics that we used to classify our data
and gather the results.
The File icon represents the data to be classified.
In our case, it represents the distance matrices given
Figure 3: Schematics used in Orange for classification.
as input. The k Nearest Neighbor classifies samples
based on the closest class amongst its k nearest neigh-
bors (we used k=1). The test learner represents the
stage where the data is given is processed by the clas-
sification algorithm and the classifier learns about the
samples and correspondent classes. The confusion
matrix confronts the predictions with the expected re-
sults to return the detailed results of the specified clas-
sifier.
3 RESULTS
Figure 4 presents the distances matrices for test 1 and
test 2 in an image form.
Figure 4: Distance matrices for test 1 and test 2 given as
input to the classifier.
The darker colors represent minimum distance
values, which we associate to the heartbeat intra-
subject distances. For both tests, as we had 5 samples
for each subject to compare to the meanwave tem-
plate, it was ideal to see a diagonal composed with
5 dark cells and all the other cells with lighter colors
(ideally totally white). As we can see in Figure 4, the
test 1 is closer to the ideal result, as this test comprises
waves from the same acquisition both in template and
test sets. In the second test the subjects are not so
ICPRAM2013-InternationalConferenceonPatternRecognitionApplicationsandMethods
632
easily visually identified by the distance metric, and
therefore it is expected to see a decrease in accuracy
for the second test.
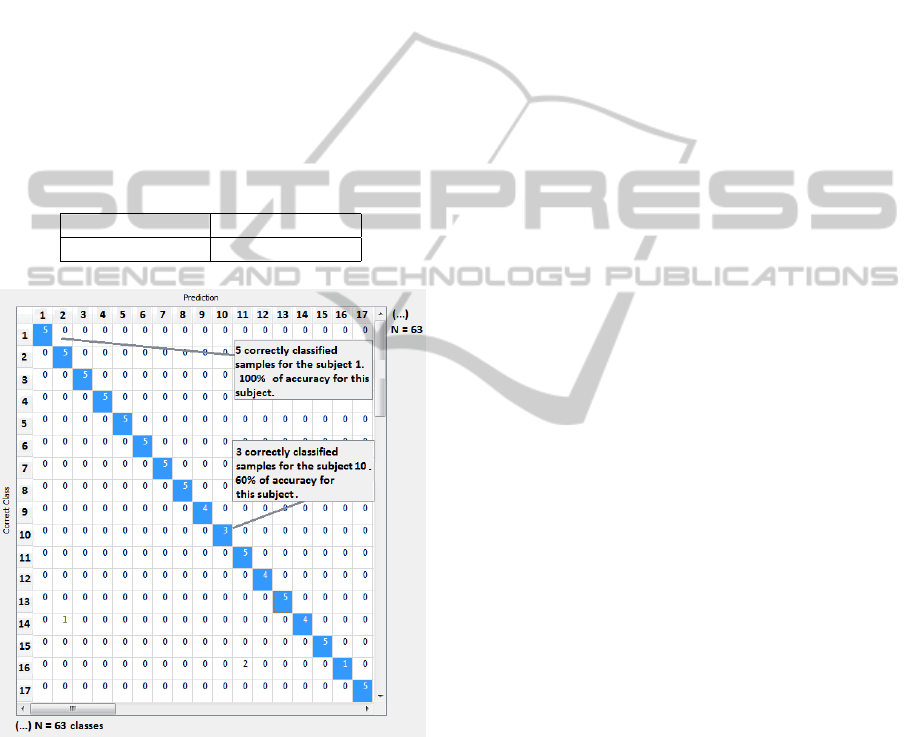
After the learning process in Orange, a confusion
matrix returned the depicted results of the classifier.
An example of that matrix is shown in Figure 5.
This matrix gathers the results of the classification
for each class (each subject). The ideal case was to
have a diagonal always with 5 samples - it represents
that all samples were efficiently classified, as we only
had 5 samples per subject. A cell presenting an infe-
rior value represents that at least one misclassification
was made, associating a sample to other class (at least
one heartbeat meanwave was classified as belonging
to a different subject).
The final classification results for test 1 and 2, con-
cerning all subjects are included in Table 1.
Table 1: Classification accuracy results for test 1 and test 2.
Test Template 1 Test Template 2
95.2% 90.5%
Figure 5: Part of the confusion matrix returned from the
classifier.
4 CONCLUSIONS
In this work we implemented a new biometric classi-
fication procedure based on electrocardiogram (ECG)
heartbeats meanwave’s distances. Our goal was to
successfully use the patterns of ECG heartbeats to
make subjects identification. In order to validate the
developed solutions, the methods were tested in a real
ECG database. The database was composed by two
finger-based ECG acquisitions from 63 subjects. The
acquisitions from each subject were separated by six
month between them. This fact enabled the evalua-
tion of the algorithm accuracy in a test case scenario,
where the test and enrollment template belonged to
the first acquisitions, and a real case scenario where
we used the first acquisitions as the enrollment tem-
plate and the second one as test. Using our approach it
was possible to obtain accuracy rates of 95.2% for the
test scenario (test 1) and 90.5% for the real case sce-
nario (test 2). Compared with a previous state-of-the-
art approach, the results outperform the recent studies
on finger-ECG based identifications. Previous works
present 89% (Chan et al., 2008) and 94.4% (Lourenco
et al., 2011) accuracy.
Future work will be focused on improving the fea-
ture extraction process and add features to the clas-
sifier, such as the correlation between waves or the
intra-subject variability - as we noticed that some sub-
jects had an higher variability in their meanwaves, and
therefore the distance computed isn’t the best feature
per se.
ACKNOWLEDGEMENTS
The authors wold like to thank the Escola Superior
de Sa
´
ude-Cruz Vermelha Portuguesa (ESSCVP) for
the data collections infrastructures and subjects prov-
idence.
REFERENCES
Chan, A., Hamdy, M., Badre, A., and Badee, V. (2008).
Wavelet distance measure for person identification us-
ing electrocardiograms. In IEEE Transactions on In-
strumentation and Measuremen.
Coutinho, D., Fred, A., and Figueiredo, M. (2010). Per-
sonal identification and authentication based on one-
lead ecg using ziv-merhav cross parsing. In 10th In-
ternational Workshop on Pattern Recognition in Infor-
mation Systems.
Jain, A., Hong, L., and Pankanti, S. (2000). Biometric Iden-
tification. Communications of the ACM.
Li, M. and Narayanan, S. (2010). Robust ecg biometrics
by fusing temporal and cepstral information,. In 20th
International Conference on Pattern Recognition.
Lourenco, A., Silva, H., and Fred, A. (2011). Unveiling
the biometric potential of finger-based ecg signals. In
Computational Intelligence and Neuroscience.
Nunes, N., Araujo, T., and Gamboa, H. (2012). Time Series
Clustering Algorithm for Two-Modes Cyclic Biosig-
nals. A. Fred, J. Filipe, and H. Gamboa (Eds.):
Distance-basedAlgorithmforBiometricApplicationsinMeanwavesofSubject'sHeartbeats
633

BIOSTEC 2011, CCIS 273, pp. 233–245. Springer,
Heidelberg.
Orange (2012). http://orange.biolab.si/.
Plataniotis, K., Hatzinakos, D., and Lee, J. (2006). Ecg bio-
metric recognition without fiducial detection. In Bio-
metric Consortium Conference, 2006 Biometrics Sym-
posium.
Silva, H., Gamboa, H., and Fred, A. (2007). Applicability
of lead v2 ecg measurements in biometrics. In Pro-
ceedings of Med-e-Tel.
ICPRAM2013-InternationalConferenceonPatternRecognitionApplicationsandMethods
634
