
Directional Variation of Trabecular Bone in the Femoral Head,
a μ-CT based Approach
Varitis Emmanouil
1
, Sagris Dimitrios
2
, David Constantine
2
and Lontos Antonios
3
1
Mechanical Engineering Department, Aristoteles University of Thessaloniki, Thessaloniki, Greece
2
Mechanical Engineering Department, Technological Education Institute of Serres, Serres, Greece
3
Department of Mechanical Engineering, Frederick University, Nicosia, Cyprus
Keywords: Femoral Head, Cancellous Bone Anisotropy, μ-CT.
Abstract: The structural characteristics of bone are described by features of high complexity, defining the directional
anisotropy of its mechanical properties. This phenomenon originates in the orientation of collagen fibers and
osteons within the cortical tissue and the trabecular morphology of cancellous bone. the purpose of this
study was the examination of the geometrical anisotropy of cancellous bone in the femoral head. 28 femoral
heads, harvested during hip replacement of 17 women and 11 men, were studied in total. Cylindrical
specimens of 11mm in diameter were extracted perpendicular to the fovea capitis femoris and subjected to
micro Computed Tomography (μ-CT). a 11mm sphere was isolated from all samples and the cross-sectional
area of the sphere was studied for 8 predefined regions, corresponding to planes perpendicular to principal
loading directions of the hip joint. Significant topographical variations of trabecular bone structure in
different subchondral regions were determined. in the superior region, the trabecular bone strength was the
highest, while the inferior region exhibited the lowest bone strength and medial and lateral regions had
intermittent magnitudes. No significant difference in anisotropy was found between male and female
samples, although the absolute values were greater in males. The obtained results cohere with recent
literature data of osteopenetration experiments in these directions.
1 INTRODUCTION
Trabecular bone is a major load bearing tissue of our
musculoskeletal system. When modelling
anatomical sites with large bones (Khosla et al.,
2006) or structures consisting of both, cancellous
and cortical bone (Tsouknidas et al., 2012a) the
simulation is less sensitive on micro-architectural
variations due to the thicker cortices. When
assessing however, therapeutic efficiency, implant
stability or fragility fractures, cancellous bone
remains a major qualitative determinant.
The proximal femur is an anatomical site of
major interest to clinicians as its mechanical failure
is one of the most common reasons for pain and
morbidity (Rockwood et al., 1990); (Cooper et al.,
1992). The primary bearing surface in the hip joint is
the articular cartilage. The subchondral cancellous
bone is located deep inside the articular cartilage and
the percentage of the load carried by this tissue
varies from 4% at the base of the neck to as much as
70% in the subcapital region (Lotz et al., 1995). This
suggests that cancellous bone plays an important
role in the mechanical strength of the proximal
femur and especially of the femoral head.
Cancellous bone however is not homogenous, it is
characterized by a microstructural anisotropy, that
drastically affects its biomechanical response to
loading. There exists a consensus in literature, that
trabecular bone is organized and oriented, in order to
adapt to the mechanical loads it is subjected to, this
process is based on continuous bone resorption
followed by bone formation during remodeling
(Raisz, 2005).
The purpose of this study was to examine the
micro architectural anisotropy of cancellous bone in
the femoral head and detect possible variations
based on the patients’ Bone Mineral Density
(BMD).
2 MATERIALS AND METHODS
Twenty-eight femoral heads from 17 female and 11
male patients, undergoing total hip arthroplasty,
were studied. The mean age of the patients was 75.6
237
Emmanouil V., Dimitrios S., Constantine D. and Antonios L..
Directional Variation of Trabecular Bone in the Femoral Head, a µ-CT based Approach.
DOI: 10.5220/0004327702370241
In Proceedings of the International Conference on Bioinformatics Models, Methods and Algorithms (BIOINFORMATICS-2013), pages 237-241
ISBN: 978-989-8565-35-8
Copyright
c
2013 SCITEPRESS (Science and Technology Publications, Lda.)
years (range, 63 – 88 years). The specimens were
harvested during operation (Tsouknidas et al.,
2012b) and frozen/stored at -60
o
C, upon receiving
written consent from all patients. None of the
patients had been diagnosed with any type of
metabolic disease or cancer and no bone cysts were
apparent in any of the femoral heads. All cases with
evidence of osteoarthritis, rheumatoid arthritis,
avascular necrosis, osteomalacia or secondary
osteoporosis due to corticosteroids were excluded
from the study. Cylindrical specimens were
extracted perpendicular to the medial region, by
means of a hole saw.
Prior to extraction, the patients’ Bone Mineral
Density (BMD) was measured through Dual-energy
X-ray absorptiometry (DXA) and recorded for
further use. a major strength of this study is reflected
by the wide range of BMD considered, varying in
both gender and patient condition (from healthy to
osteoporotic). This is due to the fact that trabecular
bone is a highly porous tissue differing substantially
not only across individuals but also between
anatomical sites and thus varying BMDs can be used
for studying many applications (Tsouknidas et al.,
2011).
All harvested specimens were immersed in a 200
kHz ultrasonic bath with a 1% enzyme solution by
Alconox to assimilate the proteinaceous tissue and
repeatedly cleaned until completely defatted
(Nauman et al., 1999). Upon drying, the specimen
was weighted with a micro-scale of a 100μg
resolution (Mettler Toledo) and their apparent
density (ρ
ap
) calculated using equation (1).
ߩ
ൌ
݉
ௗ
ߨ݀
ଶ
݄
(1)
where m
d
represents the weight of the dry specimen
d and h its diameter and height respectively. This
resulted in an apparent density of the specimens
ranging from 2.19 to 3.35 g/cm
3
, as presented in
table 1.
The specimen was scanned with a μ-CT device
(Werth TomoScope® HV Compact) to reconstruct
its 3D shape. The measurements were conducted at a
spatial resolution of 10μm, a high image resolution
was chosen as there exists a consensus throughout
literature that measurement accuracy directly affects
geometric discretization and model convergence
(Bevill and Keaveney, 2009). Data acquisition was
in accordance to DICOM (Digital Imaging and
Communications in Medicine) this allowed the
conversion of multiple 2D images into a 3D volume.
Interpolation of the obtained measurements ensured
higher representation accuracy, even though this
process did not result in higher resolution of the
sample. the smoother representation facilitated the
distinct removal of the remaining soft tissue, which
was either not visible or accessible during the initial
defatting process. a semi-automated segmentation
technique, supported by manual correction of the
threshold results was followed. during this multi
threshold segmentation, the mean grey-scale within
the image is calculated and sensitive edge detection
filters are employed (Rathnayaka et al., 2010);
(Canny, 1986), to distinguish the apparent tissue
types. The reconstructed sample consisted of
porosity ranging from 68.52 to 91.38%. All the
determined characteristics of the sample are in
agreement with data found in literature (Baroud et
al., 2004).
Table 1: Volumetric data obtained from the measurements,
reported as mean ± standard deviation.
Gender BMD ρ
a
p
[g/cm
3
] BV/TV
Male 0.62±0.07 3.23±0.62 0.24±0.05
Female 0.49±0.11 2.47±0.89 0.21±0.06
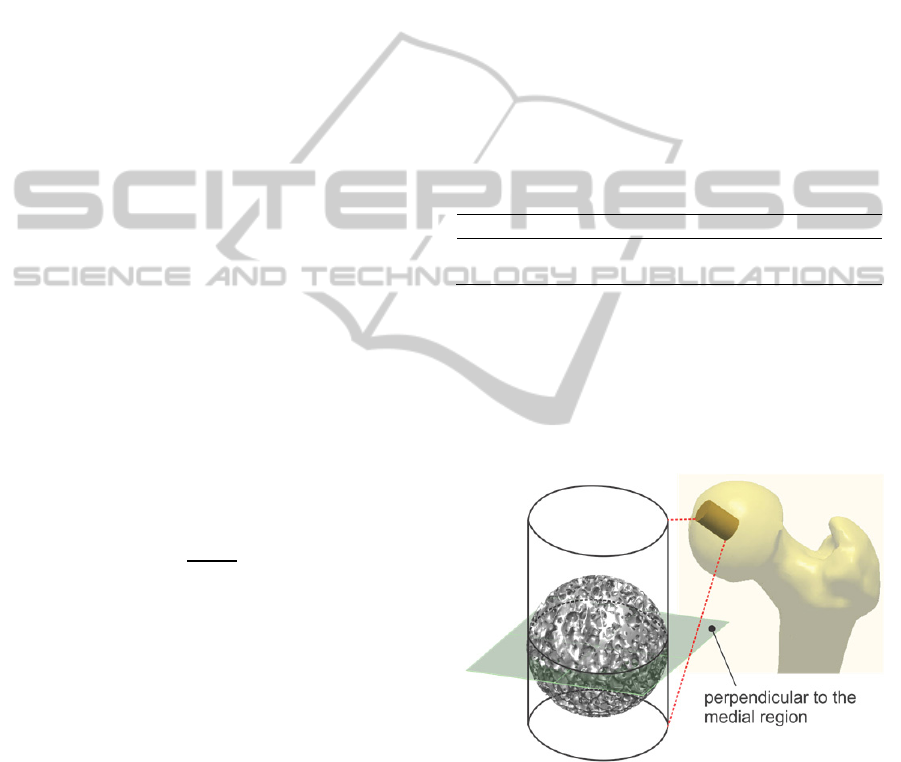
The length of the specimens was approximately
25mm and upon scanning, a sphere within the
cylinder was isolated, as illustrated in figure 1. the
position of the sphere was carefully selected in order
to represent the centre of the femoral head for each
of the samples. This allowed direct comparison of
the samples in terms of cross-sectional bone area.
Figure 1: Extraction direction of the harvested specimens.
In our study eight different orientations,
representing directions perpendicular to a specific
region of the femoral head were examined, as
demonstrated in figure 2. the medial region (reg-1)
which is located in fovea capitis femoris, the inferior
region (reg-2), the medial-superior region (reg-3),
the superior region (reg-4), the anterior region (reg-
5), the anterior-medial region (reg-6), the posterior-
medial region (reg-7) and the posterior region (reg-
BIOINFORMATICS2013-InternationalConferenceonBioinformaticsModels,MethodsandAlgorithms
238
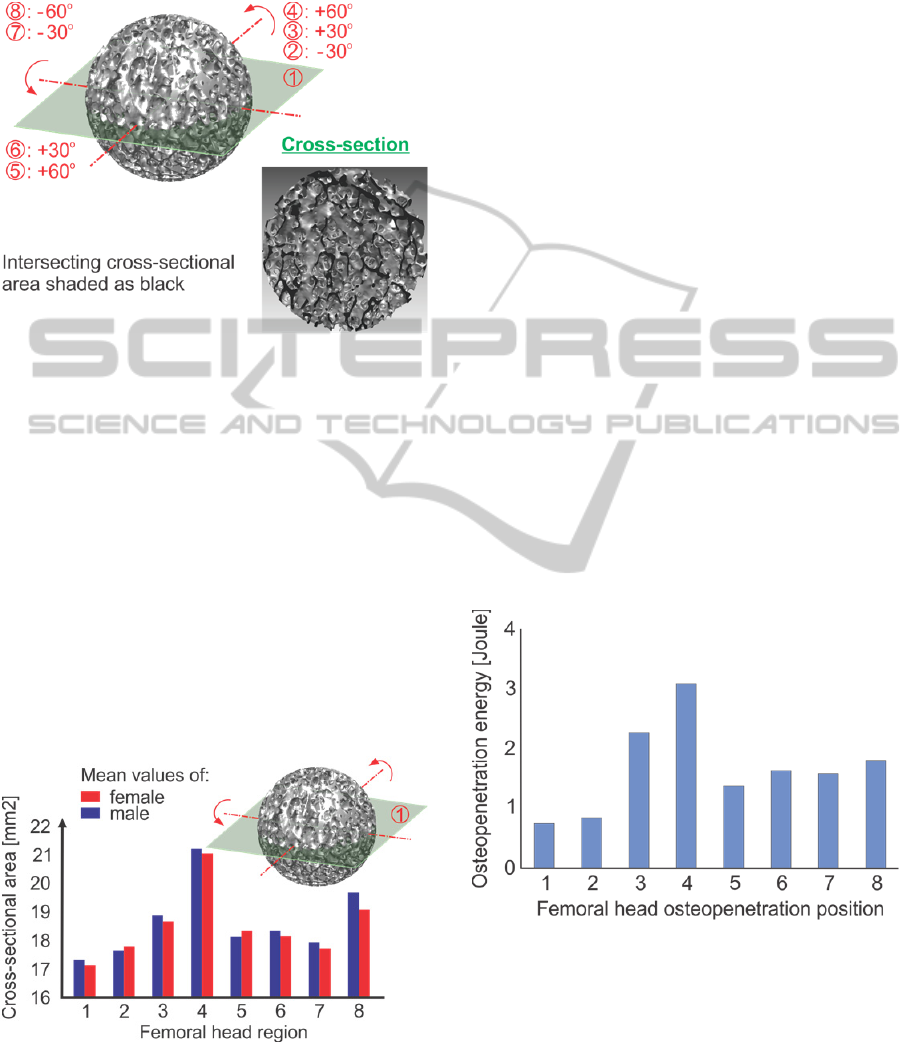
8). The 8 different sites represent regions subjected
to different amounts of loading in vivo (Thomas and
Daniel, 1983); (Hodge et al., 1986).
Figure 2: Trabecular sphere and cross-sectional area.
3 RESULTS
There were significant topographical variations of
trabecular bone strength in different subchondral
bone regions.
In the medial region (1) and the inferior region
(2) the mean cross-sectional area was the lowest,
wherease the highest were registered in the superior
(4) and medial-superior region (3). The anterior
region (5), anterior-medial (6) and posterior-medial
region (7) exhibited average values, which were
slightly enhanced in the posterior region (8). The
results are symmetrized for both male and female
donors in figure 3.
Figure 3: Mean cross-sectional areas registered for the 8
primary subchondral regions.
According to these results, the 2D trabecular
bone density in the superior and medial-superior
regions is higher and thus bone strength is predicted
to be elevated in this region which is expected to
compare favourably to the fovea capitis femoris. The
bone density is lower in the orientation of the fovea
capitis femoris which should prove more susceptible
to compression, whereas anterior and posterior
regions reflect similar cross-sectional areas.
No significant difference in anisotropy was
found between male and female samples, although
the absolute values were greater in males.
4 DISCUSSION
In this study eight different regions of the femoral
head were examined. The eight sites represent
regions subjected to different amounts of in vivo
loading. The superior region being the most heavily
loaded, posterior and anterior partially loaded and
medial and inferior being the least loaded. Our
findings are in agreement with loading distribution
described in other studies (Thomas and Daniel,
1983); (Hodge et al., 1986) and converge
exceptionally with a recent study (Tsouknidas et al.,
2012c), investigating the energy required for
osteopenetration in the aforementioned sites, as
indicated in figure 4. The figure represents the mean
values of penetration energy required throughout the
tested specimens.
Figure 4: The mean values of penetration energy in the 8
regions.
The motivation behind our study is to correlate
the attained values to architectural metrics which can
be measured through 3D distance transformation
techniques
(Bevill and Keaveney, 2009). These
characteristics can be easily obtained through
porosity analysis modules, integrated in the
visualisation software of contemporary CT devises,
DirectionalVariationofTrabecularBoneintheFemoralHead,aμ-CTbasedApproach
239

providing physicians with a valuable and non-
invasive assessment tool for bone quality and
strength.
An independent verification of our results is of
course required and foreseen. in this context micro
finite element simulations will be setup, to correlate
our image analysis to compressive strength of the
specimens. a verification of these models will be
based on uniaxial compressive experiments of the
harvested samples, conducted only in the primary
direction (1), due to the destructive nature of the
tests.
Brown et al. (1980) and Martens et al. (1983)
performed compression tests by loading in three
directions: anterior-posterior, superior-inferior and
medial-lateral. They shown that anisotropy was
evident and increase in stiffness was found in the
regions traversed by the primary trabecular system
(Brown et al., 1980); (Martens et al., 1983).
However, in their studies bone specimens were
obtained from nonspecific regions of the entire
femoral heads. in our study we examined eight
different but well defined orientations with similar
positioning within the femoral structure. Sugita et al.
(1999) examined the differences in anisotropy in
osteoporotic bone in the primary compressive group
of the femoral head. They found increased values of
compressive stiffness in the parallel loading group
compared with the perpendicular loading group, but
the anisotropic behaviour of cancellous bone is
reduced, and the femoral head became isotropic as
the bone density decreased (e.g. in osteoporosis).
The anisotropy of vertebral bodies was also
examined in the literature. Mosekilde and Viidik
(1985), found that bone strength was greater in the
vertical than in the transverse direction.
Conclusively, we examined geometrical
anisotropy of trabecular bone and found this to
represent an important characteristic of this severely
inhomogeneous structure. the conversion of our
results with previous experimental findings,
strengthens our hypothesis that micro scale imaging
of the femoral head, at limited spatial resolution,
may be used as an indicator of both, bone strength
and anisotropy.
ACKNOWLEDGEMENTS
The authors would like to thank Dr. A. Tsouknidas
of the Aristotle University of Thessaloniki for his
contribution during the setup and preparation of this
manuscript, as well as Dr. K. Anagnostidis for
providing the bone samples.
REFERENCES
Khosla, S., Riggs, B. L., Atkinson, E. J., Oberg, A.L.,
McDaniel, L. J., Holets, M., Peterson, J. M., Melton,
L.J. 3
rd
, 2006. Effects of sex and age on bone
microstructure at the ultradistal radius: a population-
based noninvasive in vivo assessment. J Bone Miner
Res 21(1), 124-131.
Tsouknidas, A., Michailidis, N., Savvakis, S.,
Anagnostidis, K., Bouzakis, K.-D., Kapetanos, G.,
2012. A finite element model technique to determine
the mechanical response of a lumbar spine segment
under complex loads. J Appl Biomech 28 (4), 448-
456.
Rockwood, P. R., Horne, J. G., Cryer, C., 1990. Hip
Fractures: a future epidemic? J Orthop Trauma 4, 388-
396.
Cooper, C., Campion, G., Melton, L. J., 1992. Hip
fractures in the elderly: a word- wide projection.
Osteopor Int 2, 285-289.
Lotz, J. C., Cheal, E. J., 1995. Hayes W. C. Stress
distribution within the proximal femur during gait and
falls: implication for osteoporotic fracture. Osteopor
Int 5, 252-261.
Raisz, L., 2005. Pathogenesis of osteoporosis: concepts,
conflicts, and prospects. Journal of Clinical
Investigation 115 (12), 3318–3325.
Tsouknidas, A., Anagnostidis, K., Maliaris, G.,
Michailidis, N., 2012. Fracture risk in the femoral hip
region: a finite element analysis supported
experimental approach. J Biomech 45 (11), 1959-
1964.
Tsouknidas, A., Maropoulos, S., Savvakis, S., Michailidis,
N., 2011. FEM assisted evaluation of PMMA and
Ti6Al4V as materials for cranioplasty resulting
mechanical behaviour and the neurocranial protection.
Bio-Med Mater Eng 21 (3), 139-147.
Nauman, E. A., Fong, K. E., Keaveny, T. M., 1999.
Dependence of intertrabecular permeability on flow
direction and anatomic site. Ann Biomed Eng. 27(4),
517-524.
Bevill, G., Keaveney, T. M., 2009. Trabecular bone
strength predictions using finite element analysis of
micro-scale images at limited spatial resolution. Bone
44, 579-584.
Rathnayaka. K., Sahama, T., Schuetz, M. A., Schmutz, B.,
2010. Effects of CT image segmentation methods on
the accuracy of long bone 3D reconstructions. Med
Eng Phys 33(2), 226–233.
Canny, J., 1986. A computational approach to edge
detection. IEEE T Pattern Anal 8(6), 679–698.
Baroud, G., Falk, R., Crookshank, M., Sponagel, S.,
Steffen, T., 2004. Experimental and theoretical
investigation of directional permeability of human
vertebral cancellous bone for cement infiltration, J
Biomech 37(2), 189-196.
Thomas, D. B., Daniel, T. S., 1983. In vitro contact stress
distributions in the natural human hip. J Biomech 16,
373-384.
Hodge, W. H., Fijan, R. S., Carlson, K. L., Burgess, R. G.,
BIOINFORMATICS2013-InternationalConferenceonBioinformaticsModels,MethodsandAlgorithms
240

Harris, W.H., Mann, R.W., 1986. Contact pressures in
the human hip joint measured in vivo. Proc Natl Acad
Sci USA 83, 2879-2883.
Tsouknidas, A., Anagnostidis, K., Michailidis, N., 2012.
off-axis mechanical anisotropy of cancellous bone in
the femoral head. J Biomech 45(S 1), S273.
Brown, T. D., Ferguson, A.B., 1980. Mechanical property
distributions in the cancellous bone of the proximal
femur. Acta Orthop Scand 51, 429-37.
Martens, M., Van, Audekercke, R., De Meester, P.,
Mulier, J. C., 1983. The mechanical characteristics of
cancellous bone at the upper femoral region. J
Biomech 12, 971-983.
Sugita, H., Oka, M., Toguchida, J., Nakamura, T., Ueo, T.,
Hayami, T., 1999. Anisotropy of osteoporotic
Cancellous Bone. Bone 24, 513-516.
Mosekilde, L., Viidik, A., 1985. Correlation between the
compressive strength of iliac and vertebral trabecular
bone in normal individuals. Bone 6, 291-296.
DirectionalVariationofTrabecularBoneintheFemoralHead,aμ-CTbasedApproach
241
