
Social Cues in Group Formation and Local Interactions for Collective
Activity Analysis
Khai N. Tran, Apurva Bedagkar-Gala, Ioannis A. Kadadiaris and Shishir K. Shah
Quantitative Imaging Laboratory, Department of Computer Science, University of Houston,
4800 Calhoun Rd, Houston, TX 77204, U.S.A.
Keywords:
Group Activity Recognition, Social Signaling, Graph Clustering, Local Group Activity Descriptor.
Abstract:
This paper presents a novel and efficient framework for group activity analysis. People in a scene can be
intuitively represented by an undirected graph where vertices are people and the edges between two people are
weighted by how much they are interacting. Social signaling cues are used to describe the degree of interaction
between people. We propose a graph-based clustering algorithm to discover interacting groups in crowded
scenes. The grouping of people in the scene serves to isolate the groups engaged in the dominant activity,
effectively eliminating dataset contamination. Using discovered interacting groups, we create a descriptor
capturing the motion and interaction of people within it. A bag-of-words approach is used to represent group
activity and a SVM classifier is used for activity recognition. The proposed framework is evaluated in its
ability to discover interacting groups and perform group activity recognition using two public datasets. The
results of both the steps show that our method outperforms state-of-the-art methods for group discovery and
achieves recognition rates comparable to state-of-the-art methods for group activity recognition.
1 INTRODUCTION
Human activity analysis is one of the most challeng-
ing problems that has received considerable atten-
tion from the computer vision community in recent
years. Its applications are diverse, spanning from its
use in activity understanding for intelligent surveil-
lance systems to improving human-computer inter-
actions. Recent approaches have demonstrated great
success in recognizing actions performed by one indi-
vidual (Ryoo and Aggarwal, 2011; Tran et al., 2012).
However, a vast number of activities involve multiple
people and their interactions. This poses a far more
challenging problem due to variations in the number
of people involved, and more specifically the differ-
ent human actions and social interactions exhibited
within people and groups.
Group activities are characterized by actions of
individuals within their group and their interactions
with each other as well as the environment. The en-
vironment in which these groups exist provide impor-
tant contextual information that can be invaluable in
recognizing the group activities. These activities can
be described by location and movement of individu-
als. However, understanding groups and their activ-
ities is not limited to only analyzing movements of
individuals in group. Most of the current work that
has gone into group activity recognition is based on
a combination of actions of individuals and contex-
tual information within the group (Lan et al., 2010;
Lan et al., 2011; Choi et al., 2011). The contextual
information is most often encoded by the inter-person
interaction within the group. In addition, there might
exist more than one group in a scene and each group
might exhibit a specific activity. Most of the existing
approaches treat group activity recognition as a sin-
gular activity performed by most people visible in a
scene. This is not true especially in crowded envi-
ronments typical of surveillance scenes. There might
exist people in the scene that are not part of the group
or groups that are engaged in the dominant activity in
the scene. For example, from Fig. 1 we can see the
dominant activity in the top row is Crossing but there
are people Waiting in the scene. Similarly, the frames
in the middle row are associated with Talking activ-
ity but there exist people marked in the red boxes that
are not engaged in Talking. Frames in the third row,
show the dominant activity is Jogging but some peo-
ple are Talking. If all the people in the scene are used
to analyze the group activity it may create misleading
recognition of activity due to the underlying noisy or
contaminated data. In order to improve the granular-
539
N. Tran K., Bedagkar-Gala A., A. Kakadiaris I. and K. Shah S..
Social Cues in Group Formation and Local Interactions for Collective Activity Analysis.
DOI: 10.5220/0004256505390548
In Proceedings of the International Conference on Computer Vision Theory and Applications (VISAPP-2013), pages 539-548
ISBN: 978-989-8565-47-1
Copyright
c
2013 SCITEPRESS (Science and Technology Publications, Lda.)

ity of analyzing group activities, it is important to be
able to detect the groups performing the dominant ac-
tion.
Perspectives from sociology, psychology and
computer vision suggest that group activities can be
understood by investigating a subject in the context of
social signaling constraints (Smith et al., 2008; Hel-
bing and Moln
´
ar, 1995; Cristani et al., 2011; Faren-
zena et al., 2009b). Exploring the spatial and direc-
tional relationships between people can facilitate the
detection of social interactions in a group. Leverag-
ing the notion of social signaling cues, we develop a
two-step top-down process for group activity analy-
sis: first we discover the interacting groups based on
the spatial and orientational relationships between in-
dividuals, and in the next step, we analyze the local
interactions in each group to recognize their group
activity. This approach serves two purposes, first it
helps to eliminate the clutter in scenes that can mis-
lead the group activity descriptor and the second is to
localize the interacting groups in crowded scenes in
order to simplify the activity inference process.
In this paper, we propose a graph representation
of human interactions to discover interacting groups
in the scene. The proposed representation incorpo-
rates the social distance (Was et al., 2006) cue in mod-
eling social interactions and is generative so many
robust graph algorithms can be applied to detect the
groups efficiently. Our representation is motivated by
the recent success of social signal processing (Cristani
et al., 2011; Farenzena et al., 2009b) and our clus-
tering algorithm is inspired by the fundamentals of
dominant set for clustering (Pavan and Pelillo, 2007).
Further, using the detected groups we propose a novel
group activity representation along with an efficient
recognition algorithm to learn and classify group ac-
tivities.
The contributions of our work are:
1. A graph representation for human interactions
along with dominant set based clustering algo-
rithm to discover interacting groups. We propose
a new social interaction cue based representation
using graph theory where each vertex represents
one person and weighted edges describe the in-
teraction between any two people in a group. We
use the dominant set based clustering algorithm to
discover the interacting groups in the scene.
2. A group activity descriptor along with bag of
words recognition framework. We propose a
novel group activity descriptor that encodes social
interaction cues and motion information of people
in particular interacting groups that are discovered
by our first contribution.
The rest of the paper is organized as follows. We
review related work on group activity analysis in sec-
tion 2. Section 3 describes the discovery of interacting
groups in the scene and its use in representing group
activity along with the classification algorithm used
to address the activity recognition task. Experimen-
tal results and evaluations are presented in Section 4.
Finally, Section 5 concludes the paper.
2 RELATED WORK
Group activity can often be considered a multistep
process, one that involves individual person activity,
individuals forming meaningful groups, interaction
between individuals and interactions between groups.
Recent efforts have led to success in understanding
each of these steps. Ryoo et al. (Ryoo and Aggar-
wal, 2011) present an approach that splits group ac-
tivity into sub-events like person activity and person
to person interactions. Each portion is represented us-
ing context free grammar and the probability of their
occurrence given a group activity or time periods. A
hierarchical recognition algorithm based on Markov
chain Monte Carlo density sampling technique is de-
veloped. The technique identifies the groups and
group activity simultaneously. Multi-camera multi-
target tracks are used to generate dissimilarity mea-
sure between people, which in turn are used to cluster
them into groups in (Chang et al., 2010). Group activ-
ities are recognized by treating the group as an entity
and analyzing the behavior of the group over time. An
action context descriptor, which is a combination of a
person’s shape, motion and context, i.e. the behav-
ior of people in a spatio-temporal region around that
person, is proposed in (Lan et al., 2010). The con-
text descriptor is centered around a person of interest.
The person descriptor is based on a bag-of-words ap-
proach and group activity analysis is treated as a re-
trieval problem based on rankSVM.
The spatial distribution, pose and motion of in-
dividuals in a scene are used to analyze group ac-
tivity in (Choi et al., 2009). Spatio-temporal de-
scriptor again centered on a person of interest or an
anchor is used for classification of the group activ-
ity. The track of every person in the scene and their
pose is estimated with the help of camera parameters.
The descriptor is basically histograms of people and
their poses in different spatial bins around the anchor.
These histograms are concatenated over the video to
capture the temporal nature of the activities. SVM
using pyramid kernels is used for classification. The
same descriptor is leveraged in (Choi et al., 2011) but
Random Forest classification is used for group activ-
ity analysis. In addition, random forest structure is
VISAPP2013-InternationalConferenceonComputerVisionTheoryandApplications
540
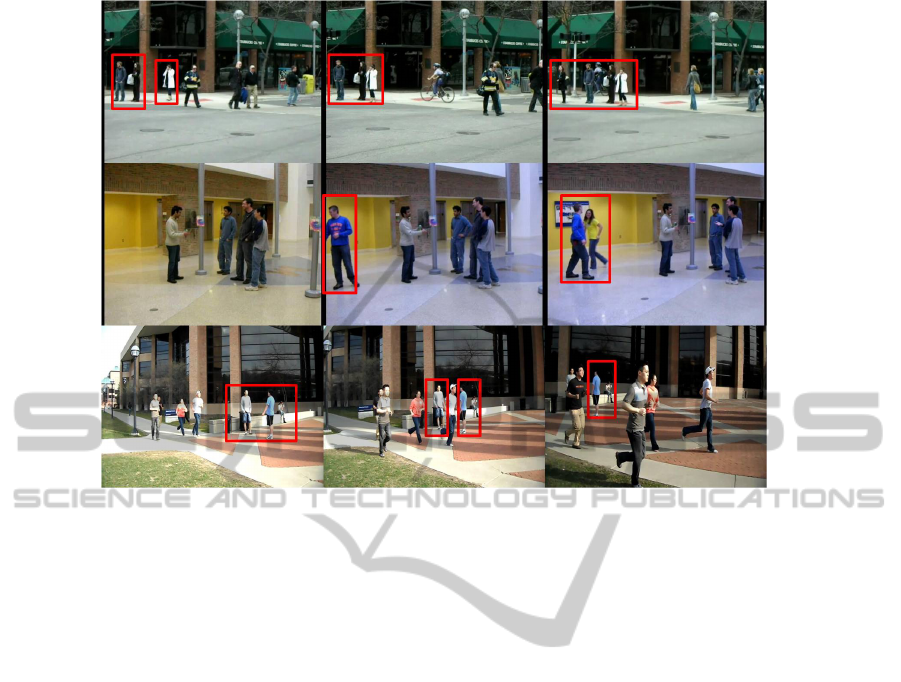
Figure 1: Example frames of noisy or contaminated data in Collective Activity dataset (Choi et al., 2009). The red boxes
depict the people not engaged the dominant activity.
used to randomly sample the spatio-temporal regions
to pick most discriminative features. 3D markov ran-
dom field is used to regularize and localize the group
activities in the video.
The method proposed in (Gaur et al., 2011) repre-
sents group activities using spatio-temporal features
and the video is split into temporal bins. The video is
then represented as a temporally ordered string of fea-
ture bins. Each feature bin is a graphical structure of
spatial arrangement of local features. The group ac-
tivity recognition is established by a two-step process,
first graph based spectral techniques are used to match
local feature bins and the final recognition is done
using a dynamic programming framework. Video is
represented as a spatio-temporal graph in which the
nodes correspond to homogenous sub volumes of the
video and the edges represent the temporal and spa-
tial relationships between the sub volumes in (Brendel
and Todorovic, 2011). Prototypical graphs are learnt
and the associated probability functions. Learning
and inference are formulated within the same frame-
work. A chains model based group activity recog-
nition is proposed in (Amer and Todorovic, 2011).
Spatiotemporal voxels of the video are used to build
the activity descriptor and a generative model is used
to localize the relevant descriptors in time and space
to better describe the activity. A two-tier MAP infer-
ence algorithm is proposed for the final recognition
step.
Most of the work that has gone into group activity
analysis infers the group level activity by recognizing
the actions performed by the people in the group and
their interactions. But the activity of the group as a
single entity is not characterized by a single descrip-
tor. We approach the problem from a social signal-
ing standpoint and design a descriptor that captures
the group activity as a whole. Group activity can be
better inferred from social interactions cues between
people present in the scene. First, meaningful groups
are identified from the videos using spatial and orien-
tational arrangement of people in the scene as a cue
based on social signaling principles (Farenzena et al.,
2009b; Farenzena et al., 2009a). The non-dominant
groups are discarded in order to eliminate data con-
tamination. Once the relevant groups are identified a
group activity descriptor is build for each group in or-
der to determine the collective activity. The activity
descriptor is built using the 3D location, head pose,
and motion of each person forming the group.
3 APPROACH
In this paper, we mainly focus on high-level analysis
of group activities. Thus, we assume that the trajec-
tories of people in 3D space and the head poses are
available.
SocialCuesinGroupFormationandLocalInteractionsforCollectiveActivityAnalysis
541
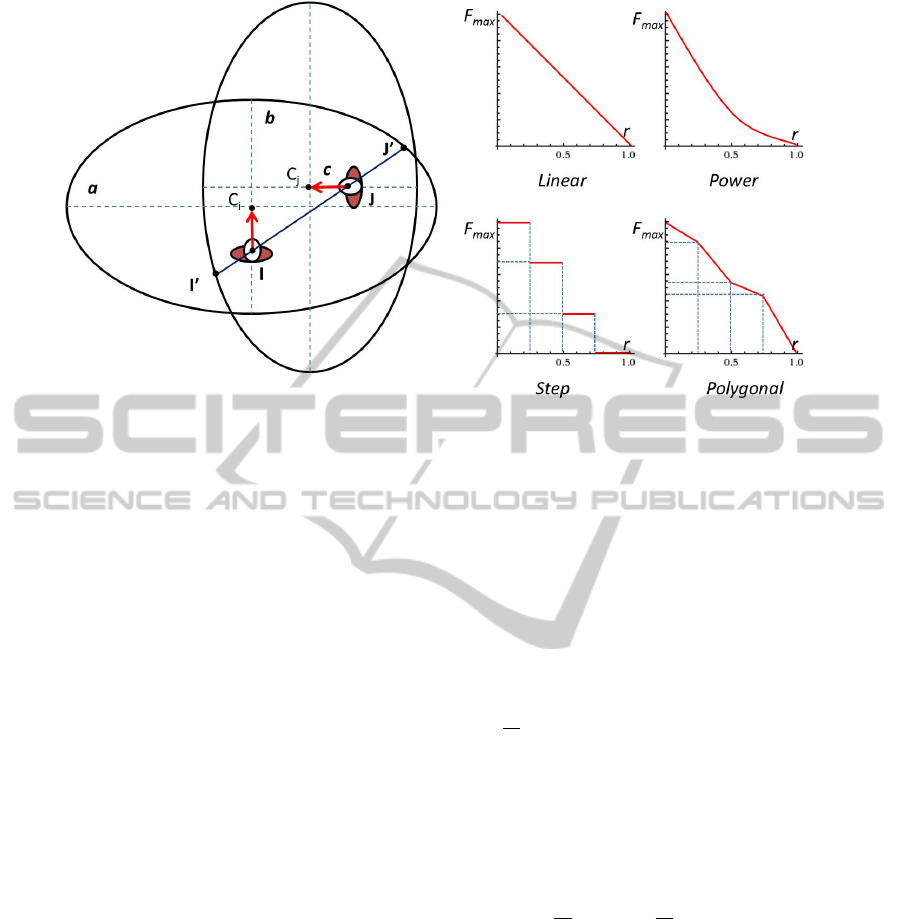
Figure 2: Depiction of social interaction area between 2 people and 4 types of social interaction functions.
3.1 Social Interaction Cues based
Graph Representation
In general, the analysis of complex group activity is
a challenging task, due to noisy observations and un-
observed communications between people. In order
to understand which people in the scene form mean-
ingful groups, we use concepts from proxemics (Was
et al., 2006), that basically define different social dis-
tances: intimate distance, person distance, social dis-
tance and public distance. Using proxemics to con-
strain the space and context based relationships be-
tween people allows us to discover interacting groups
with respect to the environment and other people in
the scene. As per cognitive and social signaling stud-
ies, a person is considered as interacting with another
person when they are close enough and at least one of
them is looking at the other (Farenzena et al., 2009b;
Vinciarelli et al., 2008). Building on these principles,
we propose to quantitatively measure the extent of se-
mantic relationship or interaction between people in
the scene. An undirected weighted graph is built us-
ing all the people in the scene as vertices and the con-
nections between them are weighted using the mea-
sured relationship or interaction.
Let N = {1, ...,n} be the set of all the people in
the scene. Given the head pose of person i, we de-
fine the ellipse E(C
i
,a,b). This ellipse defines the so-
cial interaction area of this person, where C
i
is center
of the ellipse and (a, b) is major and minor radii of
the ellipse, respectively. Keeping in mind that a per-
son’s field of view has a wider range sideways and in
the front as opposed to the back, the social interaction
area is asymmetric around a person. Therefore ellipse
center and person location are not identical. The so-
cial interaction area is shifted forward along line of
pose of the considered person by some distance c as
depicted in Fig. 2.
For any two people i and j, we introduce the nor-
malized distance r
i j
within the social interaction area
of person i as a ratio of the distance between 2 peo-
ple to the distance between person i and the point of
projection of person j’s center on the boundary of the
social area of person i. A person i is considered as
interacting with person j if the normalized distance
r
i j
=
IJ
IJ
0
between them is within the interval [0,1]. In-
tuitively, the closer the people the stronger their inter-
action or chance of a relationship. Thus, we summa-
rize the interaction between two people i and j using
weights computed as the sum of two distance social
force functions:
w(i, j) = F
s
(r
i j
) + F
s
(r
ji
) (1)
where r
i j
=
IJ
IJ
0
and r
ji
=
JI
JI
0
. The distance social force
function F
s
(r) is inversely proportional to the normal-
ized distance r and can be modeled using a linear,
step, power or polygonal function (Was et al., 2006)
as depicted in Fig. 2. As a result, the weight of an
edge between any two people is the quantitative mea-
surement of their interaction. Fig. 3 depicts the graph
representation of group activity for every single frame
in a video.
3.2 Interacting Group Discovery
Using the above graph representation of people in
a scene, we propose a graph-based clustering algo-
rithm inspired by the principle of dominant set in
VISAPP2013-InternationalConferenceonComputerVisionTheoryandApplications
542
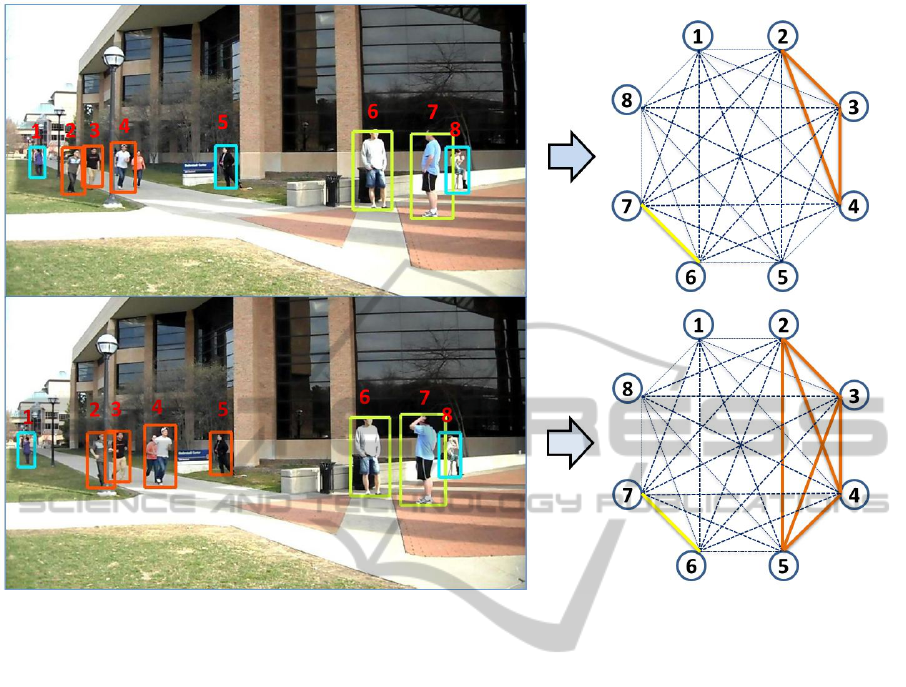
Figure 3: Representation of human interactions in a group as an undirected edge-weighted graph.
graphs (Pavan and Pelillo, 2007) to discover socially
interacting groups. By definition, a cluster should
have high internal homogeneity and should have high
inhomogeneity between the entities in the cluster and
those outside (Pavan and Pelillo, 2007). Similarly,
socially interacting groups should have strong inter-
actions within its members and should have weaker
interactions with those outside the group. Using this
intuition, we pose the problem of discovering inter-
acting groups as searching for dominant sets of max-
imally interacting nodes in a graph. As a result, we
successfully cast the problem of discovering interact-
ing groups as a graph based clustering problem using
the dominant set concept which is completely solved
in (Pavan and Pelillo, 2007) using continuous opti-
mization technique of replicator dynamics. We begin
by finding the first dominant set in the graph, followed
by removing that set of vertices from the graph, and
iteratively repeating this process with the remaining
set of vertices, until there remain no dominant sets in
the graph. The leftover vertices after the removal of
found dominant sets represents persons who are not
associated with any group. Fig. 4 illustrates the pro-
cess of finding interacting groups using dominant set
algorithm.
3.3 Local Group Activity Descriptor
Given the discovered interacting groups, we are inter-
ested in using this information for group activity anal-
ysis. The social interactions measured per frame not
only provide us the spatial grouping information but
also allow us to localize the distinct interactions in the
scene. To capture the activity within the discovered
groups, we propose the Local Group Activity (LGA)
descriptor which encodes the mutual poses of people
and their movements within the group. Let g denote
one of the K discovered interacting groups at time t.
The number of people in the group g is given by n.
The activity of each group is captured by its LGA de-
scriptor. The motion information of people in a group
is a very important cue in order to recognize specific
activities. For example, consider two activities Jog-
ging and Queuing. Sometimes they have the same
collective poses indicating that people are following
each other. Without incorporating motion informa-
tion in representing those two activities, we may not
be able to distinguish between them. Thus, we want to
encode the motion information along with pose distri-
bution to construct a compact descriptor to represent
group activity for recognition. The set of distinct pos-
sible head poses is denoted by P = {1, ..., p}. The
SocialCuesinGroupFormationandLocalInteractionsforCollectiveActivityAnalysis
543
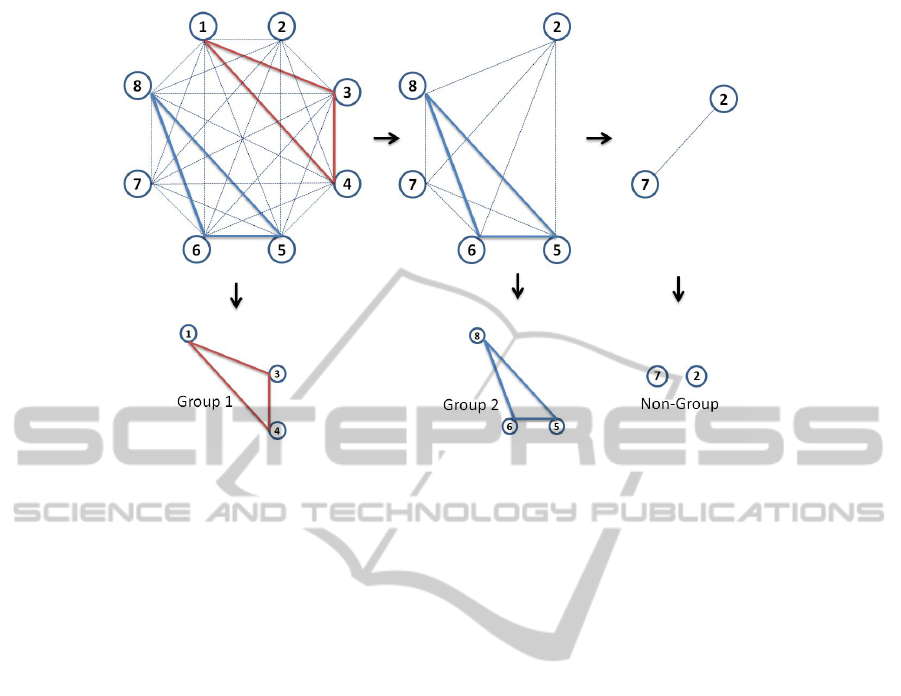
Figure 4: Illustration of Interacting Group Discovery: Two groups are discovered and two non-group people who do not
belong to any group. The non-group people are eliminated in analyzing group activity.
motion information of all the people in the group is
defined as
−→
V = {
−→
V
1
,...,
−→
V
n
}. The LGA descriptor is
a 2D symmetric histogram of size p × p and value of
each bin (x,y) ∈ P × P is computed as follows:
LGA(x,y) =
∑
i, j∈g,p
i
=x,p
j
=y
w(i, j)|
−→
V
i
||
−→
V
j
|, (2)
where p
i
, p
j
are head poses of person i and j, re-
spectively; w(i, j) is interaction weight computed in
Eq.1 and |
−→
V
i
|, |
−→
V
j
| are magnitudes of motion vectors.
Fig. 5 depicts how the LGA descriptors are extracted
from discovered interacting groups over two contigu-
ous frames. In our case p = 4; Le f t, Right, Front and
Back.
3.4 Group Activity Classification
Given a group activity video sequence, our goal is to
classify the activity. Each video sequence is repre-
sented as a collection of local group activity descrip-
tors that encode motion and interactions of people in
a group. To represent a group activity compactly, we
employ the bag-of-words (BoW) model which repre-
sents the videos as a histogram of codewords belong-
ing to a finite vocabulary set. In order to learn the
vocabulary of codewords, we use the LGA descrip-
tors extracted from videos in training data. This vo-
cabulary (codebook) is constructed by clustering the
descriptors using k-means with the Euclidean distance
as the clustering metric. The center of each resulting
cluster is a codeword. The LGA descriptors are then
assigned to unique codewords in order to represent the
group activity sequence as a 1D histogram of code-
words. The effect of the vocabulary size is analyzed
in our experiments and the results are shown in Fig. 8.
As group activity is represented as BoW, we employ
Support Vector Machine (SVM) as our classification
algorithm to learn and classify group activities.
4 EXPERIMENTS AND RESULTS
In this section, we describe the experiments designed
to evaluate the performance of the proposed algo-
rithms for interacting group discovery and group ac-
tivity recognition.
4.1 Datasets
To test our algorithm for interacting group discov-
ery, we use the CoffeeBreak dataset (Cristani et al.,
2011) that represents a coffee break scenario at a so-
cial gathering. It consists of two sequences, anno-
tated by a psychologist to indicate the groups present
in the scene. The annotations were done by analyz-
ing each frame and a questionnaire filled out by peo-
ple in the scene. Head poses of people quantized into
four bins are also provided by the dataset. Due to the
unavailability of suitable data in the public domain
the group discovery results are presented on only this
dataset. Fig. 6 shows some example frames from both
sequences in the dataset.
Our group activity recognition algorithm is tested
using the Collective Activity dataset (Choi et al.,
VISAPP2013-InternationalConferenceonComputerVisionTheoryandApplications
544
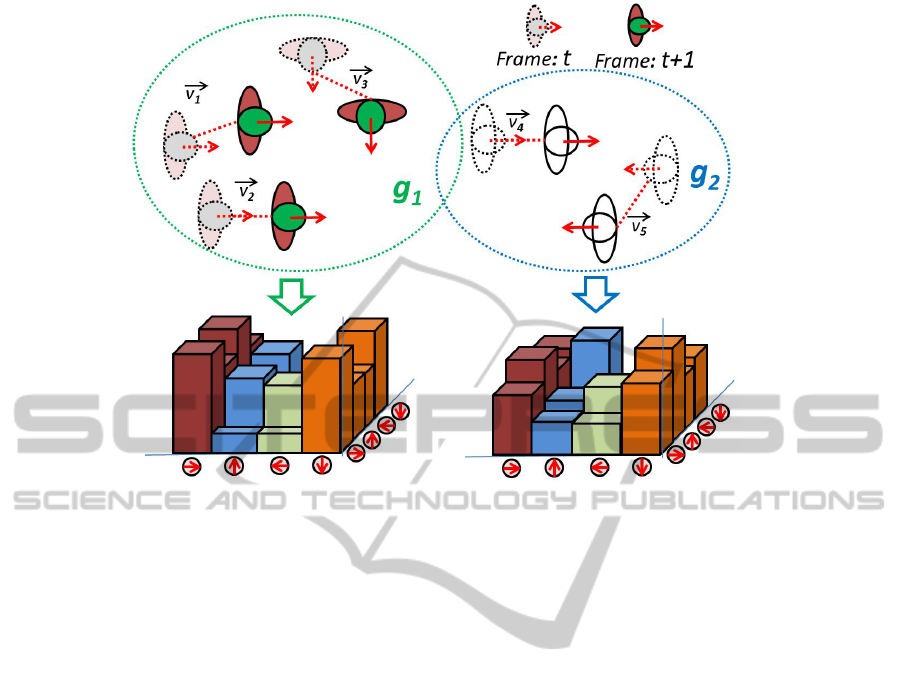
Figure 5: Extraction of Local Group Activity descriptors from discovered interacting groups.
2009). This dataset comprises of two sets, first one
contains 5 group activities (Crossing, Waiting, Queu-
ing, Walking and Talking) and the second contains 6
group activities augmented from the first one. The
second set includes two additional activities (Dancing
and Jogging) and omits the Walking activity present
in the first set. HOG based human detection and
head pose estimation along with a probabilistic model
is used to estimate camera parameters (Choi et al.,
2009). Extended Kalman filtering is employed to ex-
tract 3D trajectories of people in the scene. These
automatically extracted 3D trajectories and head pose
estimates are provided as a part of the dataset. Thus,
the dataset represents real world, noisy observations
with occlusions and automatic person detection and
trajectory generation is used. Fig. 9 shows example
frames from the Collective Activity dataset.
4.2 Interacting Group Discovery
Evaluation
For performance evaluation, we consider that a group
has been correctly estimated if at least d(2/3.|G|)e
of its members are correctly assigned to a discovered
group, where |G| is the cardinality of group G. The re-
sults of our algorithm on the CoffeeBreak dataset are
presented in table 1. Our method outperforms both
state-of-the-art methods (Cristani et al., 2011; Faren-
zena et al., 2009b). Fig. 6 shows one frame from
the dataset indicating the discovered groups using our
method. It is evident that in a fairly crowded envi-
ronment our method is capable of finding socially in-
teracting groups that are well localized and the group
membership is finely quantized. In other words, the
method is capable of grouping people very close to
each other into semantically different groups based on
social interactions cues. This implies that the graph
based clustering is an efficient and effective mecha-
nism for group discovery. These results are obtained
by setting a = 335cm, b = 200cm, c = 30cm that
maintain the ratio proposed in (Was et al., 2006). The
social distance function is modeled as power function
F
s
(r) = (1 − r)
n
,n > 1.
4.3 Group Activity Recognition
Evaluation
The recognition results obtained using our method
are presented in Table 2 using leave-one-out cross-
validation scheme. The approaches to group activity
analysis can be classified into two categories: bottom-
up and top-down. The Bottom-up approaches rely on
identifying activity of each individual in a group prior
to making a decision of group activity. Vice versa,
top-down approaches recognize group activity by an-
alyzing at the group level rather than at the person
level. Our approach is the 2-step, top-down approach.
We start by identifying groups and recognize a single
activity for the group rather than activity of each per-
son within a group. Hence, a direct comparison of our
approach to other approaches (Lan et al., 2010; Choi
et al., 2011; Choi et al., 2009) is difficult. Nonethe-
SocialCuesinGroupFormationandLocalInteractionsforCollectiveActivityAnalysis
545
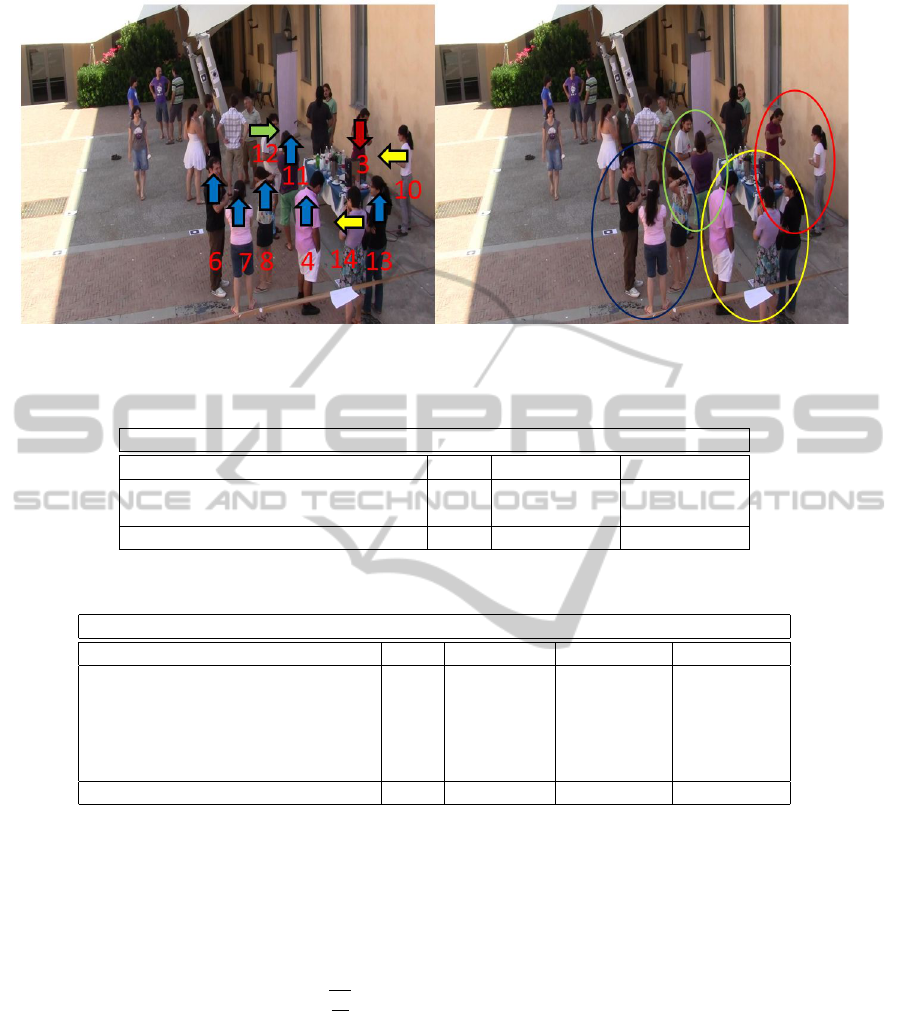
Figure 6: Results of interacting groups discovery. (L) Input data with human pose information. (R) Discovered interacting
groups using dominant set clustering algorithm.
Table 1: Comparison of interacting group discovery performance on CoffeeBreak dataset.
Precision (%) | Recall (%)
Approach Year Seq.1 Seq.2
Farenzena (Farenzena et al., 2009b) 2009 63.00 | 54.00 55.00 | 19.00
Cristani (Cristani et al., 2011) 2011 66.00 | 67.00 85.00 | 57.00
Our Method 88.64 | 66.86 92.12 | 85.59
Table 2: Recognition rates for various proposed methods on Collective Activity dataset.
Accuracy (%)
Approach Year Type 5-Activities 6-Activities
Choi (Choi et al., 2009) 2009 Bottom-up 65.90 −
Lan (Lan et al., 2010) 2010 Bottom-up 68.20 −
Choi (Choi et al., 2011) 2011 Bottom-up 70.90 82.00
Amer (Amer and Todorovic, 2011) 2011 Top-down − 81.50
Lan (Lan et al., 2011) 2011 Top-down 79.70 −
Our Method Top-down 78.75 80.77
less, a comparison at the semantic level is feasible,
which is what we have presented in Table 2. We ob-
tain comparable results to the state-of-the-art on both
5-activities and 6-activities datasets.
We train a SVM classifier for activity recognition
utilizing the libSVM library (Chang and Lin, 2011).
The recognition is based on the RBF kernel based
SVM classifier with the parameter σ =
q
N
f
2
, where
N
f
is number of training features. The parameters of
RBF kernel can have significant effect on the classi-
fier’s accuracy. Since this paper deals with a new local
group activity descriptor, the recognition algorithm,
used for classification is not the principal concern of
this work and hence the effects of RBF parameter tun-
ing are not explored. It is reasonable to assume that
efficient tuning of classifier parameters will boost the
recognition performance even more. It is worthwhile
to mention that the methods proposed in (Choi et al.,
2011; Amer and Todorovic, 2011) propose very elab-
orate learning and inference frameworks for activity
recognition. As opposed to such methods, our recog-
nition framework uses a traditional SVM based clas-
sifier. However, we can achieve comparable activity
recognition rates. This points to the discriminative
and representative potential of the proposed group ac-
tivity descriptor. Fig. 7 shows the confusion matrices
obtained on both datasets. It lists the recognition ac-
curacy for each activity individually. The low values
of the non-diagonal elements imply that the descrip-
tor is highly discriminative with very low decision
ambiguity between different group activities. Since
the descriptor builds on automated tracking and head
pose estimation results we can safely conclude that
the descriptor is robust as it retains its discriminatory
power in presence of noisy observations. The descrip-
tor is able to withstand errors in detection, tracking
VISAPP2013-InternationalConferenceonComputerVisionTheoryandApplications
546
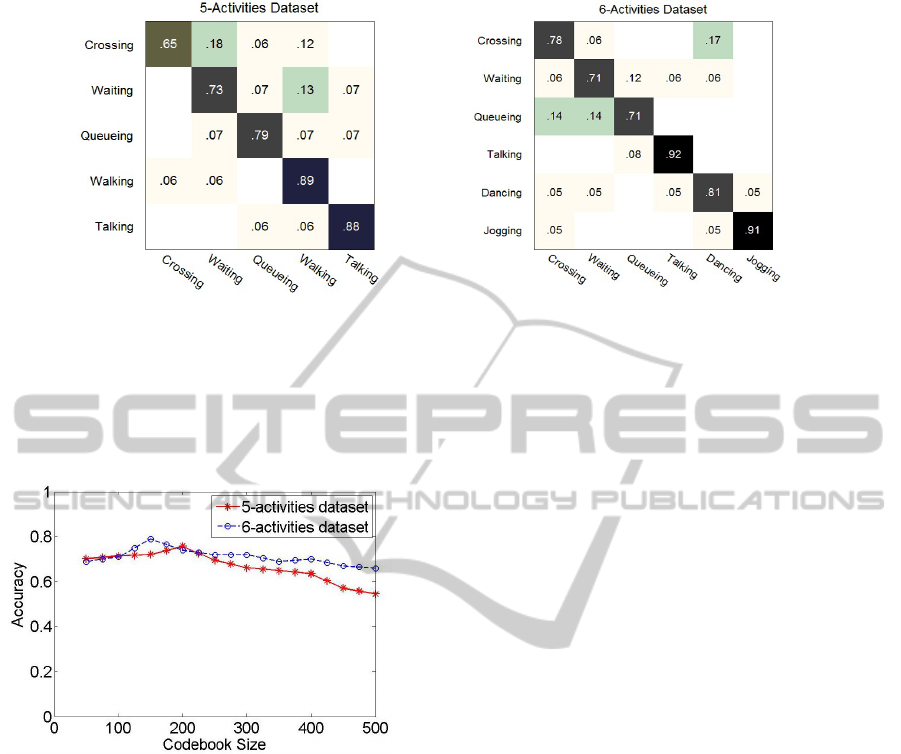
Figure 7: Confusion matrices for Collective Dataset (L) 5-Activities dataset (R) 6-Activities dataset.
and pose estimation techniques. Also, the effect of
the codebook size on recognition accuracy is shown in
figure 8. Codebook size of 150 and 200 achieves the
best recognition rates on the 5-activties and 6-activties
dataset, respectively.
Figure 8: Effect of varying codebook size on recognition
accuracy using the Collective Activity datasets.
Fig. 9 shows the groups formed using our method
on the collective activity dataset. It can be seen that
the people contained within the red boxes are not en-
gaged in the dominant activity in the scene. This im-
plies that the method is capable of identifying groups
of people that are involved in different activities and
can hence be used to eliminate scene contamination.
These individuals are not used in constructing the lo-
cal group activity descriptors, effectively making it
more representative of the dominant activity.
5 CONCLUSIONS
In this paper, we have proposed a graph-based clus-
tering algorithm to discover the interacting groups in
a crowded activity. We also proposed a novel lo-
cal group activity descriptor encoding the movement
and interactions of people for efficient recognition of
group activities. Our descriptor incorporates both mo-
tion information and local interaction information to
discriminate between different group activities. We
evaluated our proposed algorithms for discovering in-
teracting groups and classifying group activities on
two different public datasets. Further, our descrip-
tor is robust to missed detections, disconnected tra-
jectories and noisy head pose estimates. The results
demonstrate that our approach obtains state-of-the-
art performance in interacting group discovery and
achieves group activity recognition rates that are com-
parable to other state-of-the-art methods in group ac-
tivity recognition. Since our group discovery algo-
rithm utilizes social signaling cues it can be effective
in detecting groups performing different activities in
the same scene. This information can be invaluable in
scenarios where there exists multiple groups perform-
ing multiple group activities. More specifically, our
approach leads not only to recognition of a particu-
lar group activity, but provides a direct link to specific
people involved in the activity. This provides more
fine-grained information over methods that directly
identify a particular group activity in the scene inde-
pendent of identifying people involved in that activity.
Such scenarios are common in surveillance applica-
tion and our method can provide the tools for high
level activity and behavior analysis.
ACKNOWLEDGEMENTS
This work was supported in part by the US Depart-
ment of Justice 2009-MU-MU-K004. Any opinions,
findings, conclusions or recommendations expressed
in this paper are those of the authors and do not nec-
essarily reflect the views of our sponsors.
SocialCuesinGroupFormationandLocalInteractionsforCollectiveActivityAnalysis
547
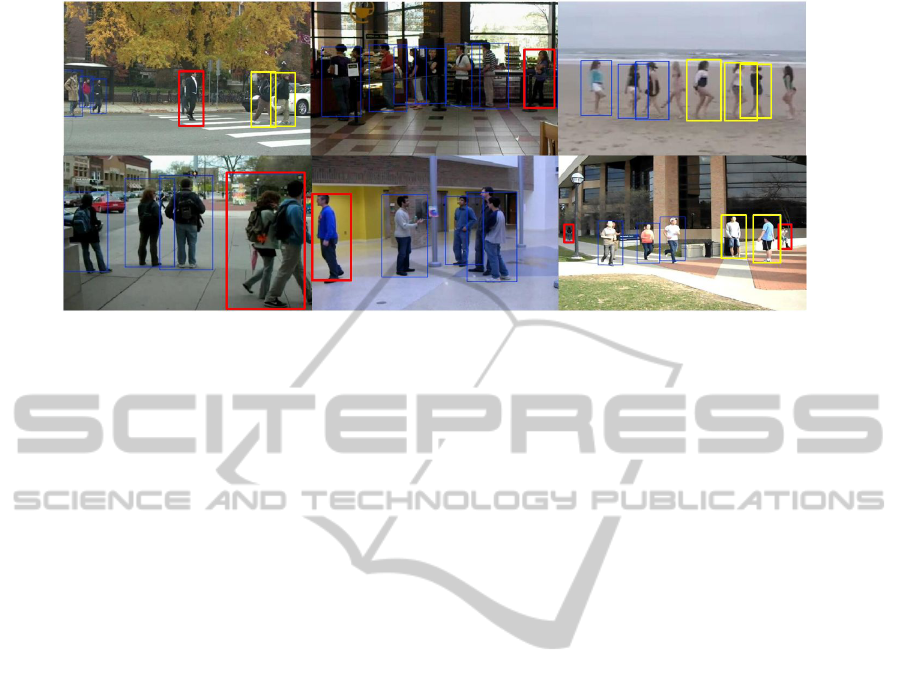
Figure 9: Interacting Group Discovery in Collective dataset. Different interacting groups are represented using different
color bounding boxes. The non-group people are represented using red color bounding boxes and are not included while
constructing to local group activity descriptors. This figure is best viewed in color.
REFERENCES
Amer, M. R. and Todorovic, S. (2011). A chains model for
localizing participants of group activities in videos. In
Proc. IEEE International Conference on Computer Vi-
sion.
Brendel, W. and Todorovic, S. (2011). Learning spatiotem-
poal graphs of human activities. In Proc. IEEE Inter-
national Conference on Computer Vision, Barcelona,
Spain.
Chang, C.-C. and Lin, C.-J. (2011). LIBSVM: A library for
support vector machines. ACM Transactions on Intel-
ligent Systems and Technology, pages 27:1–27:27.
Chang, M.-C., Krahnstoever, N., Lim, S., and Yu, T. (2010).
Group level activity recognition in crowded environ-
ments across multiple cameras. In Proc. IEEE Inter-
national Conference on Advanced Video and Signal
Based Surveillance, pages 56–63, DC, USA.
Choi, W., Shahid, K., and Savarese, S. (2009). What are
they doing? : collective activity classification using
spatio-temporal relationship among people. In Proc.
Visual Surveillance Workshop, ICCV, pages 1282 –
1289.
Choi, W., Shahid, K., and Savarese, S. (2011). Learning
context for collective activity recognition. In Proc.
Computer Vision and Pattern Recognition, pages 3273
–3280, Spring CO, USA.
Cristani, M., Bazzani, L., Paggetti, G., Fossati, A., Tosato,
D., Bue, A. D., Menegaz, G., and Murino, V. (2011).
Social interaction discovery by statistical analysis of
f-formations. In Proc. British Machine Vision Confer-
ence, pages 23.1–23.12.
Farenzena, M., Bazzani, L., Murino, V., and Cristani, M.
(2009a). Towards a subject-centered analysis for au-
tomated video surveillance. In Proc. International
Conference on Image Analysis and Processing, pages
481–489, Berlin, Heidelberg.
Farenzena, M., Tavano, A., Bazzani, L., Tosato, D., Pagetti,
G., Menegaz, G., Murino, V., and Cristani, M.
(2009b). Social interaction by visual focus of atten-
tion in a three-dimensional environment. In Proc.
Workshop on Pattern Recognition and Artificial Intel-
ligence for Human Behavior Analysis at AI*IA.
Gaur, U., Zhu, Y., Song, B., and Roy-Chowdhury, A.
(2011). A ”string of feature graphs” model for recog-
nition of complex activties in natural videos. In Proc.
IEEE International Conference on Computer Vision,
Barcelona, Spain.
Helbing, D. and Moln
´
ar, P. (1995). Social force model for
pedestrian dynamics. Physical Review E, 51(5):4282–
4286.
Lan, T., Wang, Y., Mori, G., and Robinovitch, S. (2010).
Retrieving actions in group contexts. In Proc. Inter-
national Workshop on Sign Gesture Activity.
Lan, T., Wang, Y., Yang, W., Robinovitch, S., and Mori,
G. (2011). Discriminative latent models for recogniz-
ing contextual group activities. IEEE Transactions on
Pattern Analysis and Machine Intelligence, (99):1.
Pavan, M. and Pelillo, M. (2007). Dominant sets and pair-
wise clustering. IEEE Transactions on Pattern Analy-
sis and Machine Intelligence, pages 167 –172.
Ryoo, M. and Aggarwal, J. (2011). Stochastic represen-
tation and recognition of high-level group activities.
International Journal of Computer Vision, pages 183–
200.
Smith, K., Ba, S., Odobez, J.-M., and Gatica-Perez, D.
(2008). Tracking the visual focus of attention for a
varying number of wandering people. IEEE Trans-
actions on Pattern Analysis and Machine Intelligence,
30:1212 –1229.
Tran, K., Kakadiaris, I., and Shah, S. (2012). Part-based
motion descriptor image for human action recogni-
tion. Pattern Recognition, 45(7):2562–2572.
Vinciarelli, A., Pantic, M., and Bourlard, H. (2008). So-
cial signal processing: survey of an emerging domain.
Image and Vision Computing, pages 1743 – 1759.
Was, J., Gudowski, B., and Matuszyk, P. J. (2006). Social
distances model of pedestrian dynamics. In Cellular
Automata for Research and Industry, pages 492–501.
VISAPP2013-InternationalConferenceonComputerVisionTheoryandApplications
548
