
A Preliminary Study of Non-intrusive Blood Pressure Monitoring
using Portable Device
Hanbyul Kim
1
, Hongji Lee
1
, Hyunjae Baek
1
, Wonkyu Lee
1
, Jungsu Lee
1
and Kwangsuk Park
2
1
Interdisciplinary Program of Bioengineering, College of Engineering, Seoul National University, Seoul, Republic of Korea
2
Department of Biomedical Engineering, College of Medicine, Seoul National University Hospital, Seoul, Republic of Korea
Keywords:
Non-intrusive Monitoring, Blood Pressure (BP), Electrocardiogram (ECG), Photoplethysmogram (PPG),
Pulse Arrival Time (PAT), Portable Device.
Abstract:
Novel blood pressure (BP) monitoring device focused on portability was studied preliminarily. Electrocardio-
gram (ECG) and photoplethysmogram (PPG) was measured and pulse arrival time (PAT) was computed from
these signals. Systolic blood pressure (SBP) and diastolic blood pressure (DBP) showed a clear correlation
with PAT. BP estimation model was constructed based on this result and verified by means of leave-one-out
cross-validation (LOOCV). Estimated SBP, DBP were involved in two standards of means of original data.
This device is expected to be useful to the people who want to monitor BP at any time and space.
1 INTRODUCTION
Blood pressure (BP) is significant biological signal
which indicates cardiovascular diseases. They are one
of the leading reasons of death worldwide and even
cause sudden death (Murray et al., 1996). Monitoring
BP becomes important issue to the people who have
risk of heart attack.
On the one hand, the concept of ubiquitous health-
care has been promising as communication and medi-
cal technology advances rapidly. It gradually changes
conventional notion of medical treatment. Non-
intrusive physiological monitoring is a typical exam-
ple. It allows medical care without consciousness as
well as seeing a doctor in person.
There also has been many developments to moni-
tor BP to fit this fashion. Mercury sphygmomanome-
ter has been used to measure BP and considered
“gold standard” for a long time. However, sphyg-
momanometer was inconvenient since it is obstruc-
tive and had a difficulty with continuous monitoring,
so several non-constrained methods began to appear.
Among them, pulse waveform analysis based on
the facts that pulse arrival time (PAT) correlates BP
is now engaging much thought. Kim developed a
system using toilet seat which can sense ECG and
PPG (Kim et al., 2006) and also suggested system for
computer users with a chair and a mouse (Kim et al.,
2007). The cuff-less measurements of BP using pulse
transit time was also investigated (Poon and Zhang,
2006).
However, these studies had limits since they didn’t
focus on the portability of device. The results aren’t
suitable for users who engage in outdoor activities
mainly. To resolve this problem, we designed a
necklace-type monitoring system which is convenient
to carry. It measures ECG and PPG signals simulta-
neously and extracts PAT from them to estimate BP
using built-in algorithm.
In this study, a similar but wired system was devel-
oped and examined for verification of portable device.
The correlations between PAT and SBP, PAT and DBP
was observed to ensure connections between these pa-
rameters. BP estimation model was constructed on
each subject and validated by statistical methods af-
terwards.
2 METHODS
2.1 Data Acquisition System
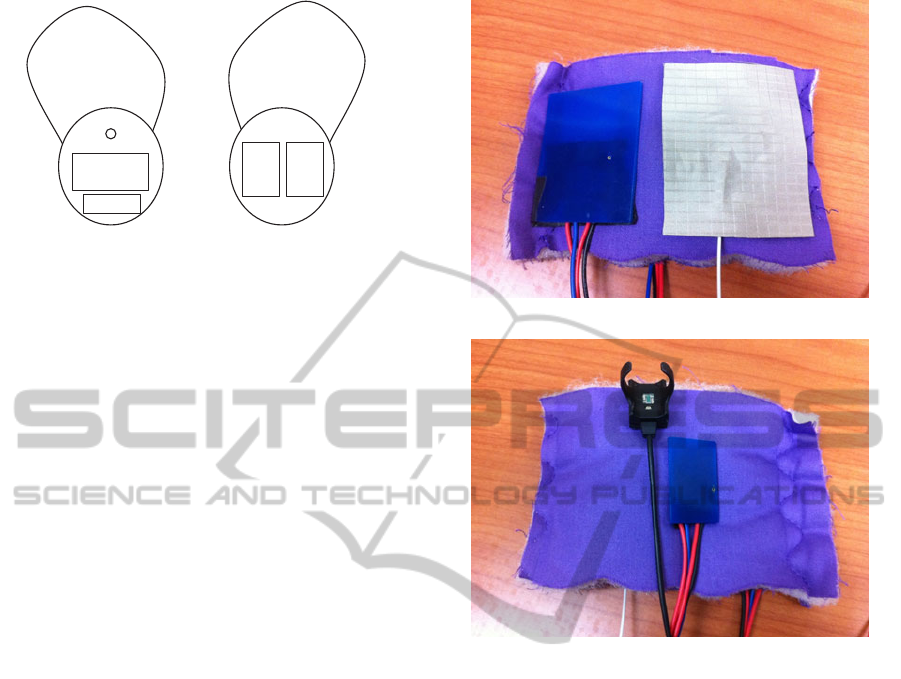
Figure 1 shows expected goal of our improved BP
monitoring system. The front side consists of PPG
sensor, ECG electrode, and display to show the results
of analysis. The backside has the other ECG electrode
and driven electrode. Before we start to develope, we
conducted preliminary experiment to explore the pos-
sibility of this device.
163
Kim H., Lee H., Baek H., Lee W., Lee J. and Park K..
A Preliminary Study of Non-intrusive Blood Pressure Monitoring using Portable Device.
DOI: 10.5220/0004247101630167
In Proceedings of the International Conference on Biomedical Electronics and Devices (BIODEVICES-2013), pages 163-167
ISBN: 978-989-8565-34-1
Copyright
c
2013 SCITEPRESS (Science and Technology Publications, Lda.)
Display
Driven
ECG
(left)
PPG sensor
ECG(right)
Figure 1: A schematic diagram of portable blood pressure
monitoring system. The left and right one denotes frontside
and backside of the system. Frontside contains display for
output, PPG sensor, ECG sensor (left). Backside has two
electrodes to measure ECG (right, driven).
Figure 2 is the sensing part designed for this pre-
liminary study. ECG measurement system followed
convention of driven-right-leg (DRL) circuit design
(Winter and Webster, 1983). Two active electrodes
developed by Lim were used to measure ECG (Lim
et al., 2006). These can be reused semi-permanently
since they are dry electrodes. The one (5cm × 4cm)
was placed on the chest between nipples. The other
one (3cm × 2cm) was on the palm of right hand.
Driven electrode was employed to cancel common
noise of the body. It was located next to the electrode
on chest. Frequency bands of the ECG signal were
0.5-35Hz.
A ring-type sensor (RP320, Laxtha, South Korea)
was chosen to monitor PPG. PPG signal was collected
from the index finger of right hand. Frequency bands
of the PPG signal were 0.5-35Hz. Finometer
R
PRO
(Finapres Medical Systems, Netherlands) was used to
measure beat-to-beat BP measurement. The finger-
type sensor was worn on the left middle finger. All
analog ECG, PPG and BP waves were digitized at
a sampling rate of 500Hz using BIOPAC acquisition
system (MP150 and UIM100C, BIOPAC Inc., USA).
2.2 Experiments
A total of three male subjects who had no history of
heart-related disorders participated in the experiment.
They were 24, 24 and 30 years old and weighed 67,
73 and 65kg respectively.
After all sensors attached as previously described,
they rested quietly for 2 minutes at first. The Valsalva
maneuvers for BP increase were performed for about
15 seconds. Five minutes of rest was necessary for BP
to reach resting state. The maneuver and relaxation
repeated 4 times.
(a)
(b)
Figure 2: A preliminary sensing part of portable blood pres-
sure monitoring system. (a) blue one: active electrode
placed on the chest, grey one: driven electrode. (b) blue
one: active electrode on the palm of right hand, black ring:
PPG sensor.
2.3 Data Analysis
Decreasing BP section right after Valsalva maneuver
was selected for the analysis. We could cover a wide
range of BP and remove many BP data around mean
blood pressure by doing that. The worst data due to
motion artifact was excluded from the analysis.
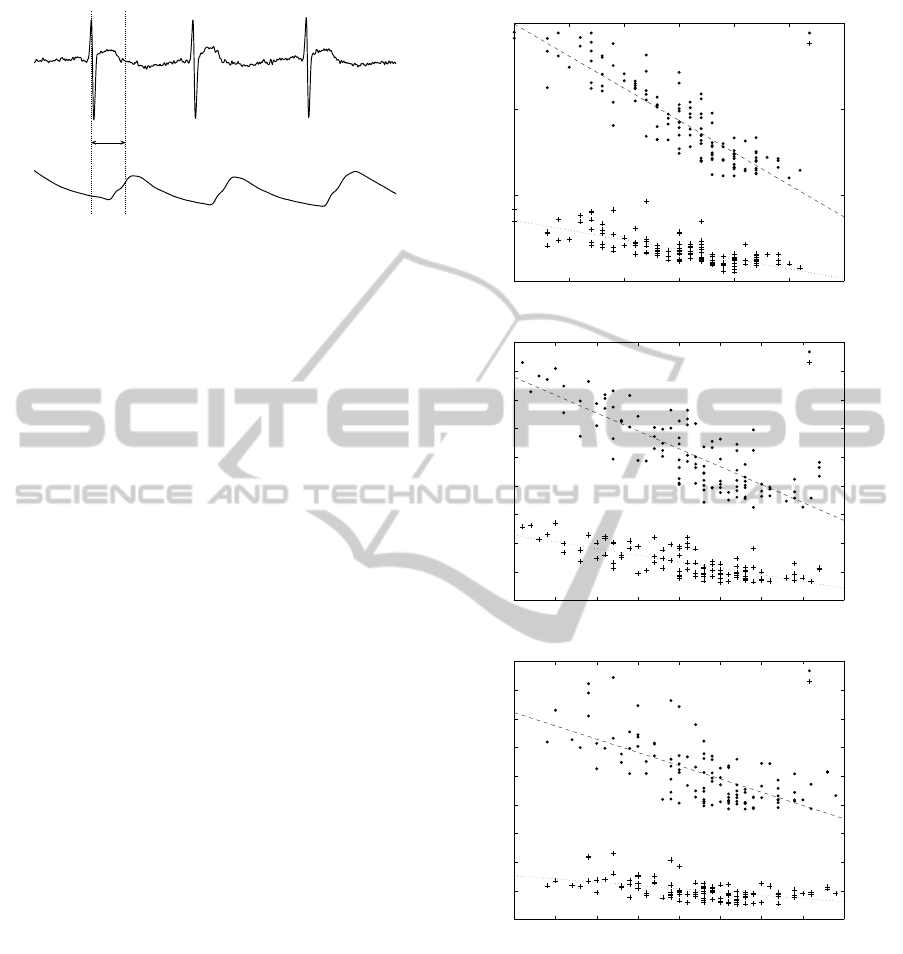
PAT is defined as the time difference between
ECG R-peak and the characteristic point of PPG sig-
nal. Various characteristic points have been chosen in
many studies. But Chiu showed first derivative point
method provided consistent results (Chiu et al., 1991).
So we calculated PAT by subtracting time of R-peak
of ECG from that of maximum first derivative point
of PPG in this study (Figure 3).
The hypothesis that PAT and BP correlate were
verified at first. PAT was compared with correspond-
ing systolic blood pressure (SBP) and diastolic blood
pressure (DBP) values.
BIODEVICES2013-InternationalConferenceonBiomedicalElectronicsandDevices
164
−0.5
0
0.5
1
1.5
2
2.5
3
3.5
4
PAT
Maximum first derivative
point of PPG
R−peak
of ECG
ECG
PPG
Figure 3: ECG and PPG waveforms measured from experi-
ment. PAT is defined as the time difference between R-peak
of ECG and maximum first derivative point of PPG.
Blood pressure estimation model can be con-
structed according to this result. Previous study (Yoon
et al., 2009) showed total calibration using all the data
of subjects made estimation errors bigger, so we only
performed individual calibration.
This model was assessed by means of cross-
validation study. Leave-one-out cross-validation
(LOOCV) was selected out of various cross-
validation methods. LOOCV uses a single observa-
tion data as the validation data and remaining data as
the training data (Kohavi, 1995). The correlation co-
efficient between BP and estimated BP and root mean
square error (RMSE) were computed to evaluate esti-
mation.
Parameter calculations, correlation and cross val-
idation analysis were performed using Matlab soft-
ware (MathWorks, USA).
3 RESULTS
Figure 4 shows the correlations between PAT and BP.
The scatterplot of PAT and SBP (DBP) on each sub-
ject were drawn on a single graph. The correlation
coefficients for each subject were also given in figure
4. SBP had a considerable correlation with PAT but
DBP showed lower linearity than SBP did.
Figure 5 summarizes the results of estimation of
SBP and DBP from PAT obtained by LOOCV. It in-
dicates estimated SBP and DBP correlated well with
the measured ones. Most estimated BPs don’t deviate
from the two standard of mean BP.
4 DISCUSSION
The relationships between PAT and BP were exam-
ined for three subjects in this study. The correlation
of our study showed better results compared with that
240 250 260 270 280 290 300
50
100
150
200
PAT (ms)
BP (mmHg)
Subject HB
SBP
DBP
SBP: r = −0.8883, p < 0.001
DBP: r = −0.7513, p < 0.001
(a)
250 260 270 280 290 300 310 320 330
40
60
80
100
120
140
160
180
200
220
PAT (ms)
BP (mmHg)
Subject HS
SBP
DBP
SBP: r = −0.8145, p < 0.001
DBP: r = −0.7296, p < 0.001
(b)
220 230 240 250 260 270 280 290 300
40
60
80
100
120
140
160
180
200
220
PAT (ms)
BP (mmHg)
Subject HJ
SBP
DBP
SBP: r = −0.6712, p < 0.001
DBP: r = −0.5051, p < 0.001
(c)
Figure 4: Relationship between blood pressure (SBP, DBP)
and PAT observed for (a) Subject HB (SBP: -0.8883, DBP:
-0.7513). (b) Subject HS (SBP: -0.8145, DBP: -0.7196). (c)
Subject HJ (SBP: -0.6712, DBP: -0.5051).
of system using a chair and computer mouse (Kim
et al., 2007) and BP monitoring device (Yoon et al.,
2009). A device of toilet seat type showed a high cor-
relation between SBP and PAT but there was a lower
relationship in DBP and PAT (Kim et al., 2006).
Subject HJ showed lower correlation in both SBP
and DBP than the others did. It gave better results
when Valsalva maneuver section were separated from
APreliminaryStudyofNon-intrusiveBloodPressureMonitoringusingPortableDevice
165

100 120 140 160 180 200 220
60
80
100
120
140
160
180
200
220
240
260
Estimated SBP (mmHg)
SBP (mmHg)
Subject HB
Mean + 2SD
Mean − 2SD
r = 0.8847, p < 0.001
rmse = 15.8428 mmHg
55 60 65 70 75 80 85 90
40
50
60
70
80
90
100
110
Estimated DBP (mmHg)
DBP (mmHg)
Subject HB
Mean + 2SD
Mean − 2SD
(a)
r = 0.7415, p < 0.001
rmse = 5.6411 mmHg
100 110 120 130 140 150 160 170 180 190 200
60
80
100
120
140
160
180
200
220
240
Estimated SBP (mmHg)
SBP (mmHg)
Subject HS
Mean + 2SD
Mean − 2SD
r = 0.8064, p < 0.001
rmse = 15.0433 mmHg
50 55 60 65 70 75 80 85
30
40
50
60
70
80
90
100
Estimated DBP (mmHg)
DBP (mmHg)
Subject HS
Mean + 2SD
Mean − 2SD
(b)
r = 0.7168, p < 0.001
rmse = 7.2976 mmHg
110 120 130 140 150 160 170 180
60
80
100
120
140
160
180
200
220
Estimated SBP (mmHg)
SBP (mmHg)
Subject HJ
Mean + 2SD
Mean − 2SD
r = 0.6547, p < 0.001
rmse = 15.8428 mmHg
52 54 56 58 60 62 64 66 68 70
40
45
50
55
60
65
70
75
80
85
90
Estimated DBP (mmHg)
DBP (mmHg)
Subject HJ
Mean + 2SD
Mean − 2SD
(c)
r = 0.4729, p < 0.001
rmse = 6.0361 mmHg
Figure 5: Correlation between SBP (DBP) and estimated SBP (DBP) (a) Subject HB. (b) Subject HS. (c) Subject HJ.
all data (-0.7796, -0.8282, -0.7213 respectively). It
can be infered from this result that accumulation of
data doesn’t always make better outcome.
All correlation coefficients between PAT and DBP
were lower than that of PAT and SBP. Most previous
studies had a trouble finding relation between PAT
and DBP. Kim showed this could be improved by
multiple linear regression method (Kim et al., 2008).
So parameters like heart rate should be introduced to
estimate DBP.
The results of BP estimation was validated by us-
ing LOOCV method. As a result, we found that the
RMSE between SBP and estimated SBP was about
15mmHg. Cross-validation analysis in DBP showed
that PAT couldn’t estimate DBP well but it had a
lower RMSE that SBP did. The fact that the range
BIODEVICES2013-InternationalConferenceonBiomedicalElectronicsandDevices
166

of DBP is narrower than that of SBP is assumed to
the main reason of this result.
Several additional works are planned to proceed
this project. More subjects should be employed to
demonstrate generality of this model. Experiments
will be performed to verify if this estimation is ap-
plicable to long-term monitoring. The data measured
in a few days from same subject can be collected for
this purpose.
5 CONCLUSIONS
The potential of portable BP monitoring system was
explored. Several experimental results showed PAT
which was measured non-intrusively had an obvious
correlation with both SBP and DBP. So it could be
used as parameter for the estimation of BP. Further
work with more subjects is needed to assert the ac-
curacy of prediction. People can monitor BP in daily
life easily with no limitations of time and space with
this portable system.
ACKNOWLEDGEMENTS
This work was supported by the National Research
Foundation of Korea (NRF) grant funded by the Ko-
rea government(MEST) (No. 2012010714).
REFERENCES
Chiu, Y., Arand, P., Shroff, S., Feldman, T., and Carroll, J.
(1991). Determination of pulse wave velocities with
computerized algorithms. American heart journal,
121(5):1460–1470.
Kim, J., Chee, Y., Park, J., Choi, J., and Park, K. (2006). A
new approach for non-intrusive monitoring of blood
pressure on a toilet seat. Physiological measurement,
27:203.
Kim, J., Kim, K., Baek, H., and Park, K. (2008). Effect
of confounding factors on blood pressure estimation
using pulse arrival time. Physiological Measurement,
29:615.
Kim, J., Park, J., Kim, K., Chee, Y., Lim, Y., and Park, K.
(2007). Development of a nonintrusive blood pressure
estimation system for computer users. Telemedicine
and e-Health, 13(1):57–64.
Kohavi, R. (1995). A Study of Cross-Validation and Boot-
strap for Accuracy Estimation and Model Selection.
Morgan Kaufmann.
Lim, Y., Kim, K., and Park, S. (2006). Ecg measurement on
a chair without conductive contact. Biomedical Engi-
neering, IEEE Transactions on, 53(5):956–959.
Murray, C., Lopez, A., et al. (1996). The global burden of
disease. Geneva: WHO, 270.
Poon, C. and Zhang, Y. (2006). Cuff-less and noninvasive
measurements of arterial blood pressure by pulse tran-
sit time. In Engineering in Medicine and Biology So-
ciety, 2005. IEEE-EMBS 2005. 27th Annual Interna-
tional Conference of the, pages 5877–5880. IEEE.
Winter, B. and Webster, J. (1983). Driven-right-leg circuit
design. Biomedical Engineering, IEEE Transactions
on, pages 62–66.
Yoon, Y., Cho, J., and Yoon, G. (2009). Non-constrained
blood pressure monitoring using ecg and ppg for
personal healthcare. Journal of medical systems,
33(4):261–266.
APreliminaryStudyofNon-intrusiveBloodPressureMonitoringusingPortableDevice
167
