
Chaos and Nonlinear Time-series Analysis of Finger Pulse Waves
for Depression Detection
Tuan D. Pham
1
, Truong Cong Thang
2
, Mayumi Oyama-Higa
3
, Hoc X. Nguyen
2
, Hameed Saji
4
and Masahide Sugiyama
2
1
Aizu Research Cluster for Medical Engineering and Informatics, CAIST, The University of Aizu,
Aizuwakamatsu, Fukushima 965-8580, Japan
2
School of Computer Science and Engineering, The University of Aizu, Aizuwakamatsu, Fukushima 965-8580, Japan
3
Chaos Technology Research Laboratory, 5-26-5 Seta, Otsu-shi, Shiga 520-2134, Japan
4
Aizu Research Cluster for Environmental Informatics, CAIST, The University of Aizu,
Aizuwakamatsu, Fukushima 965-8580, Japan
Keywords:
Chaos, Lyapunov Exponents, Nonlinear Dynamical Analysis, Sample Entropy, Photoplethysmograph,
Depression Detection, Biosignal Classification.
Abstract:
Depressive disorders are mental illnesses that can severely affect one’s health and well-being. If depression is
not early detected and left untreated, it can consequently lead to suicide. This paper presents for the first time
a novel combination of chaos theory and nonlinear dynamical analysis of signal complexity of photoplethys-
mography waveforms for detection of depression. Experimental results obtained from the analysis of mentally
disordered and control subjects suggest the potential application of the proposed approach.
1 INTRODUCTION
It has been known that depression has been a highly
prevalent, worldwide problem with multiple social
and health consequences (Waza et al, 1999). Sad feel-
ing, emotional indifference, and lack of interest re-
duce one’s ability to meet responsibilities and to enjoy
life. The causes of depression are complex resulting
in biological, psychological, and social dysfunctions
or a combination of these problems. Although de-
pression is the frequent mental disorder among older
people, its adverse impact on young people is much
greater than the elderly. The effects of depression
are not limited to a depressed person but they can be
far-reaching. Needless to say, the treatment for de-
pression is essential, because the consequences of un-
treated depression may be fatal.
The literature on improving detection of these is-
sues in primary care settings has predominantly fo-
cused on physician skills in assessing mental health
problems. While physician factors undoubtedly play
a role, it is believed that the detection of mental health
problems has not been widely investigated (Marcus et
al., 2011). Regarding the computerized detection of
depression, photoplethysmography (Allen, 2007) has
recently been realized as a useful biomedical technol-
ogy for studying mental disorders (Hu et al., 2011).
While speech (Low et al., 2011), image (Cohn et al.,
2009; Soennesyn, et al.), and other biosignals (Chen
et al., 2011; Kemp et al., 2012) have been used for
depression detection; photoplethysmography wave-
forms, which are generated from the measurements
of blood volume changes in the microvascular bed
of tissue at the skin surface and found as effective as
ECG (electrocardiography) in measuring the parame-
ters of heart rate variability (Russoniello et al., 2010),
provide simple and low-cost optical data for the same
study. For the first time, this paper presents the com-
bination of extractionsof the Lyapunovexponentsand
sample entropy values of the photoplethysmography
waveforms measured at the finger tips for depression
detection.
2 LYAPUNOV EXPONENTS FOR
DISCRETE-TIME SYSTEMS
A Lyapunov exponent is a real number that measures
the average rate of divergenceor convergenceover the
entire attractor which is the phase-space point or set
of points representing various possible steady state of
298
D. Pham T., Cong Thang T., Oyama-Higa M., X. Nguyen H., Saji H. and Sugiyama M..
Chaos and Nonlinear Time-series Analysis of Finger Pulse Waves for Depression Detection.
DOI: 10.5220/0004222302980301
In Proceedings of the International Conference on Bio-inspired Systems and Signal Processing (BIOSIGNALS-2013), pages 298-301
ISBN: 978-989-8565-36-5
Copyright
c
2013 SCITEPRESS (Science and Technology Publications, Lda.)

a dynamical system (Williams, 1997; Sprott, 2003).
For a discrete system, we consider how a 1-D map
x
k+1
= f(x
k
) evolves when it is started at two initial
states x
0
and (x
0
+ ε
0
), where ε
0
is a very small value
to indicate the two initial states are very close to each
other. The Lyapunov exponent is defined when the
two trajectories are separated by a distance ε
n
after n
iterations of the map as
|ε
n
| ≈ |ε
0
|
nλ
(1)
where λ is the Lyapunov exponent.
Taking the natural logarithm of both sides of
Equation (1), the divergence of the two trajectories
can be approximated as (Dingwell, 2006)
λ ≈
1
n
ε
n
ε
0
=
1
n
ln
f
n
(x
0
+ ε
0
) − f
n
(x
0
)
ε
0
(2)
If the interest is the study of the effects of very
small perturbations, the limit of Equation (2) is taken
as ε
0
→ 0, then the remaining term inside the loga-
rithm is expanded using the chain rule:
f
n
(x
0
+ ε
0
) − f
n
(x
0
) = (f
n
)
′
(x
0
)
=
n−1
∏
i=0
f
′
(x
i
) (3)
The back substitution of Equation (3) into Equa-
tion (2) gives
λ ≈
1
n
n−1
∑
i=0
ln| f
′
(x
i
)| (4)
Finally, the limit of Equation (4) is taken as
n → ∞, giving
λ = lim
n→∞
"
1
n
n−1
∑
i=0
ln| f
′
(x
i
)|
#
(5)
For M-dimensional mappings, Equation (5) is ex-
tended to yield a spectrum of Lyapunov exponents ar-
ranged in a decreasing order:
λ
1
≥ λ
2
≥ · ·· ≥ λ
M
,
where λ
1
is known as the maximum or largest Lya-
punov exponent (LLE).
3 SAMPLE ENTROPY
Let x = {x
1
, . . . , x
N
}, and Q
m
be the set of
all subsequences of length m in x: Q
m
=
{x
1m
, . . . , x
(N−m+1)m
}, where x
im
= {x
i
, . . . , x
i+m−1
}.
It is said that x
im
and x
jm
are similar if and only if
|x
i+k
− x
j+k
| < r, ∀k, 0 ≤ k < m, i 6= j (6)
Let L
m
= {x
1m
, . . . , x
(N−m−1)m
}, the probability of
patterns of length m that are similar to the pattern of
the same length that begins at i is
B
im
(r) =
J
im
(r)
N − m− 1
(7)
where J
im
(r) is the number of subsequences in L
m
that
are similar to x
im
.
The total average probability B
im
(r) for all i, i =
1, . . . , N − m, is
B
m
(r) =
1
N − m
N−m
∑
i=1
B
im
(r) (8)
Finally, the value of SampEn, given m and r, can
be calculated by the following equation:
SampEn(m,r) = log
B
m
(r)
B
m+1
(r)
(9)
4 EXPERIMENT
We are interested in applying chaos and nonlinear
time-series analysis of finger pulse waves for depres-
sion detection by extracting the biosignal features us-
ing LLE and SampEn. The experimental data used in
this study is the same data recently studied by (Hu et
al., 2011). The dataset consists of 195 patients diag-
nosed with depression and 113 students considered as
the control subjects. Finger pulse waves were mea-
sured on the depressed and control subjects at various
number of times.
The first step in the estimate of the LLE of the
finger pulse waves is the reconstruction of an appro-
priate state space for the nonlinear system. Takens’
embedding theory, which states that an appropriate
state space from a single original time series can be
reconstructed with a time delay (Takens, 1981), is ap-
plied here for the state-space reconstruction. The pur-
pose of selecting a time delay is to find a value of the
delay which is large enough to ensure that the result-
ing individual coordinates are relatively independent;
however, it should not be so large to be completely
independent statistically (Abarbanel, 1996). In this
study, the embedding dimensions of the finger pulse
waves were chosen to be 4 for the reconstruction of
the state space. Because of the difficulty in the com-
putation of the Lyapunov spectrum and the interest in
ChaosandNonlinearTime-seriesAnalysisofFingerPulseWavesforDepressionDetection
299
estimating λ
1
(LLE) which is the most significant in-
dicator of chaos, many algorithms have been devoted
to the calculation of the LLE. One of the most popular
methods for the LLE estimate is the one proposed by
Rosenstein et al (1993) and applied in this study.
For the calculation of SampEn, m = 7 and r =
0.2σ, where σ is the standard deviation of the signals,
were specified.
Sensitivity and specificity are statistical measures
of the performance of a binary classification test. Sen-
sitivity is the measure the proportion of actual posi-
tives which are correctly identified as such. In this
study, it is the percentage of the depressed patients
who are correctly identified as having depression.
Specificity is the measure of the proportion of neg-
atives which are correctly identified. Here it is the
percentage of the control subjects who are correctly
identified as not having depression.
The concept of autonomic nerve balance (Wilson,
2005) stems from the fact that the human nervous sys-
tem has two major parts: the voluntary and the auto-
nomic systems. The voluntary system is concerned
with movement and sensation and consists of motor
and sensory nerves.
The autonomic system regulates biological func-
tions such as blood pressure and heart rate over which
human beings have less conscious control. The auto-
nomic system has two states: sympathetic (stress) and
parasympathetic (healing). Computation of the auto-
nomic nerve balance (ANB), which is based on heart
rate per unit time measured from the end pulse wave ,
was patented and described in (Higa, 2011).
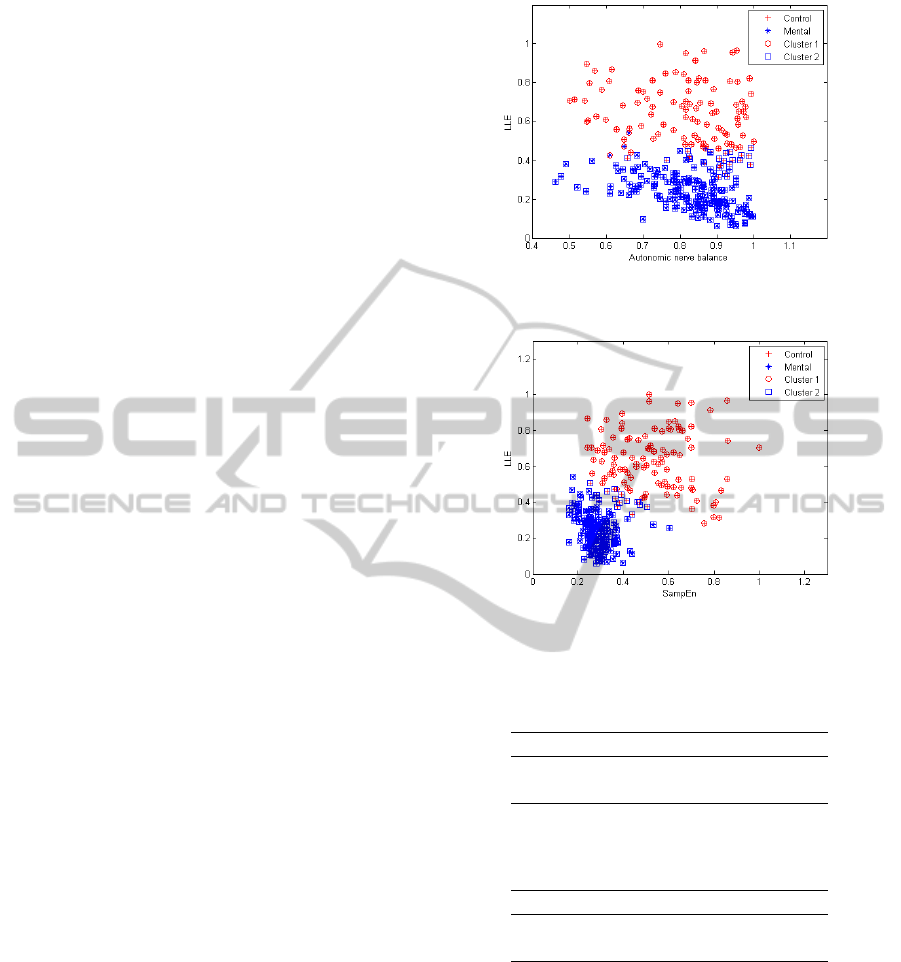
Figure 1 shows the LLE and autonomic nerve
balance (ANB) features extracted from the finger
pulse waves of the patients and control subjects, and
the graphical results obtained by the fuzzy c-means
(FCM) clustering algorithm. Figure 2 shows the LLE
and SampEn features extracted from the finger pulse
waves of the patients and control subjects, and the
graphical results obtained by the FCM algorithm. It
can be observed from the figures that the distributions
of the LLE and SampEn representing the depression
and control groups are presented in much more com-
pact and well defined clusters than those of the LLE
and ANB. The k-nearest neighbor (k-NN) algorithm,
where k = 7, was also used to classify the depressed
and control subjects in the experiment.
The specificity and sensitivity results provided by
the FCM and k-NN using LLE and ANB are shown in
Table 1, and the specificity and sensitivity results pro-
vided by the FCM and k-NN using LLE and SampEn
are shown in Table 2. Based on the results shown
in Table 1 and Table 2, the FCM performs better than
the k-NN in classifying the depressed patients (sensi-
Figure 1: LLE and ANB features of finger pulse waves clas-
sified by FCM.
Figure 2: LLE and SampEn features of finger pulse waves
classified by FCM.
Table 1: Sensitivity (%) and specificity (%) of depression
detection by LLE and ANB.
Classifier Sensitivity Specificity
FCM 97.78 79.31
k-NN 92.24 94.44
Table 2: Sensitivity (%) and specificity (%) of depression
detection by LLE and SampEn.
Classifier Sensitivity Specificity
FCM 1.00 87.07
k-NN 98.89 98.28
tivity), but the k-NN gives better results in detecting
the control subjects (specificity) than the FCM. For
practical purpose, the FCM would be preferred to the
k-NN because of the importance of the correct detec-
tion of depression. In general, these results show the
superior performance for depression detection of the
combination of the LLE and SampEn values using ei-
ther the FCM or k-NN classifier.
BIOSIGNALS2013-InternationalConferenceonBio-inspiredSystemsandSignalProcessing
300

5 CONCLUSIONS
The extractions of the finger pulse waves using the
largest Lyapunov exponents and the sample entropy
values have shown to be a better combination of the
biosignal features than the coupling of the largest Lya-
punov exponents and autonomic nerve balance val-
ues. The improvement suggests the usefulness of
chaos and nonlinear dynamical analysis of the pho-
toplethysmography waveforms for depression detec-
tion, which can be useful for mental health care.
ACKNOWLEDGEMENTS
This work was supported by the FY 2012 University
of Aizu Competitive Research Funds for Revitaliza-
tion Category.
REFERENCES
Allen J., Photoplethysmography and its application in clin-
ical physiological measurement, Physiol. Meas., 28
(2007) R1-R39.
Abarbanel H.D.I., Analysis of Observed Chaotic Data. New
York: Springer-Verlag, 1996.
Asada HH, et al., Mobile monitoring with wearable pho-
toplethysmographic biosensors, IEEE EMB Magazine
22 (2003) 28-40.
Chen Y.T., I.C. Hung, M.W. Huang, C.J. Hou, K.S. Cheng,
Physiological signal analysis for patients with depres-
sion, BMEI 2011, pp. 805-808, 2011.
Cohn J.F., et al., Detecting depression from facial actions
and vocal prosody, 3rd Int. Conf. ACII, pp. 1-7, 2009.
Dingwell J.B., Lyapunov exponents. Wiley Encyclopedia of
Biomedical Engineering, John Wiley & Sons, pp. 1-
12, 2006.
Higa M., Autonomic nervous balance computation appara-
tus and method therefor, US Patent US 2011/0313303
A1, 2011.
Hu YH, W. Wang, T. Suzuki, M. Oyama-Higa, Character-
istic extraction of mental disease patients by nonlin-
ear analysis of plethysmograms, CMLS-11, AIP Conf.
Proc 1371, pp. 92-101, 2011.
Kemp A. H., et al., Depression, comorbid anxiety disor-
ders, and heart rate variability in physically healthy,
non-medicated patients: implications for cardiovascu-
lar risk, PLoS ONE, 7 (2012) e30777.
Low L. S., N. C. Maddage, M. Lech, L. B. Sheeber, N. B.
Allen, Detection of clinical depression in adolescents’
speech during family interactions, IEEE Trans Biomed
Engineering, 58 (2011) 574-586.
Marcus M., H. Westra, M. Vermani, M. A. Katzman, Pa-
tient predictors of detection of depression and anxiety
disorders in primary care, J. Participat Med., 3 (2011)
e15.
Pincus S. M., Approximate entropy as a measure of system
complexity. Proc. Natl. Acad. Sci. U.S.A., 88 (1991)
2297-2301.
Richman J. S., J. R. Moorman, Physiological time-series
analysis using approximate entropy and sample en-
tropy. Amer. J. Physiol. Heart Circ. Physiol., 278
(2000) H2039-H2049.
Rosenstein M. T., et al., A practical method for calculat-
ing largest Lyapunov exponents from small data sets,
Physica D: Nonlinear Phenomena, 65 (1993) 117-134.
Russoniello C. V., et al., A measurement of electrocardio-
graphy and photoplethesmography in obese children,
Appl Psychophysiol Biofeedback, 35 (2010) 257-259.
Soennesyn H., et al., White matter hyperintensitives and the
course of depressive symptoms in elderly people with
mild dementia, Dement Geriatr Cogn Disord Extra, 2
(2012) 97-111.
Sprott J. L., Chaos and Time-Series Analysis. Oxford, New
York, 2003.
Takens F., Detecting strange attractors in turbulence. In:
D. Rand and L.S. Young, eds., Dynamical Systems
and Turbulence, Lecture Notes in Mathematics, 898
(1981) 366-381.
Waza K., A. V. Grahama, S. J. Zyzanskia, K. Inoue, Com-
parison of symptoms in Japanese and American de-
pressed primary care patients, Family Practice, 16
(1999) 528-533.
Williams G. P., Chaos Theory Tamed. Joseph Henry Press,
Washington D.C., 1997.
Wilson L., Autonomic nervous system health, Arizona Net-
working News, http://drlwilson.com/Articles/
NERVOUS%20SYSTEM.htm (2005).
ChaosandNonlinearTime-seriesAnalysisofFingerPulseWavesforDepressionDetection
301
