
Collaborative Filtering based on Sentiment Analysis of Guest Reviews for
Hotel Recommendation
Fumiyo Fukumoto, Chihiro Motegi and Suguru Matsuyoshi
Interdisciplinary Graduate School of Medicine and Engineering, Univ. of Yamanashi, Kofu, Japan
Keywords:
Collaborative Filtering, Recommendation System.
Abstract:
Collaborative filtering (CF) is identifies the preference of a consumer/guest for a new product/hotel by using
only the information collected from other consumers/guests with similar products/hotels in the database. It has
been widely used as filtering techniques because it is not necessary to apply more complicated content analysis.
However, it is difficult to take users criteria into account. Some of the item-based collaborative filtering take
users preferences or votes for the item into account. One problem of these approaches is a data sparseness
problem that the user preferences were not tagged all the items. In this paper, we propose a new recommender
method incorporating the results of sentiment analysis of guest reviews. The results obtained by our method
using real-world data sets demonstrate a performance improvement compared to the four baselines.
1 INTRODUCTION
Collaborativefiltering is the process of filtering for in-
formation or patterns using techniques involving col-
laboration among multiple agents, viewpoints, data
sources and so on. It has been widely studied (Huang
et al., 2004; Park et al., 2006; Liu and Yang, 2008;
Yildirim and Krishnamoorthy, 2008; Li et al., 2009)
and many systems such as Amazon and Expedia for
recommending books and hotels have been devel-
oped. These systems have been demonstrated to be an
effective framework to generate recommendations. It
identifies the potential preference of a consumer/guest
for a new product/hotel by using information col-
lected from other consumers/guests with similar prod-
ucts/hotels in records. Therefore, it is very simple
technique, i.e., it is not necessary to apply more com-
plicated content analysis compared to the content-
based filtering framework (Balabanovic and Shoham,
1997).
Item-based collaborative filtering is one of the
most popular recommendation algorithms (Desh-
pande and Karypis, 2004). It is a similarity-based al-
gorithm that assumes the consumers are likely to ac-
cept product/hotel recommendations that are similar
to what they have bought/stayed before. The task is
to predict the utility of items to a particular user based
on a database of user records. However, it is difficult
to take users criteria/preferences into account. For in-
stance, one guest thought that the hotel was not com-
fortable, while it was good for another guest. Simi-
larly, if two guests may have different criteria: e.g.,
service may be very important to one guest such as
business traveler whereas another guest is more inter-
ested in good value for selecting a hotel for her/his
vacation, it can not reflect these criteria to recom-
mend hotels. Breese et al. presented several pre-
diction algorithms including techniques based on cor-
relation coefficients, vector-based similarity calcula-
tions, and statistical Bayesian methods (Breese et al.,
1998). Instead of using items, they used users prefer-
ence patterns, i.e., the method calculates similarity in
item space where each value of the item space refers
to users preferences or votes for the item. While item-
based collaborative filtering has shown good perfor-
mance, its performance is still limited. One problem
is data sparseness problem, i.e., some items were not
assigned a label of user preferences. Another prob-
lem is that it is impossible to explore transitive as-
sociations between the products that have never been
co-purchased but share the same neighborhoods.
In this paper, we present a collaborative filtering
method for hotel recommendationincorporating guest
review. We used a set of score results that whether
the hotel is good or not. The score was obtained by
using sentiment analysis with guest reviews. It can
solve the problem of data sparseness because we can
utilize a large amount of guest reviews. Several ef-
forts have been made to utilize the results of senti-
ment analysis to recommend products (Cane et al.,
193
Fukumoto F., Motegi C. and Matsuyoshi S..
Collaborative Filtering based on Sentiment Analysis of Guest Reviews for Hotel Recommendation.
DOI: 10.5220/0004130901930198
In Proceedings of the International Conference on Knowledge Discovery and Information Retrieval (KDIR-2012), pages 193-198
ISBN: 978-989-8565-29-7
Copyright
c
2012 SCITEPRESS (Science and Technology Publications, Lda.)
2006; Niklas et al., 2009). Cane et. al proposed a
method to elicit user preferences expressed in textual
reviews, and map such preferences onto some rating
scales that can be understood by existing collabora-
tive filtering algorithms. The results using movie re-
views from IMDb for the movies in the MovieLens
dataset show the effectiveness of the approach, while
the sentiment analysis they used is limited, i.e., they
performed only adjectives or verbs. We used the re-
sults of sentiment analysis to calculate review simi-
larity between users. Moreover, we used random walk
based recommendationtechnique to explore transitive
associations between the hotels that have never been
stayed but share the same neighborhoods.
2 SYSTEM DESIGN
The method for hotel recommendation consists of two
steps: (i) hotel similarities by using transition proba-
bility and guest reviews based on sentiment analysis,
and (ii) scoring hotels based on link analysis.
2.1 Hotel Similarities based on
Transition Probability
We used first-order transition probability presented by
(Liu and Yang, 2008) and calculated hotel similari-
ties. Let the set of guests be G = g
1
, g
2
, ···, g
|G|
, and
the set of hotels be H = h
1
, h
2
, ···, h
|H|
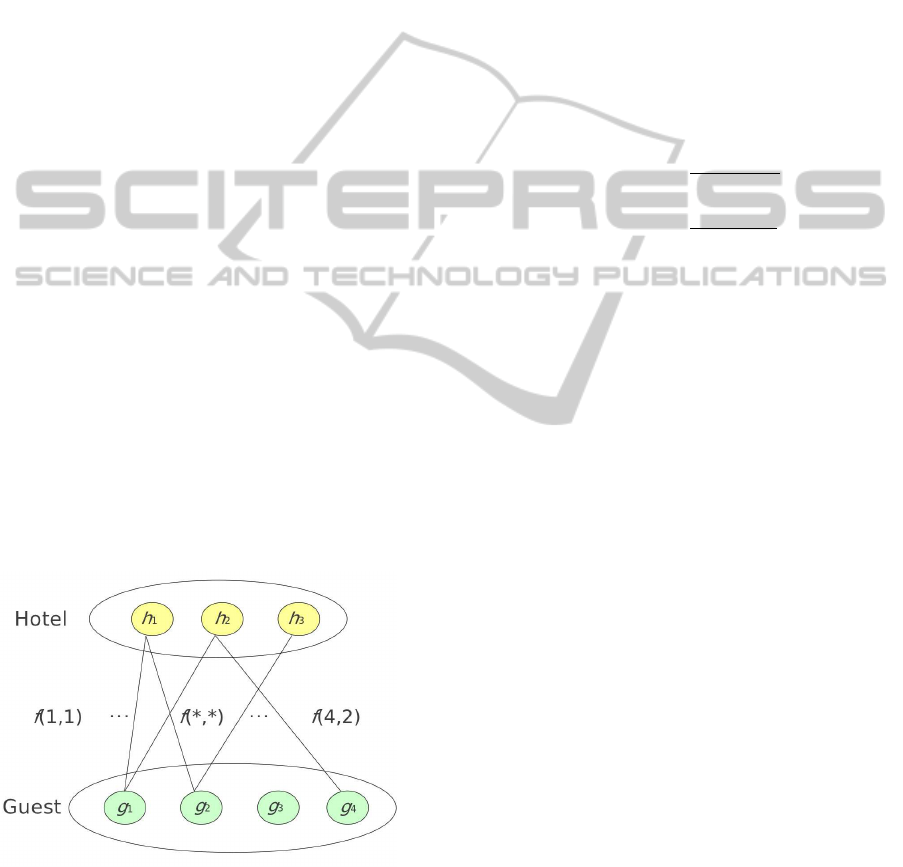
. Let also the
set of lodging frequencies be F = f(1,1), f(1,2), ···,
f(| G |,| H |). We can represent the data as N = {G,
H, F} as shown in Figure 1.
Figure 1: Network for hotel data.
Each edge in the network in Figure 1 refers to a
guest’s lodging frequency of a hotel. The conditional
probability of h
j
given h
i
can be interpreted as the
transition probability P(h
j
| h
i
) for a random surfer to
jump once from the product node i to product node j
via all the connected guest nodes g
k
. Thus, the transi-
tion probability P(h
j
| h
i
) is defined by formula (1).
P(h
j
| h
i
) =
|G|
∑
k=1
P(h
j
| g
k
)P(g
k
| h
i
). (1)
P(g
k
| h
i
) is the probability that a random surfer jumps
from the hotel node h
i
to the guest node g
k
, P(h
j
| g
k
)
is the probability that this surfer then jumps from g
k
to
the hotel node h
j
. Formula (1) shows the preference
voting for target hotel h
j
from all the guests in G who
stayed at h
i
, where every vote P(h
j
| g
k
) from the k-
th guest is weighted proportionally to his/her share of
total lodging frequency of h
i
, i.e., P(g
k
| h
i
). The con-
ditional probabilities used in Formula (1) are defined
as follows:
P(h
j
| g
k
) =
f(g
k
,h
j
)
(
∑
f(g
k
,· ))
. (2)
P(g
k
| h
i
) =
f(g
k
,h
i
)
(
∑
f(·,h
i
))
. (3)
f(g
k
,h
j
) in formula (2) refers to the lodging fre-
quency of the guest g
k
at the hotel h
j
. P(h
j
| h
i
) in
Formula (1) is the marginal probability distribution
over all the guests. We used the transition probability
shown in Formula (1) to compute similarity between
hotels h
i
and h
j
.
2.2 Hotel Similarities based on Reviews
We note that the transition probability shows that a
similarity between hotels i and j is made by hopping
from the original hotel node to the target hotel node
only via the guests who stayed both hotels. However,
the similarity based on transition probability can not
reflect guest criteria that whether the hotel is comfort-
able for the guest or not as it is based on whether the
guest stayed or not. Several approaches using users
preference patterns existed while its performance is
limited because of data sparseness problem. We thus
utilize the results of sentiment analysis to calculate re-
view similarity between guests. We set the sentiment
classes to positive and negative. Each sentence of the
reviews can be classified into these classes.
Generally, each sentence in the reviews is not as-
signed a label of positive or negative. Manual an-
notation for these sentences is costly, as the size of
reviews is usually very large. Hence automatic tag-
ging is necessary. Like much previous work on senti-
ment analysis based on corpus-based statistics or su-
pervised machine learning techniques (Turney, 2002),
we used support vector machine (SVM) to annotate
automatically. SVM is applied successfully to many
natural language processing tasks (Joachims, 1998).
KDIR2012-InternationalConferenceonKnowledgeDiscoveryandInformationRetrieval
194
We used content words as a feature of a sentence.
Each sentence consisting of reviews is a vector of
each content word and its value is a frequency of the
word in a sentence. The classification of each sen-
tence can be regarded as a two-class problem: posi-
tive or negative. We obtained similarity between two
hotels via their review similarities. To this end, we
computed reviewsimilarity for each type, positiveand
negative. Let r
(i)
k
(k = 1, 2, ··· , m) and r
( j)
l
(l = 1, 2,· · ·,
n) be reviews of the hotel h
i
and h
j
, respectively. m
and n denote the number of sentences consisting re-
view r
(i)
k
and r
( j)
l
, respectively. The similarity mea-
sure is shown in Formula (4).
sim
p/n
(h
i
,h
j
) =
1
m· n
m
∑
k=1
n
∑
l=1
cos(r
(i)
k
,r
( j)
l
). (4)
sim
p/n
(h
i
,h
j
) shows the similarity between hotels i
and j concerning to the reviews which consist of a
set of positive (negative) sentences. We calculated
sim
p
(h
i
,h
j
) by using r
(i)
k
and r
( j)
l
with only positive
sentences. Similarly, we calculated the negative sim-
ilarity between hotels i and j by using only negative
sentences included in the reviews, r
(i)
k
and r
( j)
l
.
2.3 Scoring Hotels by Link Analysis
The final procedure for recommendation is to score
each hotel according to the transition probability and
hotel similarity based on reviews. We used the MRW
model, which is a ranking algorithm that has been
successfully used in Web-link analysis, social net-
works (Xue et al., 2005), and more recently in text
processing applications. This approach decides the
importance of a node within a graph based on global
information drawn recursively from the entire graph
(Bremaud, 1999). The essential idea is that of “vot-
ing” between the nodes. A link between two nodes
is considered a vote cast from one node to the other.
The score associated with a node is determined by the
votes that are cast for it, and the score of the vertices
casting these votes. We applied the algorithm to rec-
ommend hotels.
Given a set of hotels H, G = (H, E) is a graph
reflecting the relationships between hotels in the set.
H is the set of nodes, and each node h
i
in H refers to
the hotel. E is a set of edges, which is a subset of H
× H. Each edge e
ij
in E is associated with an affinity
weight f(i → j) between hotels h
i
and h
j
(i 6= j).
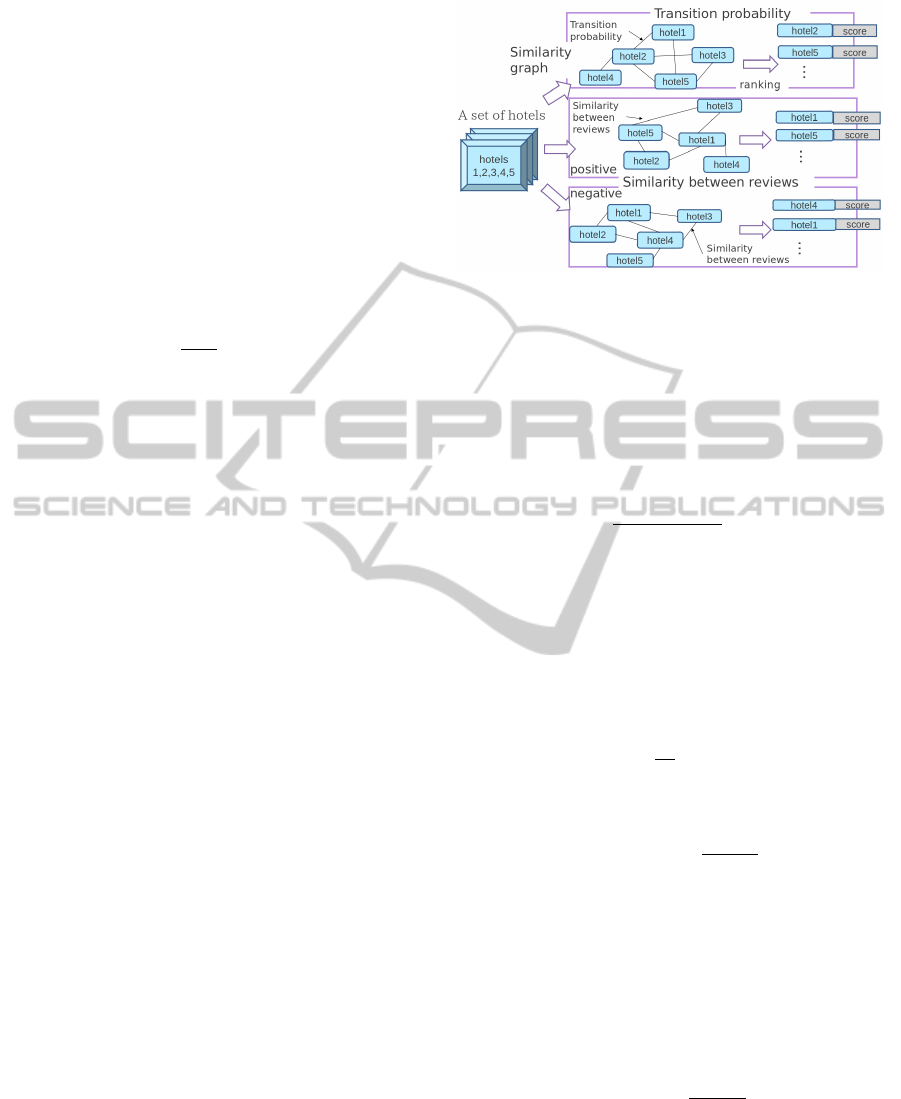
Figure 2 illustrates the procedure for recommen-
dation. As shown in Figure 2, we created three
graphs: One is transition probability graph, i.e., the
weight of each edge is a value of transition probabil-
ity P(h
j
| h
i
) between h
i
and h
j
. The second and the
Figure 2: Recommendation by link analysis.
third are positive review graph, and negative review
graph, respectively. The weight w(h
i
→ h
j
) is a value
of positive/negative similarity between h
i
and h
j
, i.e.,
sim
p/n
(h
i
,h
j
). Two nodes are connected if their affin-
ity weight is larger than 0 and we let w(h
i
→ h
i
)= 0 to
avoid self transition. The transition probability from
h
i
to h
j
is then defined as follows:
p(h
i
→ h
j
) =
w(h
i
→h
j
)
|H|
∑
k=1
w(h
i
→h
k
)
, if Σf 6= 0
0 , otherwise.
(5)
We used the row-normalized matrix U
ij
=
(U
ij
)
|H|×|H|
to describe G with each entry correspond-
ing to the transition probability, where U
ij
= p(h
i
→
h
j
). To make U a stochastic matrix, the rows with
all zero elements are replaced by a smoothing vector
with all elements set to
1
|H|
. The matrix form of the
recommendation score Score(h
i
) can be formulated
in a recursive form as in the MRW model.
~
λ = µU
T
~
λ+
(1− µ)
| V |
~e. (6)
where
~
λ = [Score(h
i
)]
|H|×1
is the vector of saliency
scores for the hotels. ~e is a column vector with all
elements equal to 1. µ is the damping factor. We set
µ to 0.85, as in the PageRank (Brin and Page, 1998).
The final transition matrix is given by formula (7),
and each score of the hotel is obtained by the principal
eigenvector of the matrix M.
M = µU
T
+
(1− µ)
| V |
~e~e
T
. (7)
We applied the algorithm for each graph. We note
that we have two types of scores: positive and nega-
tive. The higher score based on transition probability
and positive similarities the hotel has, the more suit-
able the hotel is recommended. On the other hand,
CollaborativeFilteringbasedonSentimentAnalysisofGuestReviewsforHotelRecommendation
195
the higher score based on negative similarities the ho-
tel has, the less suitable the hotel is recommended.
We obtained three eigenvectors corresponding to each
graph. Each element of the eigenvector corresponds
to each hotel. The final score for the hotel h
i
is calcu-
lated by using formula (8).
score(h
i
) = tr(h
i
) + pos(h
i
) − neg(h
i
). (8)
tr(h
i
), pos(h
i
) and neg(h
i
) indicate a value of the
eigenvector corresponded to the hotel h
i
which is ob-
tained by transition probability-based graph, positive
and negative similarity-based graph, respectively. We
chose the topmost k hotels according to rank score
calculated by using Formula (8) as a recommendation
hotel.
3 EXPERIMENTS
3.1 Data and Evaluation Measure
We had an experiment to evaluate our method. We
used Rakuten travel data
1
. We used SVM-Light
(Joachims, 1998) for classifying reviews. We used
linear kernel and set all parameters to their default
values. All Japanese data were tagged by using a mor-
phological analyzer Chasen (Matsumoto et al., 2000).
We selected content words and used them as a feature
of a vector used in SVM and link analysis. We used
the topmost 10 guests who stayed at a large number of
different hotels
2
. Moreover, we created two types of
data: one is the data to recommend hotels located in
the whole area of Japan, and another is the data with a
specific area, i.e., the data to recommend hotels from
Hokkaido area.
We had an experiment to classify review sentences
into positive or negative. We chose the topmost 300
hotels whose number of reviews are large. We manu-
ally annotated these reviews and obtained 1,800 sen-
tences consisting 900 positive and 900 negative sen-
tences. 1,800 sentences are trained by using SVM,
and classifiers are obtained. We randomly selected
another 10,000 test review sentences from the top-
most 300 hotels and used them as the test data of sen-
timent analysis evaluation. Each of the test data was
classified into positive or negativeby SVM classifiers.
For evaluation of the sentiment analysis, we randomly
chose 100 sentences from 10,000 test sentences and
manually evaluated. The process is repeated three
times. The evaluation is made by two humans. The
1
http://rit.rakuten.co.jp/rdr/index.html
2
As a result, each guest stayed at more than 17 hotels.
classification is determined to be correct if two human
judges agree. As a result, the macro-averaged F-score
concerning to positive in each trial was 0.924, 0.923,
and 0.905, and the average was 0.917. Similarly, the
F-score for negative was 0.714, 0.811, and 0.794, and
the average was 0.773. We used these 1,800 review
sentences to classify test review sentences which are
used to recommend hotels.
Training data
10 guests
Hotels
Guests
Hotels
g1
g2
g10
g1’
g2’
g10’
………
………………
………………..
……….
Reviews
Reviews
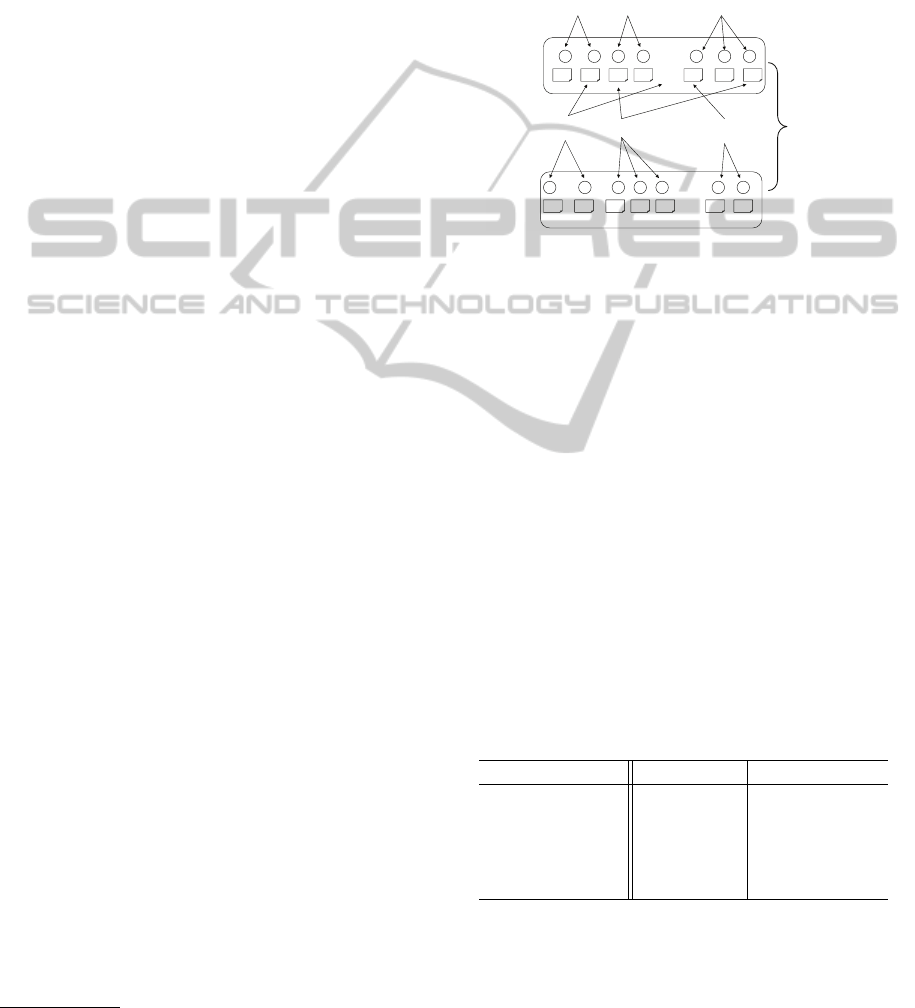
Figure 3: Training data used in recommendation system.
We created the data which is used to test our rec-
ommendation system. More precisely, for each of the
10 guests, we sorted hotels in chronologicalorder. We
divided it into two: training and test data. The train-
ing data consists of hotel reviews with chronological
order except for the latest three hotel reviews, and the
test data with the latest three hotels is used to exam-
ine whether the system is correctly recommend these
hotels or not. Moreover, in order to evaluate how the
method can recommend hotels to a guest that has not
been stayed at, we collected all the hotels that the 10
guests have stayed at, as shown in the first layer of
Figure 3.
Next, we picked up all the guests who have stayed
at one of the collected hotels (“Guests” in Figure 3).
Finally, we obtained all the hotels that these guests
stayed at, and added these to the training data. The
size of the data we used is shown in Table 1.
Table 1: Data used in the experiments.
Whole area Hokkaido area
Hotels 604 54
Different hotels 208 18
Guests 33,641 4,357
Training data 2,675 119
Reviews 201,576 5,998
“Hotels” and “Different hotels” in Table 1 refers to
the total number of hotels and the number of different
hotels that the topmost 10 guests stayed at. “Guests”
shows the total number of guests who stayed at one of
the “Hotels”. “Training data” stands for the number of
hotels used in the experiments and “Reviews” shows
KDIR2012-InternationalConferenceonKnowledgeDiscoveryandInformationRetrieval
196

the number of test review sentences with these hotels.
For evaluation measure used in recommendation,
we used MAP (Mean-Averaged Precision) (Yates and
Neto, 1999). For a given set of guests G = {g
1
, ···,
g
n
}, and {h
1
, ···, h
m
j
} be a set of hotels that should be
recommended for a guest g
j
, the MAP of G is defined
by Formula (9).
MAP(G) =
1
| G |
|G|
∑
j=1
1
m
j
m
j
∑
k=1
Precision(R
jk
).(9)
R
jk
refers to the set of ranked retrievalresults from the
top result until we get hotel h
k
. Precision indicates
precision that is the ratio of correct recommendation
hotels by the system divided by the total number of
recommendation hotels.
3.2 Recommendation Results
We compared the results obtained by our method with
four baselines: link analysis by using (1) transition
probability, (2) similarities of positive reviews, (3)
similarities of positive and negative reviews, and (4)
transition probability and similarities of positive re-
views. The results are shown in Table 2.
Table 2: MAP for each method.
Method MAP
Tr 0.061
Rev (pos) 0.044
Rev (pos&neg) 0.067
Tr & Rev (pos) 0.172
Tr & Rev (pos&neg) 0.267
Table 2 shows MAP for each method. As we can
see from Table 2 that Rev (pos) and Rev (pos & neg)
were 0.044 and 0.067 MAP, respectively. This in-
dicates that not only the use of positive reviews but
also negative reviews improve overall performance,
while the averaged F-score for classification of neg-
ative sentences was 0.773 and it was worse than that
of positive sentences (0.917). The results obtained by
combining transition probability and review similari-
ties are better than that obtained by using each method
only. Moreover, the results obtained by our method
was 0.267 and it was the best performance compared
with other baselines.
Table 3 shows a ranked list of the hotels for
one guest (guest ID: 7630) obtained by using each
method. Each number shows hotel ID, and bold font
refers to the correct hotel, i.e., the latest three ho-
tels that the guest stayed at. As can be seen clearly
from Table 3 that the result obtained by our method,
Tr&Rev (pos&neg) includes all of the three correct
hotels, ”15056”, ”931”, and ”5146” within the top-
most 6 hotels, while Rev (pos&neg) and Tr & Rev
(pos) was only one, ”15056”. Tr and Rev (pos) did
not include any correct hotels within the topmost 6
hotels. The results show the effectiveness of our
method.
We note that some recommended hotels are very
similar to the correct hotels, while most of the 6 ho-
tels did not exactly match these correct hotels except
for the result obtained by our method. Therefore, we
examined how these hotels were similar to the correct
hotels. To this end, we used seven criteria points that
were provided by Rakuten travel. These are (1) ser-
vice, (2) location, (3) guest room, (4) facilities, (5)
bath room, (6) meal, and (7) overall. These criteria
are scoring from 1 to 5, where 1 (bad) is lowest, and 5
(good) is the best score. We represented each ranked
hotel as a vector where each dimension of a vector is
these seven criteria and the value of each dimension is
its score value. The similarity between correct hotel
and other hotels within the rank for each method X is
defined by Formula (10).
sim(X) =
1
| G |
|G|
∑
i=1
argmin
j,k
d(R h
ij
,C h
ik
). (10)
| G | refers to the number of guests, i.e., | G | = 10
in the experiment. R h
ij
refers to a vector of the j-
th ranked hotels except for the correct hotels. Sim-
ilarly, C h
ik
stands for a vector representation of the
k-th correct hotel. d shows Euclidean distance. For-
mula (10) shows that for each guest, we obtained the
minimum value of Euclidean distance between R h
ij
and C h
ik
. Then averaged summation of the number
of guests (10 guests) are calculated. The results are
shown in Table 4.
The smaller value shown in Table 4 indicates a
better result. Table 4 shows that the hotels except for
the correct hotels obtained by our method are more
similar to the correct hotels than those obtained by
four baselines. The results again clearly support the
usefulness of our method.
4 CONCLUSIONS
We have developed an approach to hotel recommen-
dation by incorporating the results of sentiment anal-
ysis of guest reviews. The results using real-world
data sets showed the effectiveness of the method com-
pared with four baselines. Future work will include:
(i) applying the method to a large number of guests
for quantitative evaluation, (ii) comparison to other
recommendation techniques incorporating methods
CollaborativeFilteringbasedonSentimentAnalysisofGuestReviewsforHotelRecommendation
197
Table 3: Hotel recommendation list for guest ID 7630.
Rank Tr Rev (pos) Rev (pos&neg) Tr & Rev (pos) Tr & Rev (pos&neg)
1 28506 1529 80549 1529 15056
2 943 15683 8298 25110 1633
3 4929 25110 8298 15056 70194
4 54491 8298 1989 1633 931
5 1529 1633 15683 15683 11019
6 52322 80549 15056 80549 5146
Table 4: Similarities between the ranking hotel and correct
hotel.
Method sim
Tr 2.65
Rev (pos) 2.17
Rev (pos&neg) 2.30
Tr & Rev (pos) 2.04
Tr & Rev (pos&neg) 1.87
such as word-based sentiment analysis and Basket-
Sensitive Random Walk (Li et al., 2009), and (iii) ap-
plying the method to other data such as grocery stores:
LeShop
3
, TaFeng
4
and movie data: MovieLens
5
to
evaluate the robustness of the method.
REFERENCES
Balabanovic, M. and Shoham, Y. (1997). Fab Content-
based Collaborative Recommendation. In Communi-
cations of the ACM, 40:66–72.
Breese, J. S., Heckerman, D., and Kadie, C. (1998). Em-
pirical Analysis of Predictive Algorithms for Collab-
orative Filtering. In Proc. of the 14th Conference on
Uncertainty in Artificial Intelligence, pages 42–52.
Bremaud, P. (1999). Markov Chains: Gibbs Fields, Monte
Carlo Simulation, and Queues. Springer-Verlag.
Brin, S. and Page, L. (1998). The Anatomy of a Large-
scale Hypertextual Web Search Engine. Computer
Networks, 30(1-7):107–117.
Cane, W. L., Stephen, C. C., and Fu-lai, C. (2006). Integrat-
ing Collaborative Filtering and Sentiment Analysis. In
Proc. of the ECAI 2006 Workshop on Recommender
Systems, pages 62–66.
Deshpande, M. and Karypis, G. (2004). Item-based Top-N
Recommendation Algorithms. ACM Transactions on
Information Systems, 22(1):143–177.
Huang, Z., Chen, H., and Zeng, D. (2004). Applying Asso-
ciative Retrieval Techniques to Alleviate the Sparsity
Problem in Collaborative Filtering. ACM Trans. on
Information Systems, 22(1):116–142.
Joachims, T. (1998). SVM Light Support Vector Machine.
In Dept. of Computer Science Cornell University.
3
www.beshop.ch
4
aiia.iis.sinica.edu.tw/index.php?option=com docman&
task=cat view&gid=34&Itemid=41
5
http://www.grouplens.org/node/73
Li, M., Dias, B., and Jarman, I. (2009). Grocery Shopping
Recommendations based on Basket-Sensitive Ran-
dom Walk. In Proc. of the 15th ACM SIGKDD, pages
1215–1223.
Liu, N. N. and Yang, Q. (2008). A Ranking-Oriented Ap-
proach to Collaborative Filtering. In Proc. of the 31st
ACM SIGIR, pages 83–90.
Matsumoto, Y., Kitauchi, A., Yamashita, T., Hirano, Y.,
Matsuda, Y., Takaoka, K., and Asahara, M. (2000).
Japanese Morphological Analysis System Chasen Ver-
sion 2.2.1. In Naist Technical Report.
Niklas, J., Stefan, H. W., c. M. Mark, and Iryna, G. (2009).
Beyond the Stars: Exploiting Free-Text User Reviews
to Improve the Accuracy of Movie Recommendations.
In Proc. of the 1st International CIKM workshop on
Topic-Sentiment Analysis for Mass Opinion, pages
57–64.
Park, S. T., Pennock, D. M., Madani, O., Good, N., and
DeCoste, D. (2006). Naive Filterbots for Robust Cold-
Start Recommendations. In Proc. of the 12th ACM
SIGKDD, pages 699–705.
Turney, P. D. (2002). Thumbs Up or Thumbs Down? Se-
mantic Orientation Applied to Un-supervised Classi-
fication of Reviews. In Proc. of the 40th ACL, pages
417–424.
Xue, G. R., Yang, Q., Zeng, H. J., Yu, Y., and Chen, Z.
(2005). Exploiting the Hierarchical Structure for Link
Analysis. In Proc. of the 28th ACM SIGIR, pages 186–
193.
Yates, B. and Neto, R. (1999). Modern Information Re-
trieval. Addison Wesley.
Yildirim, H. and Krishnamoorthy, M. S. (2008). A Random
Walk Method for Alleviating the Sparsity Problem in
Collaborative Filtering. In Proc. of the 3rd ACM Con-
ference on Recommender Systems, pages 131–138.
KDIR2012-InternationalConferenceonKnowledgeDiscoveryandInformationRetrieval
198
