
Empirical Comparison of Comprehensibility of
Requirement Specification Techniques based on
Natural Languages and Activity Diagrams
Bogumila Hnatkowska and Mateusz Grzegorczyn
Wroclaw University of Technology, Faculty of Computer Science and Management,
Wyb. Wyspianskiego 27, 50-370 Wroclaw, Poland
Abstract. Understandability belongs to the most important features of good
quality software requirement specification (SRS). There exist plenty notations
used for defining SRS, but still natural language (NL) belongs to the most pop-
ular. The specification written is NL could suffer from ambiguity, however it
can be read by everybody without specific training. To eliminate, even partial-
ly, the drawbacks mentioned previously, SRS is written according to well de-
fined guidelines and with the use of templates, e.g. use-case model consisting
of a use-case diagram with a set of use-case detailed descriptions. Use-case de-
scriptions are defined in NL or with dynamic diagrams, e.g. activity diagrams.
This paper presents a controlled experiment which aimed at comparison of
comprehensibility of techniques based on natural language and activity dia-
grams. The results of the experiment confirmed that formal notation is less am-
biguous. Additionally, if a reader is accustomed to it, reading activity diagram
not necessarily is time consuming.
1 Introduction
Requirement engineering (RE) plays a crucial role in successful software develop-
ment. SE process is always done regardless the methodology used. Its main outcome
is software requirement specification (SRS). SRS can be written with different nota-
tions which have acceptance in industry. The complexity of software projects requires
developers to carefully select RE techniques and notations used.
One of the most important features of good quality SRS is its understandability (al-
so called readability or comprehensibility), i.e. the capability of SRS to be fully un-
derstood when read by the user [14].
There are many different stakeholders who have to read and understand require-
ment specification. Customers, project managers, and system analysts are among
them. According to [6] ‘misunderstandings of requirements by development team’
belong to the ordinary mistakes in SRS.
The paper deals with the problem of SRS readability perceived by system analysts,
and system developers who are familiar with semi-formal notations used for SRS
expression, however, they have still to read informal specifications, written in natural
language or structured natural language. The former notations are selected to gain
Hnatkowska B. and Grzegorczyn M..
Empirical Comparison of Comprehensibility of Requirement Specification Techniques based on Natural Languages and Activity Diagrams.
DOI: 10.5220/0004099100270036
In Proceedings of the 10th International Workshop on Modelling, Simulation, Verification and Validation of Enterprise Information Systems and 1st
International Workshop on Web Intelligence (MSVVEIS-2012), pages 27-36
ISBN: 978-989-8565-14-3
Copyright
c
2012 SCITEPRESS (Science and Technology Publications, Lda.)

more precision, the later because they are very natural, need no specific training, are
cheaper and easier to prepare. The potential benefits of successful comprehension of
SRS includes improvements in software quality, stakeholder satisfaction and devel-
opment costs [14].
The aim of the paper is to answer the question if and how the selected formalism
influences the readability of software requirement specification. If it is reasonable to
spend time and money on preparing more-formal descriptions. Therefore three differ-
ent techniques are considered: (a) natural language (which does not introduce any
constraints), (b) use-case model together with use-case specifications (written in
structural natural language) [3], [10], (c) activity diagrams (UML diagrams with well
defined syntax and semi-formal semantics) [12]. The paper presents the results of a
controlled experiment conducted to answer the research question. The initial assump-
tion was that readability of activity diagrams should be better than readability of spec-
ifications based on natural languages.
There are many experiments reported in literature (see Section 3) addressing com-
prehensibility of SRS, but none of them served to compare techniques selected by us.
What is important, selected techniques are often used in practice by IT companies and
are not only the subjects of academic considerations.
The paper is structured as follows. In Section 2. a short overview of existing SRS
notations is given. Section 3 presents related works which were inspirations for our
research. Section 4 provides the experiment description together with data analysis
and discussion. The last Section 5 concludes the paper.
2 An Overview of Requirement Specification Techniques
An ordinary approach to write SRS is to use natural language, which in inherently
ambiguous [7]. To eliminate the drawbacks of this, the specification writers are of-
fered SRS templates, e.g. [7] or they are forced to use a controlled language, with
strictly defined grammar, e.g. ACE [1]. The control language’s supporting tools often
enable checking the specification against internal inconsistency and/or obvious omis-
sions.
Nowadays use-case models are very often used for describing software functional
requirements. Originally proposed by Jacobson, they become an important part of
many software development processes, e.g. USDP [2], OpenUP [13]. The use-case
model consists of two types of artifacts: a use-case diagram, and a detailed specifica-
tion provided for selected use-cases. Typically, use-case specifications are written in
natural language. There are commonly accepted templates for use-case specification
as well as useful guidelines how to write effective use-cases [3].
The alternative to natural language is to use notations with at least formally de-
fined syntax (also called meta-model). In [11] there are five distinct groups of meta-
models defined:
− State oriented meta-models, which allow to model a system in terms of states and
transitions. The transitions are trigged in reaction of some external stimulus. The
instances of this meta-model are: finite state machines, state charts, or Petri nets.
28

− Activity oriented meta-models, which allow to model a system in terms of activi-
ties and transitions showing the control flow, however, often also data flow could
be presented. The instances of this meta-model are: data flow diagrams (DFDs),
flowcharts, or UML activity diagrams.
− Structure oriented meta-models, which allow to show the system decomposition in
terms of modules and the relationships between them. The instances of this meta-
model are e.g.: UML package diagrams, UML component diagrams.
− Data oriented meta-models, which allow to model a system as a collection of enti-
ties together with their properties. The instances of this meta-model are: entity re-
lationship diagrams or UML class diagrams.
The expressiveness of all techniques used for SRS representation is equivalent,
what is not true for quality factors like analyzability or unambiguouity.
3 Related Works
Comprehensibility is the quality attribute that has most frequently been empirically
studied [4].
The paper [4] provides a short description of 24 experimental studies (conducted
till 2008) on comprehensibility, which were evaluated to determine their practical
value. What is interesting, neither activity diagrams nor comparison of selected by us
specification techniques were there mentioned.
Below, the results of selected experiments, being the inspiration for our own, are
presented.
The paper [9] presents a controlled experiment which aimed at comparison of two
specification styles, namely white-box and black-box, concerning their understanda-
bility. The subjects in the experiment were 22 graduate students from the Computer
Science Department (University of Kaiserslautern) with little experience with both
types of requirement specifications. The understandability was measured by time of
filling the questionnaire with set of questions, and the correctness of given answers.
The results of the experiment confirmed that black-box requirements specifications
are easier to understand from a customer point of view than white-box specifications.
Authors of [8] compared comprehension of analysis specifications written in
FOOM (combination of functional and object-oriented paradigms) and OPM (Object
Process Methodology). The subjects in the experiment were 126 students from the
Department of Industrial Engineering and Management (Ben-Gurion University). The
students were previously trained with the methodologies during specific courses. Two
different case-studies were prepared (IFIP Conference, the Greeting Cards) with both
notations. Along with the specifications, authors prepared for each case study a ques-
tionnaire consisting of 40 ‘true’/‘false’ statements about facts appearing in the dia-
grams. The start and end times of filling the questionnaire were recorded to enable
measuring the time it took to complete the comprehension tasks. It was found that the
analysis specifications written in FOOM are more comprehensible than those written
in OPM, but this is true only with respect to the functional model. Additionally it
takes less time to comprehend FOOM specifications.
29

The paper [5] presents the experiment conducted to compare the notations of UML
Activity Diagrams (ACTs) and Event-driven Process Chains (EPCs). One of the per-
spectives investigated was a customer or end-user point of view with focus on effec-
tiveness during model validation. The subjects in the experiment were non-IT experts,
e.g. students from various fields (medicine, chemistry), university graduates and peo-
ple in leading positions. To find the answer for the question: “Which of the two nota-
tions is easier to understand?” authors measured the number of incorrect answers
about the content. The obtained results were unclear (the t-test did not show signifi-
cant results).
4 Experiment Description
The purpose of this section is to provide all information that is necessary to replicate
the experiment, such as goals, participants, materials, tasks, hypotheses, etc. Accord-
ing to [4] in the experiment description following elements should be described: type
of task, language expertise, domain expertise, and problem size.
4.1 Experiment Planning
The goal of the experiment was to compare the readability of techniques based on
natural language with activity diagrams.
The experiment was done from system analyst or developer perspective who is fa-
miliar with different SRS notations, must understand the domain and the requirements
for further system development. The assumption was that a subject has more
knowledge on the modeling language than knowledge of the domain.
4.2 Hypotheses
Comprehension is associated with a cognitive process [4]. It is very difficult to an-
swer directly the question ‘What is more readable?’. We took two elements into ac-
count – the subjective perception of the readability (how easy is to read something),
and the accuracy of the understanding of what was read (the degree to which some-
thing was understood).
Thus, our experiment had two goals. The first goal was to determine which nota-
tion is subjectively easier to read (is more user friendly). The measure used for its
evaluation was task completion time (T). This motivated the hypothesis stated as:
Hypothesis 1. The natural language notations are subjectively more readable than
activity diagram notation.
Hypothesis 1 was decomposed into two sub-hypothesis and formalized as:
Hypothesis 1a:
H
0
1
: Average(T
Natural_langage
) = Average(T
Activity_diagrams
)
H
1
1
: Average(T
Natural_langage
) < Average(T
Activity_diagrams
)
Hypothesis 1b:
H
0
2
: Average(T
Use-case_model
) = Average(T
Activity_diagrams
)
30

H
1
2
: Average(T
Use-case_model
) < Average(T
Activity_diagrams
)
The second goal was to determine which notation is better understood (provides
more accurate knowledge about the system requirements). The measure used for that
was number of correct answers for question about specification content (N). This
motivated the hypothesis stated as:
Hypothesis 2. The natural language notations are objectively less readable than
activity diagram notation (natural language notations are more ambiguous).
Hypothesis 2 was decomposed into two sub-hypothesis and formalized as:
Hypothesis 2a:
H
0
3
: Average(N
Natural_langage
) = Average(N
Activity_diagrams
)
H
1
3
: Average(N
Natural_langage
) < Average(N
Activity_diagrams
)
Hypothesis 2b:
H
0
4
: Average(N
Use-case_model
) = Average(N
Activity_diagrams
)
H
1
4
: Average(N
Use-case_model
) < Average(N
Activity_diagrams
)
4.3 Experiment Subjects
The subjects in the experiment were 36 undergraduate students from the Faculty of
Informatics and Management (Wroclaw University of Technology) who positively
finished the courses: Introduction to Software Engineering (one semester), and Soft-
ware System Development (one semester). The courses equipped the students in theo-
retical and practical knowledge about requirements engineering, especially – nota-
tions used within experiment. In must be mentioned that many students (about 50%)
taking part in the experiment are working in IT companies (part-time or full-time job)
as programmers, testers, network administrators or business analysts.
The participants were divided into 3 groups – each one dedicated to check compre-
hensibility of one technique. The division was done on the base of people preferences
– they were ask to select the group in which they fill the most competent:
− Group A (Specification in natural language) – 13 participants.
− Group B (Use-case model) – 12 participants.
− Group C (Activity diagram) – 11 participants.
4.4 Instrumentation
Every experiment participant was given a specification of the same system expressed
in one of three notations. The domain was unknown for the subjects. The specifica-
tions described functionality for a debtors’ register system, e.g. adding debtors, look-
ing for a debtor etc. The domain is regulated by existing polish law. Some function-
alities were paid and available depending on the payment package. One of the authors
– being the domain expert – prepared all three versions of system specification, while
the other checked if they are syntactically correct, and readable.
The following materials were prepared and provided to the participants:
31
− Group A: glossary of basic terms (9 items, 1 page, 299 words in Polish), descrip-
tion of expected functions expressed in natural language (2 pages, 621 words in
Polish); business rules were not expressed separately.
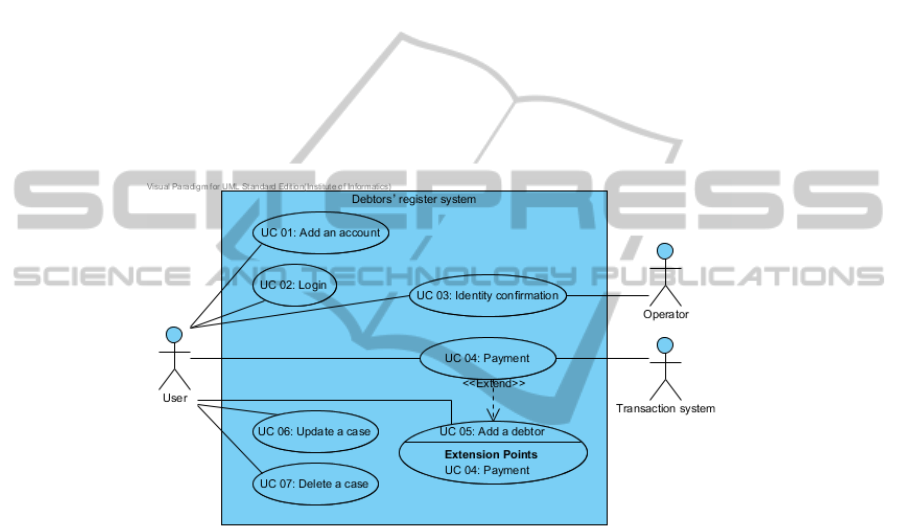
− Group B: glossary of basic terms (9 items, 1 page, 299 words in Polish), specifica-
tion of business rules (8 rules, 207 words in Polish), 1 use-case diagram – see fig.
1, and detailed description for all use-cases (5 pages, 1256 words in Polish) written
according to [3] guidelines; the use-cases descriptions were structured and con-
tained e.g. main flow of events, alternative flow of events, exceptional flow of
events, pre and post-conditions; business rules were described partially separately,
and partially were included also in use-case detail descriptions.
− Group C: glossary of basic terms (9 items), 6 activity diagrams with short accom-
panying descriptions (154 words in Polish); the activity diagrams described func-
tionality of 7 use-cases (one of them presented two use-cases); an example of the
easiest diagram is presented in Fig. 2; business rules were directly represented in
the diagrams (sometimes in form of notes).
Fig. 1. The use-case diagram for debtors’ register system.
For checking the understandability of SRS a questionnaire was elaborated (the same
for all experiment’s participants). The questionnaire consisted of 10 questions: 4
closed (one choice from four), and 6 open ended. The questions asked about the ex-
pected software behavior (e.g. What information must be given by a customer about
debtor's obligations when appending the debtor to the register?) as well as about some
constraints (e.g. What types of debtors can be added to the register?) or business rules
(e.g. What is the minimum amount of a company’s debt that allows to add the com-
pany to the register?).
Questionnaires were filled on-line. This form was easier to conduct research and to
gather results.
32
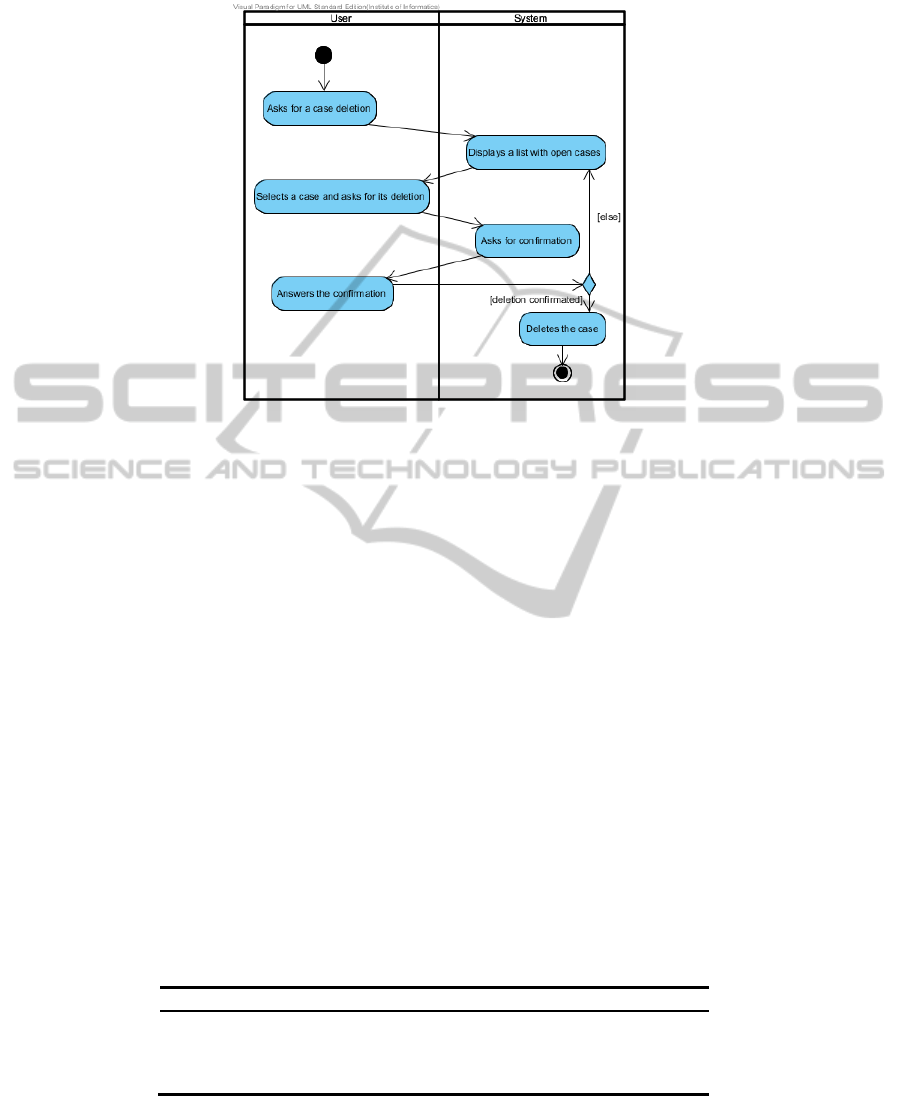
Fig. 2. The activity diagram presenting the behavior of delete a case functionality.
The start and end times of filling the questionnaire were recorded to enable measuring
the time it took to complete the task. Additionally, after the experiment, the number
of correct answer was counted manually for each questionnaire respondent.
4.5 Data Analysis
In this section we present the measures taken after the experiment and the results of
the data analysis performed for each of the hypotheses. All hypotheses were investi-
gated by means of outlier analysis to identify any extreme values. In order to investi-
gate whether the observed differences were statistically significant, we performed
selected statistical tests. All calculations were done with the use of SPSS Statistics
tool.
Table 1. presents the basic statistics for task time completion depending on the
specification notation. At it is easily observed, the subjectively easiest notation to
read is natural language. Activity diagrams were placed in the middle before use-case
model, what was a little surprise. The reason for that could be the fact that use-case
model was almost twice as long as natural language description, and even longer than
activity diagram specification.
Table 1. Descriptive statistics for task time completion depending on the specification nota-
tion.
Notation Min Max Mean Std. Dev
Natural language (N=13) 0:10:30 0:27:00 0:17:50 0:05:12
Use-case model (N=12) 0:13:00 1:07:23 0:31:50 0:16:56
Activity diagram (N=11) 0:12:00 0:41:00 0:22:50 0:08:13
33

The outlier analysis of the data related to hypothesis 1 did not show any extreme
values and hence we did not have to remove data from the data set.
Firstly, we confirmed that obtained results had normal distribution (what was
checked by the Shapiro-Wilk test), after that for the hypothesis 1a we could use the
Levene’s test and t-Student test.
The Levene’s test showed the significant result (p = 0,151 > 0.05 = α), so we could
assume equality of variances and took into account the t-test result t=-1,80, which is
less than one-sided value of critical region equal to -1,717. In the conclusion, the null
hypothesis could be rejected and the alternative one accepted instead.
In the case of hypothesis 1b we can’t to reject the null hypothesis, and we even had
not made any calculations because the mean time for use-case model notation was
greater than for activity diagram.
Table 2. presents the basic statistics for number of correct answers depending on
used notation.
Table 2. Descriptive statistics for number of correct answers depending on the specification
notation.
Notation Min Max Mean Std. Dev
Natural language (N=13) 7 10 8,62 0,96
Use-case model (N=12) 5 9 7,75 1,29
Activity diagram (N=11) 7 10 9,18 0,87
It can be observed that activity diagrams are those with most unambiguous inter-
pretation. Once again, the use-case model specification appeared to produce worse
results than natural language specification. The reason for that could be the fact that
in the former the business rules were spread into many places (some of them were
present in a separate section, some others presented directly in use-case description).
This specification should have been not only carefully read but also remembered.
Some questions turned out more difficult than the other. Especially question 6 was
extremely difficult – only a small number of subjects managed to answer it correctly -
30% for natural language (4 people), 33% for use-case model (4 people), 36% for
activity diagrams (4 people) . However, even for it, the percentage of correct answers
was a little bit higher for activity diagrams than for notation used natural language.
The outlier analysis of the data related to hypothesis 2 did not show any extreme
values and hence we did not have to remove data from the data set. Because in the
case of activity diagram results had not a normal distribution, we was forced to use
one of non-parametric tests for hypothesis verification. We decided to use the Mann-
Whitney test.
The value of U test (U = 46) for the hypothesis 1a does not allow to reject the null
hypothesis. However, the value U = 21 for the hypothesis 1b is outside the critical
region (34; 109) for α=0,05, what means that the activity diagram specifications can
be more correctly interpreted than Use-case model specifications.
The fig. 3 compares the relation between correctness and user-friendliness for con-
sidered specification techniques.
34
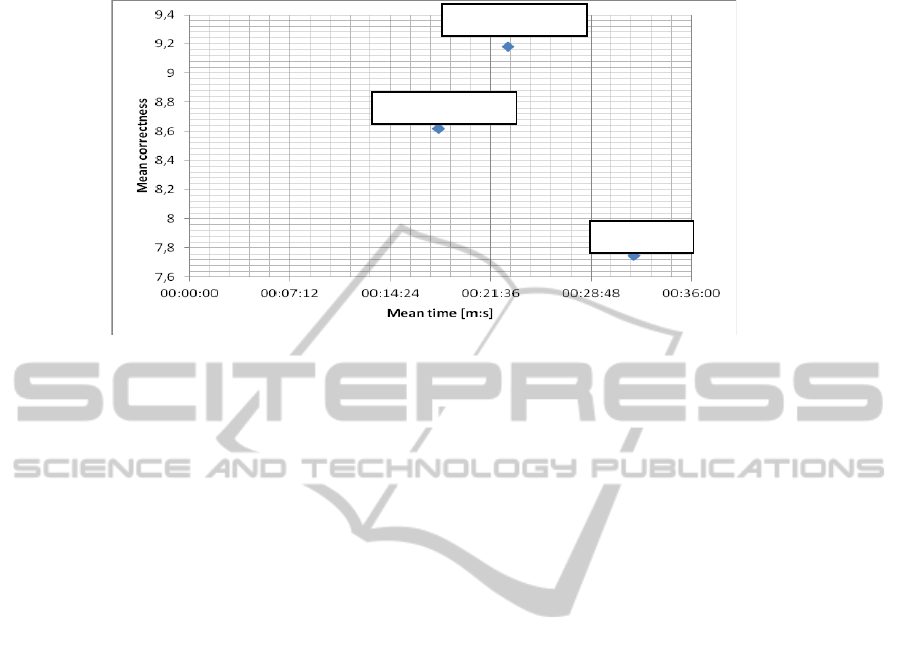
Fig. 3. The relation between mean time of task completion and mean correctness for considered
specification techniques.
Activity diagrams had highest correctness (what was expected). Of course, the time
needed for their interpretation is longer than for interpretation of specification written
in natural language, but it is shorter than for specification written in a structural way
(use-case model).
5 Conclusions
The first goal of our investigation was to determine which notation (those based on
natural language or that using formal notation) are easier to read. The experiment
conducted by us partially confirmed the hypothesis 1, that natural language notations
are subjectively more readable than activity diagram notation. The assumption was
true for natural language, and activity diagram specifications. We were surprised to
find out that the mean time to study the use-case model was longer than the mean
time to study activity diagrams. But the explanation for that is that the former was
longer than the latter, and the participants spent more time for finding proper infor-
mation in it. What more, the experiment attendants were accustomed to read graphical
specifications.
The second investigated hypothesis stated that natural language notations are more
ambiguous than formal notations. Similarly to the previous case, this was partially
confirmed by the experiment, but here the differences were statistically significant for
the pair: use-case model, and activity diagrams.
On the base of obtained results we recommend to use activity diagrams to repre-
sent at least parts of SRS specification, especially for non-trivial system behavior. As
the context of activity diagram is typically a use-case, we suggest to combine use-
case diagrams with activity diagrams. Use-case diagram together with use-case speci-
fications brings well structured SRS, but long textual descriptions of particular use-
Natural Language
UC Model
Activity diagrams
35

cases when reasonable should be replaced with activity diagrams. Being more pre-
cise, in our opinion SRS should consists of following artifacts:
(a) business glossary – defining main terms from the problem domain,
(b) use-case diagram – presenting the system boundary,
(c) activity diagrams for selected (not trivial) use-cases accompanied by at least short
descriptions presenting the aim of the use-case and business rules (not directly ex-
pressed on the activity diagram),
(d) textual specification for trivial use-cases (e.g. CRUD), mainly presenting in-
put/output together with business rules to be satisfied.
In future work we plan to perform more experiments checking the validity of the
recommendations given above, especially in the context of incremental software
development. In such a case an analyst/developer needs to have a general picture of
the whole but does not need to remember all details at once.
References
1. Attempto Project, http://attempto.ifi.uzh.ch/site/
2. Booch G., Rumbaugh J., Jacobson I.: The Unified Software Development Process, Addison
Wesley (1999).
3. Cockburn A.: Writing effective use-cases. Addison-Wesley (2001)
4. Condori-Fernández, N., Daneva, M., Sikkel, K., & Herrmann, A.: Practical Relevance of
Experiments in Comprehensibility of Requirements Specifications. International Workshop
on Empirical Requirements Engineer. Trento: IEEE Computer Society (2011) 21–28.
5. Gross, A., & Doerr, J.: EPC vs. UML Activity Diagram – Two Experiments Examining
their Usefulness for Requirements Engineering. In: Proceedings of the 2009 17
th
IEEE
International Requirements Engineering Conference. IEEE Computer Society, Washington,
DE, USA (2009)
6. Gursimran, S. W., & Carver, J.: A systematic literature review to identify and classify
software requirement errors. Information and Software Technology, Vol. 51, Iss. 7,
(2009)1087–1109.
7. IEEE Recommended practice for software requirements specification. IEEE Standard 830–
1998
8. Kabeli, J., & Shoval, P.: Comprehension and quality of analysis specifications – a
comparison of FOOM and OPM methodologies. Information and Software Technology.
(2005) 271–290
9. Kamsties, E., Knethen, A. V., & Reussner, R.: A controlled experiment to evaluate how
styles affect the understandability of requirements specifications. Information and Software
Technology Vol. 45, (2003) 955–965
10. Lauesen S.: Software requirements, London, Addison-Wasley (2002)
11. Machado, R., Ramos, I., & Fernandes, J. (brak daty). Specification of Requirements
Models. In: Aybüke Aurum, Claes Wohlim (Eds.), Engineering and Managing Software
Requirements, chap. 3, Springer-Verlag, Berlin Heidelberg, Germany (2005) 47–68
12. OMG Unified Modeling Language (OMG UML), Superstructure Version 2.3, (2010),
http://www.omg.org/spec/
13. OpenUP, http://epf.eclipse.org/wikis/openup/
14. Phalp, K., Adlem, A., Jeary, S., Vincent, J., & Kanyaru, J.: The role of comprehension in
requirements and implications for use case descriptions. Software Quality Journal, (2011)
461–486.
36
