
Rate-based Simulation of Coke Calcination in Rotary Kilns
E. M. Elkanzi, F. S. Marhoon and M. J. Jasim
Chemical Engineering Department, University of Bahrain, Isa Town, Kingdom of Bahrain
Keywords: Rotary Kiln, Calcining Processes, Rate-based HYSYS Simulation.
Abstract: This paper presents the simulation of the green petroleum coke calcining processes using the simulation
program ASPEN HYSYS. The results are validated using actual industrial data. The present study provides
a detailed description of the rate-based simulation. It considers the rate of physical and chemical phenomena
of interest: the rate of moisture removal, the rate of volatile matter release and combustion, and the rate of
coke dust and sulfur combustion. Data supplied by a local coke calcining kiln in operation are used to
validate the simulation results. It is found that the rate-based simulation can be implemented as a useful tool
to predict the operating conditions needed to control the content of undesirable impurities in the calcined
petroleum coke, namely, sulfur, volatile matter and moisture contents. Except for the metal content, the
simulation shows that it is possible for the kiln operator to process any type of green coke for varying sulfur,
volatile matter and water contents by adjusting the amount of tertiary air and/or fuel.
1 INTRODUCTION
Aluminum industry anodes demand high quality
standard of calcined petroleum coke (CPC). It
requires a coke with no moisture, no volatile matter
and low sulfur contents with an appropriate
crystalline structure. This is achieved through
calcination processes. It is accomplished by gradual
heating of the green coke (GC) at ambient
temperature to a temperature of around 1390°C in a
rotary kiln (calciner). The kiln is operated as a
counter-flow heat exchanger as described by Elkanzi
(Elkanzi, 2007).
The determination of the calciner operation
conditions are based on the following specifications
of the GC: the moisture, the sulfur, the volatile
matter (VM), and the metal contents. If any of these
are not within the specified CPC requirements, then
the operating conditions of the calciner should be
adjusted in order to meet the allowable limit.
However, if the problem in the GC is related to the
metal content, then blending of different GCs is
necessary to meet the desired conditions because
metals cannot be removed by the calcination
processes.
Elkanzi (Elkanzi, 2007) has reviewed different
mathematical models which have been developed to
describe petroleum coke calcination processes in
rotary kilns. Some previous simulators were mainly
written programs to solve the sets of simultaneous
differential equations representing: the material
balances, the energy balances, and the chemical
reactions along the kiln (Li & Friday, 1974; Perron
et al., 1990; Perron et al., 1992; Bui et al., 1993;
Martins et al., 2001).
In a previous publication (Elkanzi, 2007), the
rotary coke calcining kiln processes were simulated
using a commercial simulator. The reactions were
simulated as conversion reactions and the values of
the conversions were obtained from a real kiln data.
The objective of this study is to simulate the
rotary kiln processes based on the rate of these
processes. The rate-based simulation would improve
the prediction of the kiln operating conditions that
control the contents of undesirable impurities in the
calcined coke. The commercial software ASPEN
HYSYS was used for this purpose and the processes
were assumed to take place in mixed reactors in
series along the rotary kiln.
2 RATE OF CALCINATION
PROCESSES
The calcination processes are visualized to take
place in three zones inside the kiln, as illustrated in
Figure 1. In the moisture release zone, the water is
removed from the coke at temperatures up to 400°C,
5
Elkanzi E., Marhoon F. and Jasim M..
Rate-based Simulation of Coke Calcination in Rotary Kilns.
DOI: 10.5220/0004008400050010
In Proceedings of the 2nd International Conference on Simulation and Modeling Methodologies, Technologies and Applications (SIMULTECH-2012),
pages 5-10
ISBN: 978-989-8565-20-4
Copyright
c
2012 SCITEPRESS (Science and Technology Publications, Lda.)
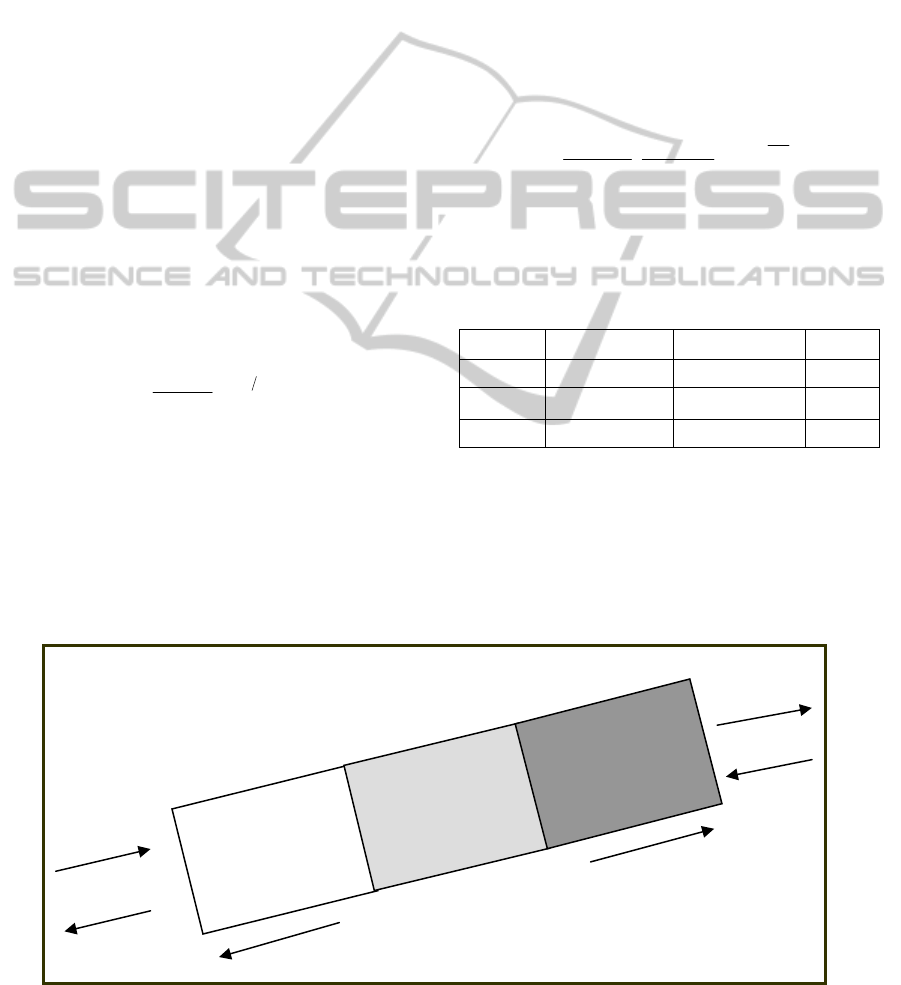
while the volatile matter (VOC) is driven off the
coke between 400 and 600 °C. Then, the volatile
matter is combusted between 600 and 1000 °C in the
VOC release and combustion zone. Finally, the fuel
is combusted, the coke de-sulfurized and the carbon
oxidized in the temperature range from 1250 to
1400°C in the fuel combustion and calcined coke
zone. All zones are simulated as continuous stirred
tank reactors.
2.1 Moisture Release Rate
The water in the pores of the coke is heated by the
counter flow of the flue gases in the kiln and
evaporated. The evaporation reaction may be
represented by:
2() 2()lg
HO HO→
(1)
However, the use of kinetic reaction in the
HYSYS requires that either water liquid or water
vapour to be represented by a hypothetical
compound having the same properties as that of
water.
The water release rate was described as a first
order reaction (Lyons, et al, 1962) and given by:
()
ERT
cc
www
b
XG
RkX e
MW u A
−
⎛⎞
=
⎜⎟
⎜⎟
⎝⎠
(2)
Where k
w
is a constant equals to 2.549x10
7
s
-1
and E
is the release energy of about 4.1942x10
4
J/mol.
2.2 VOC Release Rates
The VOCs entrained in the pores of the coke are
heated by the counter flow of the flue gases in the
kiln and evolve into the gas phase. De-sorption and
evaporation “reactions” may be represented by:
)(
4
)(
4
g
CH
ad
CH →
(3)
)(
2
)(
2
gad
HH →
(4)
)(
1218)(1218
g
l
HCHC →
(5)
Hypothetical compounds were introduced with
the same properties as that of the real VOCs. The
rate of release of VOCs from the bed to the vapour
phase was obtained from the experimental data of
Dernedde et al (Dernedde, et al, 1986 and reported
by Martins, et al, 2001) and is described by the
following empirical correlation:
()
()
0
0
E
n
cc v
RT
vv v
n
vb
cv
XG X
Rk X e
MW u A
XX
−
⎛⎞
=
⎜⎟
⎜⎟
⎝⎠
(6)
The values of the constants in Eq. (6) are given in
Table 1.
Table1: Empirical constants for evaluating VOC release
rates (Dernedde, et al., 1986).
VOC k
v
(s
-1
) E(J mol
-1
) n
H
2
9.17x10
1
4.37x10
4
1.5
CH
4
1.49x10
6
1.75x10
5
2.0
C
18
H
12
1.09x10
-1
1.25x10
5
1.5
2.3 Combustion of VOC Rates
The combustion of VOCs was simulated by kinetic
expressions in HYSYS. The VOCs released from the
coke bed are oxidized by oxygen in the hot gases
and would combust depending on the amount of
Figure 1: Calcining Processes Zones.
Fuel
Combustion &
Calcined Coke
Zone
VOC Release &
Combustion
Zone
Moisture
Release Zone
Fuel
+Ai
r
CPC
FG
GP
1250-1400 °C
600 - 1000 °C
25 - 600 °C
55 m
SIMULTECH2012-2ndInternationalConferenceonSimulationandModelingMethodologies,Technologiesand
Applications
6

tertiary air entering this zone. The reactions may be
represented by:
OHCOOCH
2224
22 +→+
(7)
OHOH
222
22 →+
(8)
18 12 2 2 2
21 18 6CH O CO HO+→ +
(9)
The rates of combustion of methane and
hydrogen as released from the bed to the gas phase
were obtained from the experimental data of
Srinivasan (Srinivasan, et al., 1998) as:
()()
442
30196
0.5 1.5
11
710
g
T
CH CH o
Ryye
−
−
=×
(10)
[][]
2
20634
0.85 1.42
11
22
2.45 10
g
T
H
RHOe
−
=×
(11)
The rate of combustion of tar can be described
by the empirical equation (Dernedde, et al, 1986;
Howard, et al, 1973):
[][ ][ ]
0.5 0.5
22
E
RT
ch ch
RkchO HOe
−
=
(12)
The values of the constants were as shown in Table 2.
Table 2: Constants of the combustion of Tar rate
expression.
k
ch
(cm
3
/ mole-s)
E
(J/ mole)
Reference
1.8 x10
13
1.32x10
5
Dernedde, et al.,
1986.
1.3 x 10
14
1.25x10
5
Howard, et al.,
1973.
2.4 Desulfurization and Carbon
Oxidation Rates
The de-sulfurization and carbon dust oxidation
reactions were simulated as two reactors. Oxygen
from tertiary air reacts with the sulfur and the carbon
dust to produce SO
2
, CO
2
and CO according to the
following reactions:
22
COOC →+
(13)
COCOC 2
2
→+
(14)
22
SOOS →+
(15)
The rates of entrained coke fines burn-up were
reported in (Li, and Friday, 1974) and described by
the following equations:
[]
2
30800
13
2
6.84 10
g
T
f
CO
SL
ROe
V
−
Δ
⎛⎞
=×
⎜⎟
⎜⎟
⎝⎠
(16)
()
2
62180
0.5
12
1.08 10
12.01 1
24624
2887
g
g
SL
T
f
eP
CO
V
R
CO
P
co
X
T
e
−
⎛⎞
⎜⎟
Δ
⎛⎞
⎜⎟
× ⎜⎟
⎜⎟
⎜⎟
⎝⎠
⎜⎟
⎝⎠
=
⎛⎞
⎛⎞
⎜⎟
⎜⎟
⎜⎟
⎜⎟
+
⎜⎟
⎜⎟
⎛⎞
⎜⎟
⎜⎟
−
⎜⎟
⎜⎟
⎜⎟
⎜⎟
⎝⎠
⎝⎠
⎝⎠
(17)
The rate of carbon monoxide can be simplified by
neglecting the 1 in the dominator since the term
{P
CO
/ (2887 e (-24624/Tg))} is much greater than
one, and hence equation (17) becomes:
()
()
2
86804
0.5
14
1.0
2.62 10
g
CO
T
f
CO
CO
P
SL
Re
V
P
−
Δ
⎛⎞
=×
⎜⎟
⎜⎟
⎝⎠
(18)
The rate of oxidation of sulfur was reported (Lu,
et al., 2004) and is described by:
SV
T
s
CeR
4360
11
101.1
−
−
×=
(19)
Since the units of Csv are in molecule/ cm
3
,
multiplying by Avogadro’s number yields:
SV
T
s
CeR
4360
12
106.6
−
×=
(20)
2.5 Fuel Combustion Rate
The fuel used in the kiln was natural gas and hence
the rate of the fuel combustion is as given by
equation (10). The results of the kinetic equation
(10) were compared with normal conversion
reaction and showed great deal of agreement.
3 HYSYS SIMULATION
The HYSYS simulation flow sheet of the coke
calcinations processes is depicted in Figure 2 which
shows the three calcination zones. The simulation
was based on actual GC industrial data (ALBA
2010). Process simulation assumes good mixing
inside the kiln; which is accomplished by rotating
the kiln at an inclined position as well as by the
presence of tumblers. Moreover, it was assumed that
the reactions take place effectively in the gas phase.
As a result of these assumptions, the calcination
Rate-basedSimulationofCokeCalcinationinRotaryKilns
7

processes were simulated to take place inside
adiabatic continuous stirred-tank reactors. It is to be
noted that there is no sharp demarcation between
these reactors. In fact part of the VOCs is released in
the moisture release “reactor” and a very little
amount of VOCs is combusted in the VOC release
“reactor” since the release zone is oxygen deficient.
The simulation procedure is similar to the one
used before (Author, 207) featuring the concept of
using “recycle” to simulate counter-current mass
flow that is not allowed by HYSYS. The combustion
of fuel (CH
4
) is simulated by fuel combustion
reactor, FCR, which is a conversion reactor. The flue
gas from the burner is mixed with the outputs from
the VOC combustion reactor (VOCCR) and enters
the carbon combustion reactor (CCR). The CCR is
simulated using equations (16) and (18), for which
the carbon dust was simulated by hypothetical
“carbons” so as not to confuse them with the rest of
the coke carbon that was assumed not to react in the
solid phase. The output from CCR enters the
desulfurization reactor (DSR) that was simulated
using equation (20). The solid output from DSR is
the calcined coke product. The gas output is the
“recycle stream” which is split into three streams:
the first is mixed with the fresh GPC and enters the
moisture release reactor (MRR, simulated using
equation (2), for which the product water was
simulated by a hypothetical water component), the
second is sent to the VOC release reactor (VOCRR),
and the third is mixed with the gas output from the
MRR to form the flue gas that is sent to the
incinerator. It may be noted here that the split ratio
of the recycle stream is determined by trial and error
in order for the temperature in MRR, VOCRR and
VOCCR to fall within the operating range shown in
Figure 1. Since it is assumed that the VOCs and
sulfur are not released in the MRR, they were mixed
and sent to the VOC release reactor (VOCRR) that is
simulated using equation (6) and the data of Table1.
The components in the release equations (3), (4) and
(5) were simulated by hypothetical components. The
output from VOCRR is mixed with tertiary air and
sent to the VOCCR that was simulated using
equations (10), (11), (12), and the data in Table 2.
4 RESULTS AND DISCUSSION
Coke kiln industrial data (ALBA 2010) are
compared with the simulation results using the same
input feed and conditions. At this initial stage of
work, the comparison is made between the
compositions, flow rates, the temperature of the
CPC, and the flue gas streams. The simulation
results are depicted in Table 3 with the industrial
values. There is a good agreement between the
simulation results and the industrial results deviation
of 11%.
The comparison reveals that the prediction of
sulfur in the CPC is exact (zero error). However, the
zero sulfur is an over prediction since oxidation of
sulfur as predicted by equation (20) is considered
only in the vapor phase.
It was found that the predicted CPC temperature
is less than the industrial value by 0.9 %. However,
the CPC real density is a function of temperature
(Ibrahim and Ali, 2004), and hence the
underestimate of the CPC temperature will have
very little effect on the results.
The simulated flue gas temperature was higher
than the actual data by about 11%. This can be
explained by looking into the composition of the
Figure 2: HYSYS Simulation of Kiln Processes.
SIMULTECH2012-2ndInternationalConferenceonSimulationandModelingMethodologies,Technologiesand
Applications
8
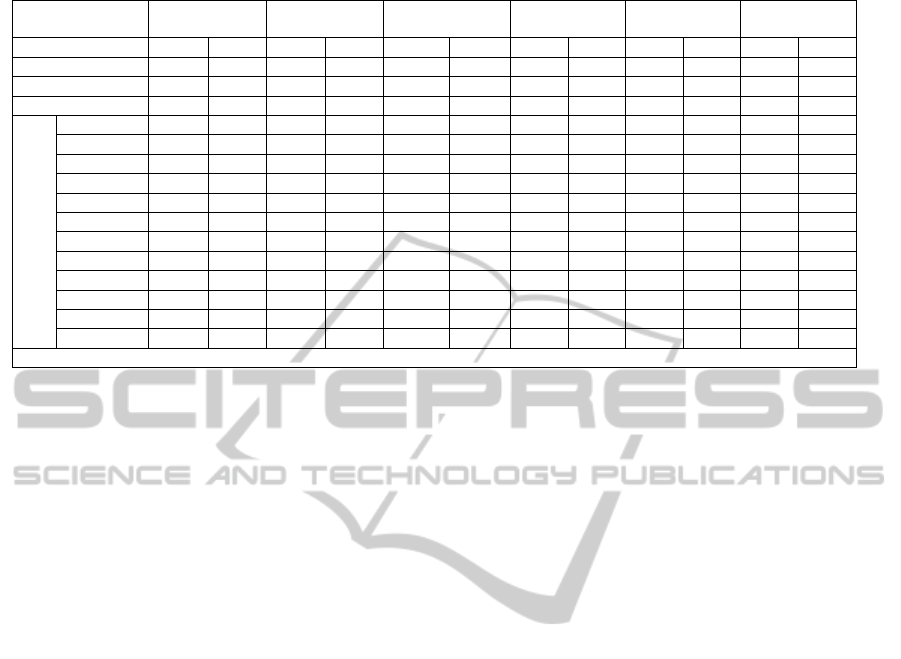
Table 3: Simulation Results.
Stream GPC CPC FG Tertiary Fuel Fuel Air
Condition 1 2 1 2 1 2 1 2 1 2 1 2
Temperature (K) 293 293 1663 1650 1373 1499 293 293 293 293 293 293
Pressure ( kPa) 120 120 120 120 120 120 120 120 120 120 120 120
Flow Rate (kg/s) 9.7 9.762 7.44 7.27 20.60 20.62 14.0 14.0 0.276 0.276 4.77 4.77
Components Flow Rates ( kg/s)
C 7.925 7.925 - - 0.24 - - - - - - -
C* 0.0 0.062 - - - - - - - - - -
CH
4
0.394 0.394 - - 0.242 - - - 0.276 0.276 - -
H
2
0.528 0.528 - - 0.314 0.4 - - - - - -
C
18
H
12
0.134 0.134 - - 0.072 - - - - - - -
H
2
O 0.51 0.51 - - 3.03 3.41 - - - - - -
N
2
- - - - 14.34 14.34 10.68 10.68 - - 3.66 3.66
CO
2
- - - - 1.84 2.24 - - - - - -
CO - - - - 0.43 0.077 - - - - - -
SO
2
- - - - 0.060 0.069 - - - - - -
S 0.211 0.211 0.169 - 0.0055 - - - - - - -
O
2
- - - - - 0.057 3.24 3.24 - - 11.53 11.53
1 Industrial data , 2 this study , C* carbon dust
flue gas where almost all volatile components and
carbon dust were oxidized adding more heat than
that of the industrial case. Moreover, the assumption
of adiabatic operation would add to the overall rise
in temperature.
5 CONCLUSIONS
This paper addressed the determination and
adjustment of the green petroleum coke calcination
in order to meet the allowable limits of the calcined
coke specifications. The methodology is to simulate
the processes that describe green petroleum coke
calcination. The simulation was based on using
physical and chemical reaction rate equations. The
results of the simulation were compared with actual
industrial rotary kiln data and there was a good
agreement. The methodology of rate-based
simulation described in this study may be used to
predict coke calcining kilns performance regardless
of the green coke composition. The sensitivity of the
kiln performance to changes in green coke
composition, fuel and tertiary air flow rates is left
for future work. Further validations using industrial
data are also necessary.
REFERENCES
ALBA, Private communication.
Bui, R. T., Perron, J., and Read, M., 1993. Model-based
optimization of the operation of the coke calcining
kiln, Carbon. 31; 7; 1139-1147.
Dernedde, E, Charette, A., Bourgeois, T., and Castonguay,
L., 1986. Kinetic Phenomena of the Volatiles in Ring
Furnaces. Light Met. Pcoc. Tech, Sess. AIME 105
th
Annual Meeting. 589.
Elkanzi, E. M., 2007, Simulation of the Coke Calcining
Processes in Rotary Kilns, Chemical Product and
Process Modeling, 2, 3, Article 20.
Howard, J. B., Williams, G. C., and Fine, D. H., 1973.
Kinetics of Carbon Monoxide Oxidation in Post flame
Gases. 14
th
International Symposium on Combustion.
975-985.
Ibrahim, H. A., and Ali, M. M., 2005. Effect of the
removal of sulphur and volatile matter on the true
density of petroleum coke. Periodica Polytechnica Ser
Chem. Eng. 49, 1, 19-24
Li, K. W., and Friday, J. R., 1974. Simulation of Coke
Calciners. Carbon. 12; 225-231.
Lu, C-W, and Wu, Y-J., 2004. Experimental and
theoretical investigations of rate coefficients of the
reaction S (
3
P) + O
2
in the temperature range 298-878
K). Journal of Chemical Physics. 121, 17, 8271-8278.
Lyons, J. W., Min, H. S., Parisot, P. F. and Paul, J. F.,
1962. Experimentation with a Wet-Process Rotary
Cement Kiln via the Analog Computer. Ind. Eng.
Chem. Process Des.Dev. 1; 1; 29-33.
Martins, A. Marcio., Oliveira, Leandro. S., and Franca,
Adriana. S., 1992. Modeling and Simulation of
Petroleum Coke Calcination in Rotary Kilns. Fuel.
80; 1611-1622.
Perron, J., Bui, R. T., and Nguyen, T. H., 1992.
Modelisation du four de calcination du coke de
petrole: 2- simulation du procede. Can. J. Chem.Eng.
70; 1120 - 1131.
Perron, J., and Bui, R. T., 1990. Rotary Cylinders: Solid
transport Prediction by Dimensional Rheological
Analysis. Can. J.Chem.Eng. 68; 61 - 68.
Srinivasan, R. J., Srirmulu, S., and Kulasekaran, S., 1988.
Mathematical modeling of fluidized bed combustion-
2: combustion of gases. Fuel. 77, 9/10, 1033-1043.
Rate-basedSimulationofCokeCalcinationinRotaryKilns
9

APPENDIX
Nomenclature
A area per unit axial length, m.
C species molar concentration, kgmol/m
3
E activation energy, kj/kmol
G mass flow rate, kg/s
k rate constant, s
-1
.
L axial distance along the kiln, m.
MW molecular mass, kg/kmol
P
i
partial pressure of species i, kPa
R
i
rate of reaction of species i, kmol/m
3
. S
Sf total surface area of the coke fines/unit length of
the kiln, m.
T temperature, K.
u velocity, m/s.
V volume of gas in the kiln, m
3
.
X mass fraction, kg/kg.
y mole fraction, kmol/kmol.
Subscripts
b coke bed.
c coke or carbon
ch tar
g gas phase
l liquid phase
o initial
voc volatile organic compound
v volatile
w water
SIMULTECH2012-2ndInternationalConferenceonSimulationandModelingMethodologies,Technologiesand
Applications
10
