
Applicability of Multi-modal Electrophysiological Data
Acquisition and Processing to Emotion Recognition
Filipe Canento
1
, Hugo Silva
1,2
and Ana Fred
1
1
Instituto de Telecomunicações, IST-UTL, Lisbon, Portugal
2
PLUX – Wireless Biosignals, Lisbon, Portugal
Abstract. We present an overview and study on the applicability of multimodal
electrophysiological data acquisition and processing to emotion recognition.
We build on previous work in the field and further explore the emotion elicita-
tion process, by using videos to stimulate emotions in several participants.
Electrophysiological data from Electrocardiography (ECG), Blood Volume
Pulse (BVP), Electrodermal Activity (EDA), Respiration (RESP), Electromyo-
graphy (EMG), and Peripheral Temperature (SKT) sensors was acquired and
used to classify the negative and positive emotions. We evaluate the emotional
status identification accuracy both in terms of the target emotions and those re-
ported by the participants, with recognition rates above 70% through Leave
One Out Cross Validation (LOOCV) with a k-NN Classifier.
1 Introduction
Over the last years, different authors have studied emotions and their components and
concluded about their crucial role in numerous areas of human life such as problem
solving, social interaction, decision-making, perception, and motivation, [7]. Emo-
tions are composed of two parts: a psychological and a physiological part. The former
is related with the individual cognitive aspect of emotion; the latter has to do with the
physiological responses that occur when an individual experiences an emotion. The
use of biosignals to study emotions is a growing research field with more and more
applications, [15].
In this paper we present an overview and study on the applicability of multimodal
electrophysiological data acquisition and processing to emotion recognition. We
developed a protocol for emotion elicitation and biosignal acquisition, for which
preliminary results were presented in [2]. The rest of the paper is organized as fol-
lows: in Section 2 a review of the State-of-the-Art in emotion recognition is given;
Section 3 summarizes the methodology and experimental setup proposed in; in Sec-
tion 4, we evaluate the emotion elicitation procedure, and present the emotion classi-
fication results; Section 5 outlines the main conclusions and presents ideas for future
work.
Canento F., Silva H. and Fred A..
Applicability of Multi-modal Electrophysiological Data Acquisition and Processing to Emotion Recognition.
DOI: 10.5220/0003891800590070
In Proceedings of the 2nd International Workshop on Computing Paradigms for Mental Health (MindCare-2012), pages 59-70
ISBN: 978-989-8425-92-8
Copyright
c
2012 SCITEPRESS (Science and Technology Publications, Lda.)

Table 1. Summary of emotion recognition studies.
Year Reference Recognition rate
2001 [16] 81%
2004 [11] 64-97%
2004 [13] 61.8%
2006 [12] 71%
2009 [10] 86.3%
2010 [15] 61%
2011 [2] 30-97.5%
2 State-of-the-art
Emotion recognition using electrophysiological data is one of the branches of the
Affective Computing field: a growing research field that merges emotions and com-
puters in many different applications (see [18] and references therein). Table 1 sum-
marizes some results found in State-of-the-Art work for emotion recognition using
biosignals. The work by [16] sought the classification of 8 emotions from BVP,
RESP, EDA, and EMG data; tests were performed in 1 subject with 81% recognition
rates.
In 2004, Haag et al. [11] used Neural Networks (NN) and obtained a classification
accuracy ranging from 64% to 97% for two components of emotion (arousal and
valence) of 1 subject; the authors used EMG, ECG, RESP, EDA, SKT, and BVP data.
By arousal we are referring to the physical arousal response to an emotional stimulus
(e.g., a stimulus may provoke excitement and thus high arousal or it may be boring
and provoke a low arousal response) and valence indicates whether an emotion is
negative, neutral, or positive.
In [13], the authors used data from the ECG, EDA, and SKT to classify 4 emo-
tions of 175 subjects using Support Vector Machines (SVMs); the accuracy was
61.8%. Leon et al. [12] also used NN in the pursuit of distinguishing positive, nega-
tive, and neutral emotions of 8 subjects; they used data from the BVP and EDA and
had recognition rates of 71%.
In [10], data from EEG, BVP, and EDA was also used to classify 4 emotions of a
subject while studying; they applied SVMs and k-Nearest Neighbors (k-NN) obtain-
ing a best result of 86.3%. In 2010, [15] presented an emotion classification frame-
work with Analysis of Variance (ANOVA), Principal Component Analysis (PCA), k-
NN, SVM, and NN; an accuracy of 61% was achieved with the use of EMGs and
EDA data to classify positive, negative, and neutral emotions of 21 subjects.
Recently, our team proposed a multimodal biosignal (ECG, BVP, EDA, RESP,
EMGs, and SKT) sensor data handling for emotion recognition, [2]; we applied k-NN
(k=5) to classify positive, negative, neutral, and a mix of different emotions of 20
subjects with recognition rates in the 30-97.5% range.
60
3 Methodology, Experimental Setup and Data Acquisition
Our team has been researching in Behavioral Biometrics and Affective Computing
since 2007 when a project called HiMotion began, [5]. Within that project, a protocol
was proposed to monitor Human Computer Interaction and acquire different electro-
physiological signals for the study of behavioral biometrics, [3].
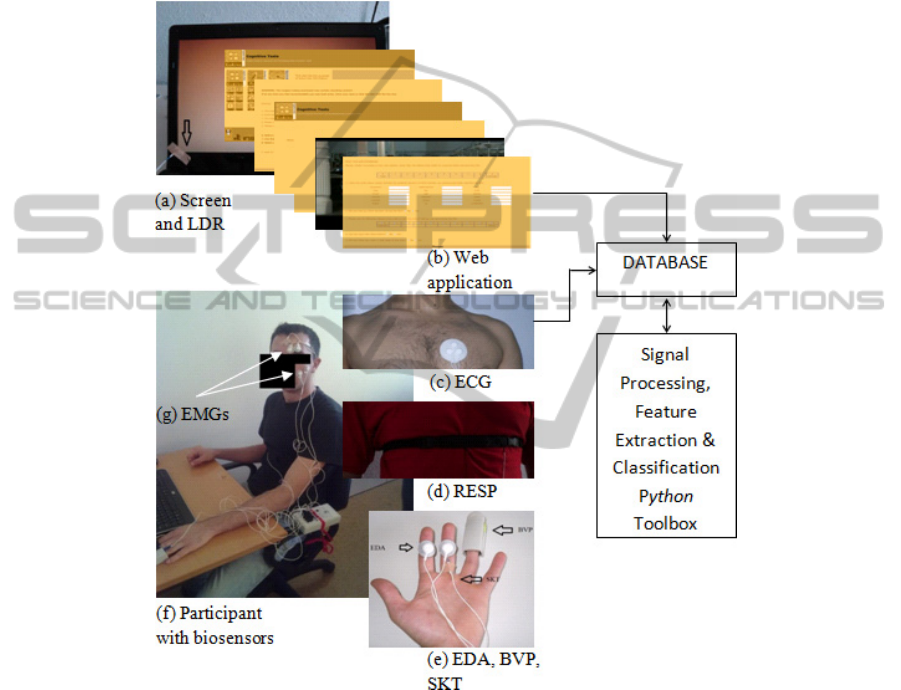
Fig. 1. Experimental setup and system architecture proposed in [2].
Later, in [1] and [2], we build upon the developed tools and results obtained and
added an emotion elicitation component so that we could study how biosignals and
emotions relate to each other. To elicit emotions, various techniques are available,
[1]. We decided to use videos as emotional stimulus as they are easy to use and pro-
vide reasonable results, [17], [19]. Based on the experience setup by [17] and [19],
we designed a Web application for video visualization.
The experience took the participant through the steps of Figure 3: (a) welcome
page; (b) participant information; (c) protocol briefing; (d) light brown screen time
61

for a period of 30 seconds; (e) full screen video; (f) questionnaire about the emotions
felt during the video. Steps (d), (e) and (f) were repeated for a sequence of different
videos. Step (c) has the objective of briefing the participant about the experience; step
(d) is a 30 second period with no emotional stimulus so that the participant could
relax and return to the baseline emotional state after each video; step (f) is a question-
naire used to retrieve the participants opinion about the emotions felt during the vid-
eo.
The experimental setup and system architecture used is presented in Figure 1: we
have a participant interacting with the Web application, with a set of seven biosensors
attached to his/her hand, chest and face: Electrocardiography (ECG), Blood Volume
Pulse (BVP), Electrodermal Activity (EDA), Respiration (RESP), Electromyography
(EMG), and Peripheral Temperature (SKT) . The biosignals data is acquired using a
bioPLUX research, wireless biosignal acquisition unit and corresponding set of sen-
sors [6]; this information is then saved in a database along with information gathered
by the Web application.
Synchrony between the biosignal and the Web application data is achieved through
the use of a Light Dependent Resistor (LDR). This sensor outputs different values for
different light values and so we placed it at the lower left corner of the screen where
the color changes from light brown to black when a video is being played (an emotion
is being elicited). We have also developed a Python toolbox to process the biosignals
and apply feature extraction and classification techniques, [2].
4 Experimental Results
4.1 Emotion Elicitation
Table 2 summarizes the information retrieved by the video questionnaires, described
earlier, for all the participants. As in [17], intensity refers to “whether a film receives
a high mean report on the target emotion relative to other candidate films”; discrete-
ness is the ratio between the number of participants that felt the target emotion (one
point or more than all other emotions) and the total number of participants. We have
also asked the users to rate the valence of their emotions in a 0-9 scale (0 stands for
very negative emotion and 9 for very positive emotion).
Different conclusions can be drawn from the obtained data. First, we wanted to
elicit 8 different emotional states (target emotions) and the participants reported 22
different emotions (see column 2 of Table 2 and Notes 1-4 of Table 4). As we can
see, different people have different reactions for the same video as the reported emo-
tions vary within the same film. Also, the target emotion is not achieved for all cases
and all individuals. Overall, the Sadness, Disgust, and Amusement videos had the
best results as the mean valence reported fell within the expected range (below 5 for
the first three cases and above 5 in the last one) and had also higher intensity and
discreteness levels. Fear is difficult to elicit, as people tend to reveal anxiety or inter-
est about the situation being presented.
62

Table 2. Summary of video information and feedback given by the participants.
Target
Emotion
Reported emotions
(Most Common)
Reported va-
lence
Intensity Discreteness
Neutral 1
(60 sec)
Confusion/Boredom 2-4-9 0 0
Neutral 2
(80 sec)
Nothing/Pity/Love/Interest 2-4-9 0.28 0.33
Sadness 1
(90 sec)
Sadness/Uncomfortable 0-3-7 0.54 0.69
Sadness 2
(173 sec)
Sadness 0-2-6 0.77 0.89
Anger 1
(90 sec)
Anger/Disgust 1-3-6 0.39 0.62
Anger 2
(254 sec)
Anger/Anxiety 0-2-5 0.43 0.56
Surprise 1
(16sec)
Anxiety/Interest/Fear 1-4-8 0.09 0.15
Surprise 2
(47sec)
Confusion/Fear/Anxiety 1-3-9 0.11 0.22
Disgust 1
(60sec)
Disgust 0-2-6 0.83 0.92
Disgust 2
(65sec)
Disgust/Interest 0-2-5 0.27 0.33
Fear 1
(82sec)
Anxiety/Interest 2-4-6 0.10 0.15
Fear 2
(207sec)
Anxiety 0-3-7 0 0
Amusement 1
(155sec)
Amusement/Surprise 3-5-9 0.50 0.69
Amusement 2
(247sec)
Amusement 0-6-9 0.65 0.78
Happiness
(87sec)
Happiness/Amusement 4-6-9 0.56 0.89
4.2 Classification
After the electrophysiological data acquisition, we used our Python toolbox to
process the biosignals, extract a set of relevant features, and for classification. Table 3
presents the extracted features for each biosignal. For a list of commonly extracted
features in the emotion recognition field refer to [15].
The classification process employed a k-NN (k=5) classifier [20], [21], and to as-
sess how the results would generalize to an independent data set we used the LOOCV
technique. The k-NN classifier evaluates the k points closest (k-Nearest Neighbors) to
a given input data point, x
i
, and outputs a class label, c
i
. Each neighbor belongs to a
class and c
i
is determined as the most predominant class among them. The k-Nearest
Neighbors were found using the Euclidean distance. The LOOCV technique divides
data into a test set composed of one sample point and a training set composed of the
remaining sample points.
The authors in [2], achieved a classification accuracy ranging from 30% to 97.5%
for different scenarios – last line of Table 1. The labels used for classification were
the target emotions. However, as we have seen before, the targeted emotions do not
63

match the emotions reported by the participants in all cases. With that in mind, we
applied the same techniques used before but having the classification labels equal the
reported emotions. Table 4 shows the results obtained for both cases. As we can ob-
serve, the recognition rates are better for the target emotions: it may have to do with
the division between positive and negative emotions that sets Amusement, Happiness,
Joy, Love, Interest, and Peaceful in the positive emotions group and Anger, Disgust,
Anxiety, Fear, Confusion, Embarrassment, Bored, Contempt, Shame, Powerless, Pity,
Sadness, Touched, Scared, Surprise, and Unhappiness in the negative emotions
group; for a future work, other criterions should be used such as the emotion valence
reported by the participants.
Table 3. List of extracted features for each biosignal. µ: mean; ϭ: standard deviation; ϭ
2
: va-
riance; AD: absolute deviation; RMS: Root Mean Square; SCL: Skin Conductivity Level;
SCRs: Skin Conductivity Responses; IBI: Inter Beat Interval; RMSSD: Root Mean Sum of
Squared Differences.
Biosignal Features
EMG
µ,ϭ, ϭ
2
, AD, RMS
Skewness
Kurtosis
EDA
µ of SCL
ϭ, ϭ
2
, AD
Skewness
Kurtosis
Number of SCRs
µ and ϭ of the SCRs amplitudes
µ and ϭ of the SCRs rise times
µ and ϭ of the SCRs ½ recovery times
SKT
µ, ϭ, ϭ
2
, AD
Skewness
Kurtosis
ECG
Heart Rate
ϭ of IBI
RMSSD of IBI
Power Spectrum of IBI
RESP
µ, ϭ, ϭ
2
, AD
Zero crossings
Skewness
Kurtosis
BVP
Envelope
Heart Rate
ϭ of IBI
RMSSD of IBI
Power Spectrum of IBI
64
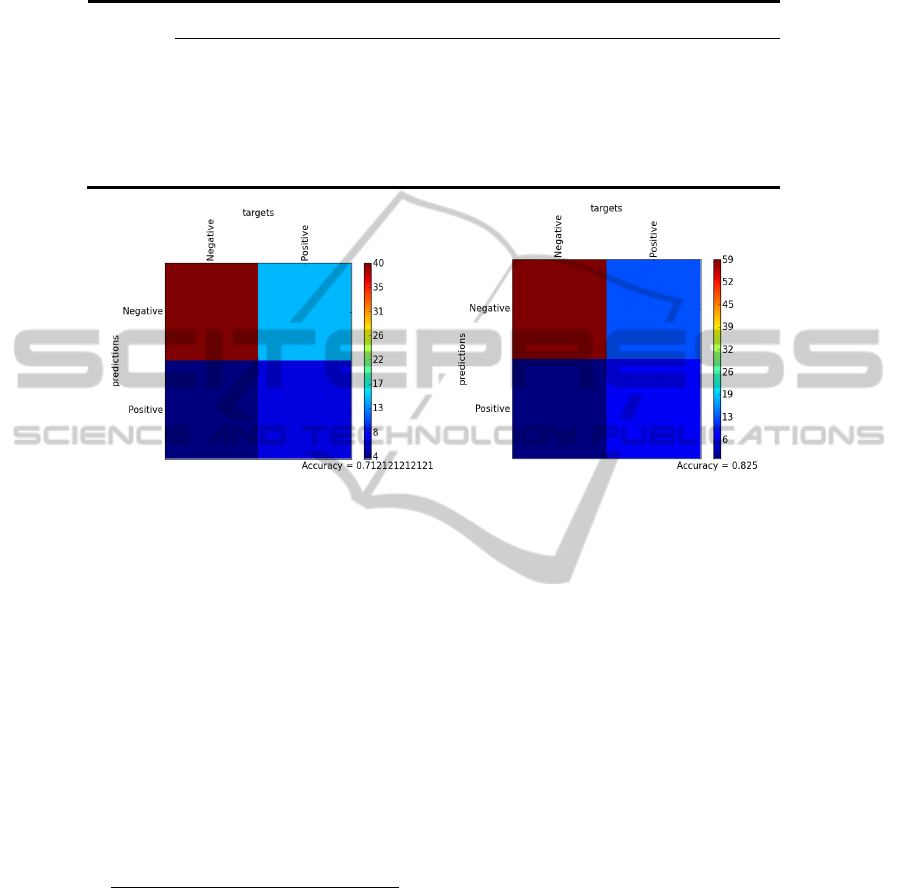
Table 4. Classification results.
Labels
Reported Emotions
1
Target Emotions
2
Positive
(Amusement)
vs.
Negative
(Anger, Disgust,
Sadness)
All Positive
3
vs.
All Negative
4
Positive
(Amusement)
vs.
Negative
(Anger, Disgust, Sadness)
Positive
(Amusement, Happiness)
vs.
Negative
(Anger, Disgust, Fear, Sadness,
Surprise)
Accuracy
71.2% 70.7% 82.5% 81.9%
Fig. 2. Classification results for Positive vs. Negative emotions: reported emotions (left) and
target emotions (right).
5 Discussion and Future Work
In this paper we approached the applicability of multi-modal electrophysiological
data acquisition and processing to emotion recognition. We further explored and
evaluated the emotion elicitation protocol proposed in [2]: it consists of a Web appli-
cation for video viewing and the evaluation is based on the feedback given by the
participants for each video used. On the one hand, videos for emotions such as the
Sadness, Disgust, and Amusement scored the best results; on the other hand eliciting
Fear turned out to be more difficult.
We wanted to elicit 8 emotions and the participants reported 22: different people
have different reactions to the same emotional stimuli. New emotion classification
results are presented based also on the information reported by the participants. Rec-
1
The set of emotions that the individuals felt (Amusement, Happiness, Joy, Love, Interest, Peaceful, Anger,
Disgust, Anxiety, Fear, Confusion, Embarrassment, Bored, Contempt, Shame, Powerless, Pity, Sadness,
Touched, Scared, Surprise, Unhappiness)
2
The set of emotions that we wanted to elicit (Neutral, Amusement/Happiness, Anger, Disgust, Sadness,
Fear, Surprise)
3
The set of positive emotions (Amusement, Happiness, Joy, Love, Interest, Peaceful)
4
The set of negative emotions (Anger, Disgust, Anxiety, Fear, Confusion, Embarrassment, Bored, Con-
tempt, Shame, Powerless, Pity, Sadness, Touched, Scared, Surprise, Unhappiness)
65

ognition rates above 70% are achieved when classifying positive and negative emo-
tions using LOOCV estimates with a k-NN Classifier. For future work, classification
based on criterions such as the emotion valence and arousal will be used; other emo-
tion elicitation techniques such as pictures, sounds, games can also be inserted and
tested in the developed Web application; acquiring new electrophysiological data and
extend our current database is also a future goal.
Acknowledgements
This work was partially supported by the National Strategic Reference Framework
(NSRF-QREN) programme under contract no. 3475 (Affective Mouse), and partially
developed under the grant SFRH/BD/65248/2009 from Fundação para a Ciência e
Tecnologia (FCT), whose support the authors gratefully acknowledge.
References
1. Filipe Canento. Affective mouse. Master’s thesis, IST-UTL, 2011.
2. Filipe Canento, Ana Fred, Hugo Silva, Hugo Gamboa, and André Lourenço. Multimodal
biosignal sensor data handling for emotion recognition. In Proceedings of the IEEE Sensors
Conference, 2011.
3. Hugo Gamboa. Multi-Modal Behavioural Biometrics Based on HCI and Electrophysiology.
PhD thesis, IST-UTL, 2006.
4. André Lourenço, Hugo Silva, and Ana Fred. Unveiling the biometric potential of Finger-
Based ECG signals. Computational Intelligence and Neuroscience, 2011.
5. A. Fred, H. Gamboa, and H. Silva, “Himotion project,” tech. rep., Universidade Técnica de
Lisboa, Instituto Superior Técnico, 2007.
6. PLUX, “PLUX Website”, www.plux.info, March 2011.
7. R. Picard, Affective Computing. MIT press, 1997.
8. J. Larsen, G. Berntson, K. Poehlmann, T. Ito, and J. Cacioppo, “The psychophysiology of
emotion,” in The handbook of emotions, pp. 180–195, Guilford, 2008.
9. M. Whang and J. Lim, “A physiological approach to affective computing,” in Affective
computing: Focus on Emotion Expression, Synthesis and Recognition (J. Or, ed.), pp. 309–
318, In-Tech Education and Publishing, 2008.
10. L Shen, M.Wang, and R. Shen, “Affective e-learning: Using “emotional” data to improve
learning in pervasive learning environment,” Educational Technology & Society, 2009.
11. Haag, S. Goronzy, P. Schaich, and J. Williams, “Emotion recognition using bio-sensors:
First steps towards an automatic system,” in Affective Dialogue Systems: Lecture Notes in
Computer Science, pp. 36–48, Ed. Springer Berlin, 2004.
12. E. Leon, G. Clarke, V. Callaghan, and F. Sepulveda, “A user-independent real-time emo-
tion recognition system for software agents in domestic environments,” Engineering Appli-
cations of Artificial Intelligence, 2006.
13. K. Kim, S. Bang, and S. Kim, “Emotion recognition system using short-term monitoring of
physiological signals,” Medical & Biological Engineering & Computing, 2004.
14. F. Hönig, A. Batliner, and E. Nöth, “Real-time recognition of the affective user state with
physiological signals,” in Proceedings of the Doctoral Consortium of the 2nd International
Conference on Affective Computing and Intelligent Interaction, pp. 1–8, 2006.
66

15. E. van den Broek, V. Lisý, J. Janssen, J. Westerink, M. Schut, and K. Tuinenbreijer, “Af-
fective man-machine interface: Unveiling human emotions through biosignals,” in Biomed-
ical Engineering Systems and Technologies: BIOSTEC2009 Selected Revised papers (A.
Fred, J. Filipe, and H. Gamboa, eds.), pp. 21–47, Springer-Verlag, 2010.
16. R. Picard, E. Vyzas, and J. Healey, “Toward machine emotional intelligence: Analysis of
affective physiological state,” IEEE Transactions Pattern Analysis and Machine Intelli-
gence, 2001.
17. J. Rottenberg, R. Ray, and J. Gross, “Emotion elicitation using films,” in The handbook of
emotion elicitation and assessment (J. Coan and J. Allen, eds.), pp. 9–28, Oxford Universi-
ty Press Series in Affective Science, 2007.
18. R. Picard, Affective Computing Research Group at MIT, “Affective computing projects.”
http://affect.media.mit.edu/projects.php, March 2011.
19. J. Hewig, D. Hagemann, J. Seifert, M. Gollwitzer, E. Naumann, and D. Bartussek, “Brief
report: A revised film set for the induction of basic emotions,” Cognition & Emotion, 2005.
20. R. Duda, P. Hart, and D. Stork, Pattern Classification. Wiley, 2001.
21. C. Bishop, Pattern Recognition and Machine Learning. Springer, 2006
Appendix
Web application interface for emotion elicitation.
(a) Start page
Fig. 3. Web application for emotion elicitation using videos.
67

(b) Participant information page
(c) Protocol briefing page
Fig. 3. Web application for emotion elicitation using videos.(cont.)
68

(d) Blank page
(e) Video page
Fig. 3. Web application for emotion elicitation using videos. (cont.)
69

(f) Questionnaire page
Fig. 3. Web application for emotion elicitation using videos. (cont.)
70
