
COMPUTATIONAL MODEL FOR PROBABILITY PREDICTION OF
SCAN PATHS IN STATIC SCENES
Yorie Nakahira
1
and Nakayama Minoru
2
1
Control and Systems Engineering, Tokyo Institute of Technology, Tokyo, Japan
2
Department of Human System Science, Tokyo Institute of Technology, Tokyo, Japan
Keywords:
Eye Movements, Scan Path, Fixation, Static Scenes, Probability Prediction.
Abstract:
We develop a computational model of scan paths when viewing static images. The proposed scan path model
generates a dynamic distribution of visual attention using multiple image processing algorithms based on
biological principles. The probability of any scan paths is computed from this distribution of visual attention
at each subsequent numbered fixation. The validity of our model is tested using eye movement data. Our
results verify the possibility of conventionally infeasible modeling of the scan paths for static images.
1 INTRODUCTION
Despite the promise of scan path prediction (Robert
et al., 2003), a two-fold scan path prediction prob-
lem exists for static images. First, scan paths are
rarely coherent from person to person (Bohme et al.,
2004). The possible accuracy of any conventional
model which outputs a single probable scan path can-
not exceed the low coincidence level of scan paths
from different viewers (Privitera and Stark, 2000). In
addition, for the purpose of usability evaluation, it
is unreasonable to ignore many other possible scan
paths merely because they are not the most probable
ones. Second, processing an image using an algo-
rithm can only yield static parameters for visual con-
spicuousness, whereas temporal eye movements are
dynamic and so are their distribution. Therefore es-
timating dynamic change using static parameters is
self-limiting.
This paper suggests a novel way for scan path pre-
diction that is based on two premises; (1) a scan path
prediction model should yield the possibility (distri-
bution) of visual attention and scan paths instead of
the most probablescan path; (2) that the model should
incorporate several algorithms for eye movement pre-
diction to optimize its value over the temporal se-
quence of fixations (subsequent numbered fixations).
By assuming the computability of the statistical
distribution of scan paths, we compute the distribu-
tion of visual attention along the temporal sequence
of fixations. In this way, variations in personal visual
behavior can be suitably expressed through statisti-
cal expression, instead of as aberrations. The com-
putation of the distribution of visual attention is quite
useful, as it makes a previously impossible prediction
possible for scan paths when static images are viewed.
A model of scan path prediction is proposed in Sec-
tion 2. Section 3 describes the experimental protocol
to acquire eye movement data. Section 4 presents the
experimental results. Section 5 summarize the study
presented here.
2 PROPOSED MODEL
2.1 Attention Distribution Prediction
The displayed image was first labeled according to
each region of interest. Take figure 1 for example.
The pie-graph represents a data set with three compo-
nents, each labeled from 1 to 3. Conditions excluding
the above-mentioned state 1 to 3 are brief enough so
that they can be categorized as intervals during which
the state of visual attention changes.
Attention Distribution Ratio (ADR) is defined as
the ratio of attention to each position on the image.
Each pixel value of an image is labeled from 1 to z.
The number of labels, z, is determined by the number
of objects in the image, or the number of positions
which represent different meanings. If the ratio of
subjects that fixate at labels 1, 2 and 3 are 1 : 2 : 1 (ex-
perimental ADR), the ideal computational algorithms
for computed ADR are expected to generate a value
427
Nakahira Y. and Nakayama M..
COMPUTATIONAL MODEL FOR PROBABILITY PREDICTION OF SCAN PATHS IN STATIC SCENES.
DOI: 10.5220/0003847504270430
In Proceedings of the International Conference on Computer Vision Theory and Applications (VISAPP-2012), pages 427-430
ISBN: 978-989-8565-03-7
Copyright
c
2012 SCITEPRESS (Science and Technology Publications, Lda.)
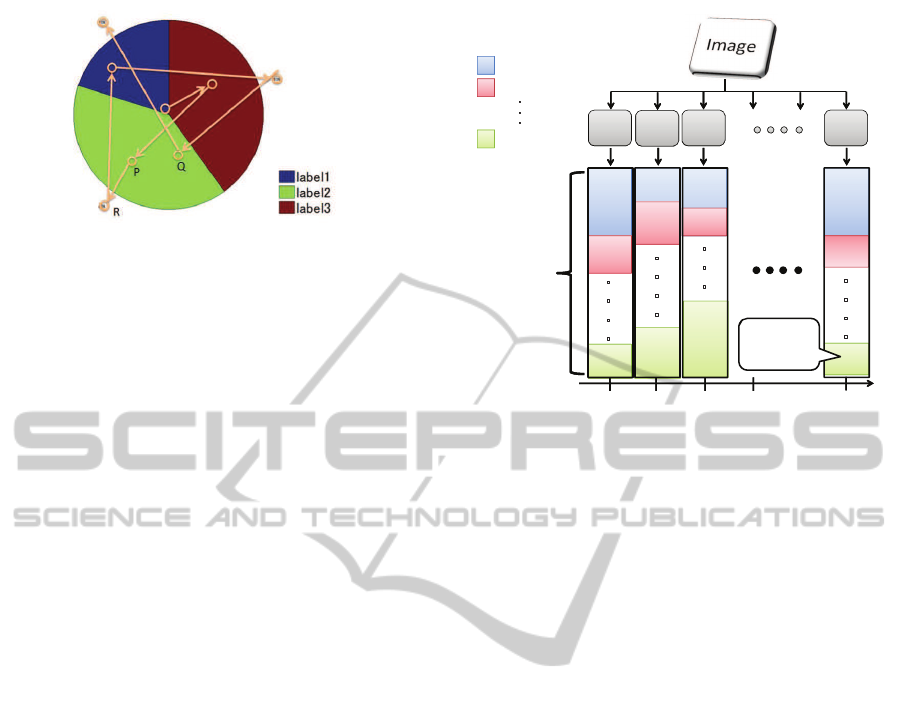
Figure 1: Example of a scan path and its labeling. Each
pixel value of the image is labeled from 1 to 3. The cases
when a subject fixates at the positions labeled 1, 2, 3 are
defined as state 1, state 2, and state 3 respectively. The scan
path noted in this figure, for example, is ”1 → 3 → 2 → 2 →
1 → 3 → 2 → 1”.
close to ”state1 : state2 : state3 = 1 : 2 : 1”.
This algorithmically computed ADR is calculated
using the following three procedures.
I. Converting a image (static visual environment)
into maps using image processing algorithms
(IPAs) whose pixel values denote the visual con-
spicuousness, in other words the likelihood to be
viewed. Suggested IPAs are defined in Section
3.3.
II. Each pixel value of the map is labeled from 1 to
z according to the meaning it represents. z is the
number of objects in the image. This labeling sim-
plifies the large image size into a small number
of sections and makes the computational proce-
dure less demanding. For the experiments in this
study, an example of labeling is explained in Sec-
tion 5.1.1.
III. The visual conspicuousness represented by the
pixel value is summed up separately for each la-
beled region. The ratio of the summation values
of differently labeled regions is expected to de-
note the relative amounts of visual attention each
region is likely to receive. This quantitatively
expressed likelihood to be viewed is defined as
cADR (computed Attention Distribution Ratio).
An important thing to note is that conventional
models usually only have procedure I, and produce
an output of only a single scan path. However, proce-
dures II and III are significant because these are steps
that afford the model to take the personal difference
of the scan paths into consideration.
2.2 Computing Scan Path Probability
Since the distribution of visual attention changes over
time, it is unreasonable to expect a single IPA to yield
accurate prediction results over temporal number of
IPA
1
k (Subsequent number of fixations)
1
2 3
4
label 1
label 2
䞉
䞉
䞉
label z
cADR
IPA
2
IPA
3
IPA
N
䞉
䞉
䞉
䞉
䞉
䞉
䞉
䞉
䞉
䞉
䞉
䞉
䞉
䞉
䞉
n
Probability
P(n,z)
Figure 2: Computation of cADR to predict scan paths when
viewing a static image. First, the image is processed using
IPAs to yeild cADR for each subsequent numbered fixation
that indicate the possibility of being state s (s = 1, · · ·, z).
The resultant cADR indicates the statistical distribution of
state s at kth fixation (k = 1, · · ·, n) (section 3.1). P(n, z) is
defined to be the probability of state z at the nth fixation.
The probability of the scan path ”s
1
, · · ·, s
n
” can then be cal-
culated as P(1, s
1
) · · · P(n, s
n
) (section 3.2).
fixations. Consequently, our model optimizes itself
over time; in other words, over the subsequent num-
bered fixations. This optimization is achieved by us-
ing IPAs in a manner where each IPA is used only
when it is at highest accuracy.
The overview of our model for computing cADR
from a set of IPAs throughout the subsequent num-
bered fixations is defined in figure 2. P(k, s) is defined
to be the computed probability of eye movement at
state s (subjects fixating at the position labeled s ) at
kth fixation. The P(k, s) is computed for kth fixation
(k = 1, · · ··, n) from the IPA that are most suitable for
the kth fixation. The biological principles represented
by IPAs include the intuitive tendencies of eye move-
ment such as fixating at the centers of images, fixat-
ing at the salient positions, and the task-oriented cog-
nitive model. The choice IPAs for each subsequent
numbered fixation is constructed on a case by case
basis depending on the context under which viewers
are put. The possibility of the scan path ”state : s
1
→
s
2
→ s
3
→c→ s
n
” is computed as
P(1, s
1
) · P(2, s
2
) · P(3, s
3
) · · · ·P(n, s
n
) (1)
We used the following algorithms (IPAs) in the
new model; C: center-surround map, and D: Atten-
tion Distribution Map, and S: Saliency map (Iiit et al.,
1998). All three IPAs are based on the bottom-up im-
VISAPP 2012 - International Conference on Computer Vision Theory and Applications
428

age based intuitive cognitive process or task-oriented
attention element.
C: A Center-Surround map was generated by drop-
ping an Gaussian kernel at the center of an im-
age. The half-height width for the Gaussian is
determined according to the area over which fix-
ation can be said to exist. The biological back-
ground for the algorithms is based on the central
fixation bias noted by previous studies (Buswell,
1935; Tatler, 2007).
D: An Attention Distribution Map combines the
saliency map from Itti’s model and a task rele-
vance map. For Itti’s model, the three conspicu-
ity maps are normalized and summed together at
an equal ratio, to become a saliency map (S).For
the task relevance map, under the context of the
images being graphs, the quantitative data it rep-
resents is used as task-relevance. For each section
labeled differently, the comparativeamount repre-
senting each different region is used in a manner
so that the larger the data, the higher the conspic-
uous value, the larger the cADR assigned to the
region.
3 EXPERIMENTAL METHOD
During the experiment, eye movements were mea-
sured using an eye tracker (nac: EMR-NL, 640x460
pixel resolution, 60Hz). Images of graphs were dis-
played on a computer screen for three seconds each,
followed by a one-second interval during which sub-
jects fixate on a central cross. The coordinated po-
sitions on the images where subjects were looking
was recorded for later analysis. The subjects were
seated in front of a screen with their head secured to a
chin-rest structure. The viewing distance was approx-
imately 65 cm; the stimulus size was about 20 cm x
25 cm. In this paper, fixation is defined as a stable eye
position with a velocity below the threshold of 20 de-
grees per second (Robert et al., 2003), and a scan path
as the spatial arrangement of a sequence of fixations.
45 different images of graphs were utilized. There
were five types of graphs with different design: two
types of bar graphs and three types of pie charts. For
each type of graph’s design, there were 9 graphs rep-
resenting 9 different sets of data. These 9 sets each
have three components. Six subjects (3 male, 3 fe-
male) were used. Each subject repeated this experi-
ments for 3 times.
4 RESULTS
4.1 Selection of IPAs for Each
Subsequent Numbered Fixation
The best IPAs for each subsequent numbered fixa-
tion in the experimental situation are determined from
the strength of the correlational relationship between
eADR (experimental Attention Distribution Ratio)
and cADR (computed Attention Distribution Ratio)
from the 1st fixation to the 7th fixation. The cADR in
the regions labeled from 1 to 3 by the method in sec-
tion 5.1.1 are calculated for all images (45 images x
3 IPAs). The experimental Attention Distribution Ra-
tio (eADR) of each subsequent numbered fixation on
each image in the three second experiment was calcu-
lated. Then, the correlation coefficients between the
computational data (cADR) and the experimental data
(eADR) are computed from the 1st fixation to the 7th
fixation.
Figure 3 plots the dynamic changes in correla-
tional value (prediction accuracy) of IPAs from 1st
fixation to the 7th fixation. The figure 3 confirms the
expectation that each IPA has its own peak at a differ-
ent subsequent numbered fixations. This data implies
that the distribution of the scan path can be modeled
by C from the 1st to the 2nd fixation, and by D from
the 3rd to the 5th. In this way, the dynamic changes
in the eADR over fixation number are suitably incor-
porated in the model by the shift of the static cADR
computed by each IPA. The effectiveness of this is
apparent when correlation values are compared with
existing prediction model (S), which defines an abso-
lute single path by a single cADR.
The cADR computed from the above-mentioned
model changes its value over the sequence of fixations
by shifting the IPA. Thus, the model for ADR predic-
tion can be defined as follows: IPA C calculate P(k, s)
for k = 1, 2; IPA D calculate P(k, s) for k = 3, 4. The
calculation of the scan path probability is by equation
1.
4.2 Accuracy of the Model
Table 1 compares the probability of the computation-
ally predicted scan paths (see equation 1) and the ex-
perimental probability when subjects are viewing a
particular image. There are 81 (3
4
) possible states
in total for the subsequent numbered fixations from 1
to 4, The table shows 4 types of scan paths with the
highest computational probabilities. This result is en-
couraging because it suggests the validity of our pro-
posed method of predicting possibility of scan paths.
The predicted probability of each scan path and
COMPUTATIONAL MODEL FOR PROBABILITY PREDICTION OF SCAN PATHS IN STATIC SCENES
429
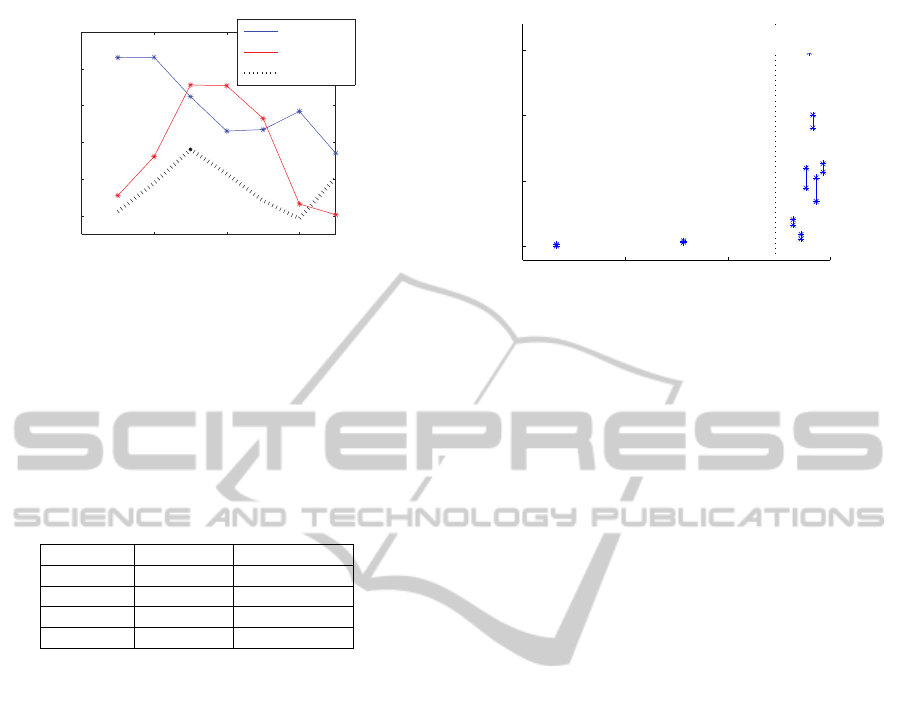
Figure 3: Changes in accuracy over the subsequent num-
bered fixations. This figure plots the correlational coeffi-
cient between eADR and the cADR computed from IPA C,
D, or S on the y-axis, and the subsequent numbered fixa-
tions on the x axis. This figure implies that cADR can be
optimized by predicting 1st to the 2nd fixations by C, 3rd to
the 5th fixations by D.
Table 1: Computationally predicted scan paths and their
experimental counterparts. This table compares the algo-
rithmically computed scan paths probability with its exper-
imental value.
Scan path Computed Experimental
2-3-1-1 0.335 0.389
2-2-3-2 0.166 0.056
2-2-2-3 0.166 0.167
2-2-2-2 0.082 0.111
the experimental probability of the scan path is com-
pared using the correlational coefficient. Although
45 images, the correlational values is above 0.6 in 25
types of images, and above 0.4 in35 types of images.
We also used the correlational coefficients be-
tween cADR and eADR as the index for the accuracy
of the computational prediction. The high correlation
between cADR and eADR means that the computa-
tionally predicted scan path probability could yield an
accurate output.
Figure 4 plots the correlational value between
cADR and eADR on the x axis and the variance of
cADR on y axis. It is suggested from figure 4 that
images with a high variance of cADR are generally
predicted accurately, while images with low variance
of cADR may not be reliably predicted. The biolog-
ical meaning of the variation in cADR is that visual
attention is likely to focus on a couple of labeled re-
gions, rather than all of the existing regions. There-
fore, variances in cADR values can be the index for
model accuracy.
5 SUMMARY
In summary, this paper proposed a novel method of
-0.5 0 0.5 1
0
5
10
15
Accuracy (correlation level)
Range of variance
0.73
Average
Figure 4: Accuracy of cADR vs the range of variance of
cADR. This figure illustrates the relationship between the
variance of cADR on the y axis and the correlation values
between cADR and eADR on the x axis for data sets from
1 to 9. For each set of data, the maximum and minimum
variance is denoted by ’*’, and the range of variance is de-
noted by vertical lines. The accuracy (correlation level) for
all images as a whole is 0.73.
scan path prediction. The computability of the dis-
tribution of ’idiosyncratic’ scan path is confirmed.
The feasibility of the computationalprediction of scan
paths is validated by eye movement experiment. It is
suggested that the accuracy of the model can also be
estimated by quantitative parameters explained in this
study. The future direction would be to apply the scan
path calculation to a longer sequence of fixations by
finding the IPAs that is applicable to each temporal
sequence of fixations.
REFERENCES
Bohme, M., Dorr, M., Krause, C., Martinetz, T., and Barth,
E. (2004). Eye movement prediction of natural videos.
Neurocomputing, Vol 69, 16-18, 1996-2004.
Buswell, G. (1935). How people look at pictures: A study
of the psychology of perception in art. University of
Chicago Press, Chicago.
Iiit, L., Koch, C., and Niebur, E. (1998). A model of
saliency-based visual attention for rapid scene anal-
ysis. IEEE Transactions on Pattern Analysis and Ma-
chine Intelligence 20, 11, 1254-1259.
Privitera, C. and Stark, L. (2000). Algorithms for defin-
ing visual regions-of-interest: Comparison with eye
fixations. IEEE Transactions of Pattern Analysis and
Machine Intelligence, Vol 22(9), 970-982.
Robert, J., Jacob, K., and Karn, K. (2003). Eye tracking
in human-computer interaction and usability research:
ready to deliver promises. In The Mind’s Eye. Elsevier
Science BV.
Tatler, B. (2007). The central fixation bias in scene viewing:
selecting an optimal viewing position independently
of motor biases and image feature distributions. Jour-
nal of vision 7(14):4, 1-7.
VISAPP 2012 - International Conference on Computer Vision Theory and Applications
430
