
FOOD TEXTURE ESTIMATION FROM CHEWING SOUND
ANALYSIS
Hao Zhang
1
, Guillaume Lopez
1
, Ran Tao
2
, Masaki Shuzo
1
, Jean-Jacques Delaunay
1
and Ichiro Yamada
1
1
School of Engineering, The University of Tokyo, 7-3-1 Hongo, Bunkyo-ku, Tokyo, Japan
2
Department of Mechanical Engineering, Universit´e de Lyon, INSA-Lyon, Lyon, France
Keywords:
Eating habits monitoring, Sound analysis, Bone-conduction sensors, Wavelet features, Self-Organizing Maps
(SOM), Hidden Markov Model (HMM).
Abstract:
In recent years, an increasing number of people have been suffering from over-weight, indicating the impor-
tance of a balanced dietetic lifestyle. Researches in nutrition and oral health have raised the importance of not
only calorific consumption, but also eating habits quality such as the regularity of meals, eating speed, and
food texture. A new model for the estimation of food texture by analyzing chewing sound collected from a
wearable sensor is presented in this paper. The proposed model combining effective sound features extraction
and classification methods make it possible to estimate quantitatively detailed texture of food a person is eat-
ing. The model has been implemented and shown being efficient (more than 90% accuracy) to estimate three
food texture indices at eight detailed levels for each, with little influence of individual chewing differences.
1 INTRODUCTION
Recently, over-weight, which is related to people’s
lifestyle, is increasing dramatically among all ages
groups, and it has been proved to be related to many
other diseases such as hypertension (Hoffmans et al.,
1989), heart diseases, and diabetes (Abraham et al.,
1971). A balanced and appropriate diet leads to a low
risk of overweight and obesity. Healthcare specialists
identify the regularity of meal times, number of mas-
tication cycles, and types of foods eaten as essential
factors in evaluating eating habits. Eating habits are
usually examined by meal stability, intake of sweets
and soft drinks, intake of fruit and vegetables.
The importance of food texture people eat in daily
life was pointed out directly. Food texture does not
only affect the appetite of the eater, but is also related
to eater’s health condition such as dental health. As
the teeth function differs from the age to age, and also
differs from the people to people, the eating habits re-
lated to food texture are important factors of certain
health condition such as dental diseases, which also
increase the risk of obesity (Hung et al., 2003; Ko-
hyama et al., 2003). Moreover, the texture of food
eaten is not only correlated to dental diseases, but di-
rectly contributes to obesity. Oka et al. have reported
that food texture affects energy metabolism, and so
influence over-weight, since food that is harder for
the stomach to break down (hard, crunchy, or crispy
food), will cause a slight elevation of body temper-
ature as the stomach churns and burns calories (Oka
et al., 2003). Many researches focus on daily moni-
toring of eating habits using wearable sensors, such
as mastication counting and eating sound mapping
(Nishimura and Kuroda, 2008), meal-related activi-
ties classification (Amft et al., 2005), and so forth.
However, the groups of food with other texture prop-
erties could not be clearly classified.
In this paper, we report the development of a new
model for quantitative estimation of food texture from
chewing sound. This paper is organized as follows.
In section 2, data analysis methods for model con-
struction are introduced. The model construction is
demonstrated in section 3, and the model validation is
shown in section 4. Finally, the conclusions are pre-
sented in section 5.
2 DATA ANALYSIS METHODS
In this section, the methodology applied to build-up
the model is illustrated, and the data analysis methods
proposed for model implementation are introduced in
213
Zhang H., Lopez G., Tao R., Shuzo M., Delaunay J. and Yamada I..
FOOD TEXTURE ESTIMATION FROM CHEWING SOUND ANALYSIS.
DOI: 10.5220/0003771802130218
In Proceedings of the International Conference on Health Informatics (HEALTHINF-2012), pages 213-218
ISBN: 978-989-8425-88-1
Copyright
c
2012 SCITEPRESS (Science and Technology Publications, Lda.)

detail.
2.1 Data Analysis Methodology
The data analysis methodology applied to build-up
a model for monitoring food texture people eat us-
ing chewing sound is proceeded in the following two
steps:
• Define food texture indices that can be estimated
from sound features
• Build a model to quantitatively estimate defined
food texture indices
2.2 Methods
In this sub-section, we present in detail the methods
that are composing the chewing sound data analysis
model we propose including food texture definition,
and food texture estimation model.
2.2.1 Eating Sound Chews’ Segmentation
The eating sound is firstly segmented to single chews
for the following process. The methods for chews
segmentation is demonstrated as follows.
The sound signal is cut into 20ms frames for ex-
tracting chew pattern, then the chew patterns are ex-
tracted using the amplitude differences accumulation
function, which can be expressed as written in for-
mula 1.
ADA
n
=
n×N
∑
m=(n−1)×N+1
|x(m) − x(m− 1)|, (1)
where x represents the sound signal, n the frame num-
ber, and N is the number of sampling points in each
20ms frame.
Then, the signal is smoothed using a butterworth
low pass filter with the fixed parameters of 4th order
and 2.5Hz cut off frequency, considering the reason-
able maximum chewing cycles per second is limited
by the physical mechanics of the mandible. Finally,
the detecting the local minima allows to separate con-
secutive chews.
2.2.2 Chew Features Extraction using Wavelets
Wavelets are a mathematical tool that can be used to
extract information from many kinds of data, such as
those from audio and images. In this study we used a
discrete wavelet transform (DWT) (Morlet, 1984).
Two groups of coefficients can be obtained using
wavelet decompostion, such as approximate coeffi-
cients and detail coefficients. Several statistical quan-
tities of detail coefficients were adopted as features in
this research. Features were extracted for each sound
sample from ten levels of wavelet decomposition, us-
ing Daubechies basis 5 (db5). Seven statistic prop-
erties of detailed coefficients issued from wavelet de-
composition were used to finally extract features for
each sound samples. The seven statistical properties
are summarized in Table 1.
Table 1: Statistical parameters for extracting features from
Wavelet transform detailed parameters.
Serials Statistic features
1 Mean value of coefficients
2 Standard deviation of coefficients
3 Ratio of mean values of adjacent sub-band
4 Power of wavelet coefficients
5 Max. value of coefficients
6 Min. value of coefficients
7 Range of coefficients
2.2.3 Chew Features Clustering using
Self-Organizing Maps (SOM)
Self-organizing maps (SOM) is a type of artificial
neural network that is a kind of clustering method.
The ”feature maps” realized can effectively used for
discovering the patterns under high-dimensional data.
This method can be used to project and visualize high-
dimensional signal spaces on such a two-dimensional
display. More detailed explanation can be found in
the book (Kohonen, 1997).
2.2.4 Features Set Optimization using mRMR
Feature selection would be helpful to reduce the di-
mensions of features as well as improve the accuracy
of classification as there are redundancies in extracted
features (Zhu and Guan, 2004; Unler et al., 2010).
The function called mRMR developed by Hanchuan
et al. was adopted in this research to select features to
enable all wavelet-extracted features to be ranked re-
garding both their relevance and information content
(Peng et al., 2005).
2.2.5 Chew features Pattern Recognition using
Hidden Markov Model (HMM)
An hidden Markov model is well known in the ap-
plication field of temporal pattern recognition such as
speech, gesture, and bio-informatics.
HMM parameters can be trained by given se-
quences using Baum-Walch algorithm, the unknown
sequences can be classified by calculating the likeli-
hood that each trained HMM model gives to it.
HEALTHINF 2012 - International Conference on Health Informatics
214
3 MODEL CONSTRUCTION
In this section, the experiment equipment and data
preparation are firstly described. Then the targeted
food texture estimation using sound is defined by us-
ing SOM, and finally the HMM model for food tex-
ture estimation for eating habits monitoring is con-
structed.
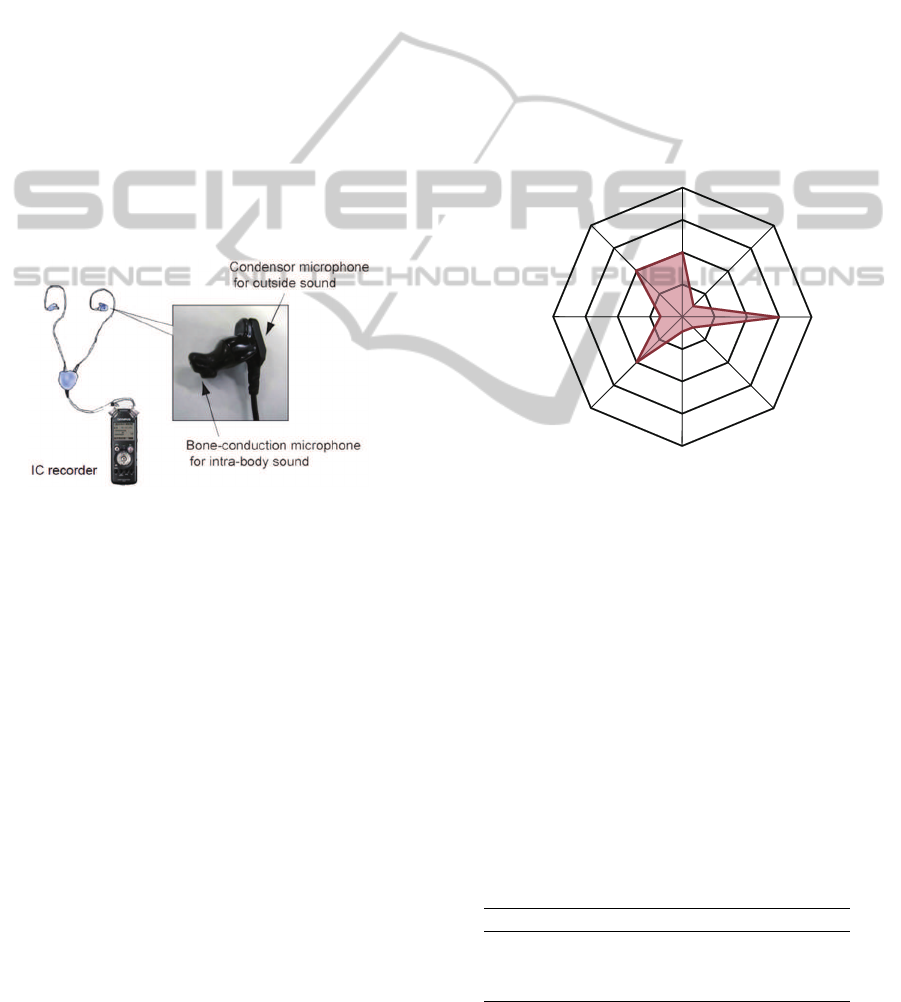
3.1 Wearable Sensing Device for
Chewing Sound Recording
A prototype of a wearable sensing system to analyze
eating habits using a bone-conduction microphone
(Vibraudio EM20 from TEMCO Corp.) shows in Fig-
ure 1 was developed in our previous work to record
internal body sounds signal (Shuzo et al., 2010). The
sound signals used to analyze eating habits using in-
ternal body sounds were recorded with an IC recorder
(LS-10 from Olympus Corp.).
Figure 1: Wearable sensing device developed for eating
habits analysis.
3.2 Data Collection
Experiments were conducted to collect data for model
construction. The following shows the list describing
experimental conditions.
• 15 participants.
• 6 food types: banana, rice ball, salad, rice cracker,
fruit jelly, marshmallow.
• The quantity of food intake for one chewing pro-
cess is not defined, participants can eat according
to their will.
• Variety kinds of food with different textures are
included in the experiments.
• Participants eat five times for each food type in
the experiments.
Through this experiment, we can obtain 450 sound
files for establishing the model for food texture esti-
mation. The first three chews are adopted for con-
structing the model, and the whole database are di-
vided into three parts that each part contains five peo-
ple’s data used for defining the targeted food texture,
training the HMMs model, and model validation.
3.3 Targeted Food Texture
Identification Using SOM
Food texture refers to those qualities of a food that
can be felt with tongue, palate, or teeth (e.g. crunchy
crackers, crispy salad, soft banana, etc.). It is usually
measured by some specific equipments, producing a
map defining various food texture indices as shown
on Figure 2. In this sub-section, we present how we
proceeded to identify the targeted food texture indices
that may be estimated using sound.
Hardness
Viscosity
Chewiness
Crunchiness
Elascity
Adhesiveness
SpringinessGumminess
7
5
3
1
-1
Figure 2: Example of a map conventionally used for food
texture measurement by texturometer. Texture definition for
cabbage (Yoshikawa and Okabe, 1978).
The targeted food texture is identified using a
clustering method called self organizing map (SOM),
which is effective to visualize high-dimensional fea-
tures. We adopted the results from SOM in two as-
pects, one is the U-matrix to obtain the information
of clusters, and the other is the labeled matrix to ex-
tract the knowledge about clusters content. The re-
sults are illustrated in Figure 3, the information on
the U-matrix in this figure is from the the labeled re-
sults shown in the right. From this clustering result,
we defined the targeted food texture indices that can
be analyzed from chewing sound in Table 2.
Table 2: Targeted food texture indices in the estimation
model.
Texture index Described food textures
Hardness Hard (H) ↔ Soft (S)
Elasticity Elastic (E) ↔ Plastic (P)
Crunchiness Crunchy (Cc) ↔ Crispy (Cp)
FOOD TEXTURE ESTIMATION FROM CHEWING SOUND ANALYSIS
215

Figure 3: SOM results with U-matrix in the left and labeled
information in the right. The distance in N-dimensions of
a cell with its neighbors is represented through color grada-
tion from blue for small distance to red for great distance.
3.4 Feature Selection for Model
Construction
The features are extracted using five levels wavelet
decomposition, and the features are obtained from
several statistic parameters shown in Table 1. The fea-
tures are selected using both SOM and mRMR. First
the features are selected based on the results from
SOM that has obvious clusters, and then top two fea-
tures ranked by mRMR are selected according to dif-
ferent food texture indices. The six features set se-
lected based on SOM is {F2.5, F2.6, F2.7, F5.5, F5.6,
F5.7}. The features are demonstrated in the following
format.
F(num1).(num2), (2)
where num1 is the decomposition number and num2
is the serial number of the statistic parameters for ex-
tracting the features in Table 1. The effective features
set selected from mRMR is {F2.5, F5.5}.
3.5 Model Construction using HMMs
The model is constructed for estimating the detailed
food texture, which reference measurements are ex-
tracted from Yoshikawa et al. (Yoshikawa and Okabe,
1978). In each level, the detailed food texture index is
estimated into eight levels from 0 to 7. For example,
there is eight levels from 0 to 7 equivalent to soft to
hard according to hardness index in Table 2. Six kinds
of foods with variaty food textures were selected for
the experiments.
For food texture estimation, we adopt a HMM
with 2 states and 25 outputs illustrated in Figure 4.
Figure 5 illustrates the output symbols of HMM. The
output symbols is fixed by selecting two-dimensional
features, the features are extracted using 10ms data in
one chew and normalized by using logistic normal-
ization method, and then the symbol is selected by
referencing the position shown in Figure 5.
Figure 4: HMM model with 2 states and 25 outputs.
Figure 5: Output symbols of HMM.
The learned HMMs are illustrated in Figure 6.
Each level of different textures are trained by the
training data. Then the unknown sequences, which
are the representation a single chewing sound through
features, can be recognized by using this learned
HMMs.
4 MODEL VALIDATION
In this section, the model was validated based on the
data from the experiment.
4.1 Strategy
According to the situation that the food texture will
change during the eating process, the food texture
is validated using the first three chews. The HMM
HEALTHINF 2012 - International Conference on Health Informatics
216

Table 3: Overall accuracy of targeted food texture estimation.
Food texture index Hardness Elasticity Crunchiness Overall
Estimation accuracy 88% 95% 97% 93%
Table 4: Detailed accuracy of targeted food texture estimation according to individual differences.
Subject No. Accuracy
Hardness Elasticity Crunchiness Overall
1 78% 80% 100% 86%
2 84% 100% 93% 92%
3 94% 100% 100% 98%
4 90% 93% 97% 93%
5 92% 100% 93% 95%
Table 5: Detailed accuracy of targeted food texture indices estimation according to food types differences.
Food type Food texture indices accuracy
Hardness Elasticity Crunchiness Overall
Banana 76% 84% 100% 90%
Rice ball 92% 100% 100% 97%
Salad 88% 100% 84% 91%
Rice cracker 84% 100% 96% 93%
Fruit jelly 92% 100% 100% 97%
Marshmallow 76% 100% 100% 92%
Figure 6: Structure of HMM learning for food texture esti-
mation.
model is trained using 5 persons database, and an-
other 5 persons database is used for validating the
learned model. Since for wearable monitoring, eat-
ing sound signal is adopted for food texture analysis.
But the variation is large using sound since the signal
is affected by the strength and direction of the closing
mandible when people are chewing, the texture esti-
mated is influenced. However, in order to maintain
the meaningfulness of the food texture estimation by
using sound for daily life eating habits monitoring,
the objective is to measure the food texture with the
error less than miss-recognized to the adjacent texture
level in the learned database. Concrete validation pro-
cedures are demonstrated in the following.
• Train HMMs using the features demonstrate the
first three chews in each sound based on 5 persons
database
• Calculate the predicted food texture level by
round the averaged predicted label of the first
three chews of each eating sound
• Calculate the accuracy of food texture estimation
by the rule that predicted food texture level should
be within the error less than miss-recognized to
the adjacent level in the learned database
4.2 Results
The model is validated from the aspect of overall ac-
curacy as well as detailed accuracy for each food type
and individual. The overall results of targeted food
texture are shown in Table 3. Table 4 and 5 illustrates
the detailed accuracy according to individuals and dif-
ferent food types.
4.3 Discussion
From the analysis results, the possibility of using
sound as a media to estimate food texture for wear-
able eating habits monitoring is proved. The method
we develop is robust with little variance for different
food types and individuals according to the detailed
results. The results for hardness estimation is lower
than others two, the reason is mostly because of there
FOOD TEXTURE ESTIMATION FROM CHEWING SOUND ANALYSIS
217

are more detailed food textures under it as shown in
Figure 3, from the knowledge of the labeled plot, the
food texture elasticity is mostly inside the soft part
and food texture crunchiness is mostly inside the hard
part.
5 CONCLUSIONS
Common ways for food texture measurement is to use
equipments that cannot be used for continuous eating
habits monitoring. However, it is very important to
monitoring eating habits by observing the food tex-
ture of foods people eat in daily life.
In this paper, the possibility of estimating food
texture in daily life monitoring is explored, and a
model of detailed food texture estimation using sound
for wearable eating habits monitoring is developed.
The proposed model’s efficiency has been validated,
showing an high accuracy and a good stability for dif-
ferent individuals and different food types with vari-
ety of food textures.
ACKNOWLEDGEMENTS
This research was supported by Japan Science and
Technology agency (JST)’s strategic sector for cre-
ation of advanced integrated sensing technologies for
realizing safe and secure societies: research project
on ”Development of a Physiological and Environmen-
tal Information Processing Platform and its Applica-
tion to the Metabolic Syndrome Measures”.
REFERENCES
Abraham, S., Collins, G., and Nordsieck, M. (1971). Re-
lationship of childhood weight status to morbidity in
adults. HSMHA Health Reports, Vol. 86, No. 3, pages
273–284.
Amft, O., Stger, M., Lukowicz, P., and Trster, G. (2005).
Analysis of chewing sounds for dietary monitoring. In
Proceedings of 7th International Conference on Ubiq-
uitous Computing. Springer.
Hoffmans, A. F., Kromhout, D., and de Lezenne Coulander,
C. (1989). Body mass index at the age of 18 and its ef-
fects on 32-year-mortality from coronary heart disease
and cancer. a nested case-control study among the en-
tire 1932 dutch male birth cohort. Journal of Clinical
Epidemiology, Vol. 6, Issue 6, pages 513–520.
Hung, H., Willet, W., Ascherio, A., Rosner, B. A., Rimm,
E., and Joshipura, K. J. (2003). Tooth loss and dietary
intake. Journal of the American Dental Association,
Vol. 134, No. 9, pages 1185–1192.
Kohonen, T. (1997). Self-Organizing Maps. Springer, Ger-
many, 2nd edition.
Kohyama, K., Mioche, L., and Bourdiol, P. (2003). In-
fluence of age and dental status on chewing behavior
studied by emg recordings during consumption of var-
ious food samples. Gerontology, Vol. 20, No. 1, pages
15–23.
Morlet, J. (1984). Decomposition of hardy functions into
square integrable wavelets of constant shape. SIAM.
Math. Anal., pages 723–736.
Nishimura, J. and Kuroda, T. (2008). Eating habits moni-
toring using wireless wearable in-ear microphone. In
International Symposium on Wireless Pervasive Com-
munications (ISWPC08). IEEE.
Oka, K., Sakuarae, A., Fujise, T., Yoshimatsu, H., Sakata,
T., and Nakata, M. (2003). Food texture differences
affect energy metabolism in rats. Journal of Dental
Research, vol. 82 No. 6, pages 491–494.
Peng, H., Long, F., and Ding, C. (2005). Feature selec-
tion based on mutual information: Criteria of max-
dependency, max-relevance, and min-redundancy.
IEEE Transactions on Pattern Analysis and Machine
Intelligence Vol. 27, No. 8, pages 1226–1238.
Shuzo, M., Komori, S., Takashima, T., Lopez, G., Tatsuta,
S., Yanagimoto, S., Warisawa, S., Delaunay, J.-J., and
Yamada, I. (2010). Wearable eating habit sensing sys-
tem using internal body sound. Journal of Advanced
Mechanical Design, Systems, and Manufacturing Vol.
4, Issue 1, pages 158–166.
Unler, A., Murat, A., and Chinnam, R. B. (2010). mr2pso:
A maximum relevance minimum redundancy feature
selection method based on swarm intelligence for sup-
port vector machine classification. Information Sci-
ences Vol. 181, Issue 20, pages 4625–4641.
Yoshikawa, S. and Okabe, M. (1978). Texture profile pat-
tern of foods by profile terms and texturometer (in
japanese). Report of National Food Research Insti-
tute, Vol. 33, pages 123–129.
Zhu, F. and Guan, S. (2004). Feature selection for modular
ga-based classification. Applied Soft Computing Vol.
4, Issue 4, pages 381–393.
HEALTHINF 2012 - International Conference on Health Informatics
218
