
STUDY OF TWO FEATURE EXTRACTION METHODS TO
DISTINGUISH BETWEEN THE FIRST AND THE SECOND
HEART SOUNDS
Ali Moukadem
1
, Alain Dieterlen
1
and Christian Brandt
2
1
MIPS Laboratory, University of Haute Alsace, 68093, Mulhouse Cedex, France
2
University Hospital of Strasbourg, CIC, Inserm, BP 426, 67091, Strasbourg Cedex, France
Keywords: Heart sounds, Singular value decomposition, Time-frequency analysis, Feature extraction, Empirical mode
decomposition, s-Transform.
Abstract: Most of the existing methods for the segmentation of heart sounds use the feature of systole and diastole
duration to classify the first heart sound (S1) and the second heart sound (S2). These time intervals can
become problematic and useless in several clinical real life settings which are particularly represented by
severe tachycardia or in tachyarrhythmia. Consequently with the objective of development of a robust
generic module for heart sound segmentation we propose to study two methods of extraction based on
Singular Value Decomposition (SVD) technique to distinguish S1 from S2. A K-Neirest Neighbor (KNN)
classifier is used to estimate the performance of each feature extraction method. The study uses a database
with 80 subjects, including 40 cardiac pathologic sounds which contain different systolic murmurs and
tachycardia cases. The first and the second proposed method reached 96 % and 95% correct classification
rates, respectively.
1 INTRODUCTION
One of the first and most important phases in the
analysis of heart sounds, is the segmentation of heart
sounds. Heart sound segmentation partitions the
PCG signals into cardiac cycles and further into S1,
systole, S2 and diastole. In the classic approach
(Ahlstrom, 2008), the segmentation algorithms can
be divided into 3 parts; the first one is the
localization method which consists of finding S1 and
S2 without distinguishing the two from each other,
the second part consists of estimating the boundaries
of located sounds and the third part aims at
distinguishing between S1 and S2 which is the main
purpose of this paper.
Most of the existing methods in the literature use
the systole and diastole duration (systole regularity)
as a criterion to discriminate between S1 and S2
(Liang et al., 1997), (Dokur et al., 2007) and (Yan et
al., 2009), to name a few. These methods do not
perform well for all types of heart sounds, especially
in the presence of high heart rate or in the presence
of arrhythmic pathologies (figure 1). To deal with
this problem, an unsupervised method for the
discrimination of S1 and S2 using the high
frequency information obtained from the Shannon
energy of the detail coefficients of wavelet analysis
was proposed (Kumar et al., 2011) which uses the
fact that S2 in general contain higher frequency than
S1. However this criterion cannot be generalized on
all real life cases because some medical even normal
conditions are characterize by S2 frequency content
lower than S1 frequency content.
With the objective of development a generic
auto-analysis module, and without any previous
information about the subject, we present in this
paper a supervised approach to classify S1 and S2.
Two feature extraction methods are presented.
Both of them are based on the Singular Value
Decomposition (SVD) technique. The first method
applies the SVD technique on the S-matrix
calculated by the S-Transform time-frequency
method. The second one proposes the use of the
Empirical Mode Decomposition (EMD) technique
and the Shannon energy of the intrinsic mode
functions (IMF) before applying the SVD technique.
The K-Neirest Neighbor classifier is used to estimate
the performance of each feature extraction method.
346
Moukadem A., Dieterlen A. and Brandt C..
STUDY OF TWO FEATURE EXTRACTION METHODS TO DISTINGUISH BETWEEN THE FIRST AND THE SECOND HEART SOUNDS.
DOI: 10.5220/0003743703460350
In Proceedings of the International Conference on Bio-inspired Systems and Signal Processing (BIOSIGNALS-2012), pages 346-350
ISBN: 978-989-8425-89-8
Copyright
c
2012 SCITEPRESS (Science and Technology Publications, Lda.)
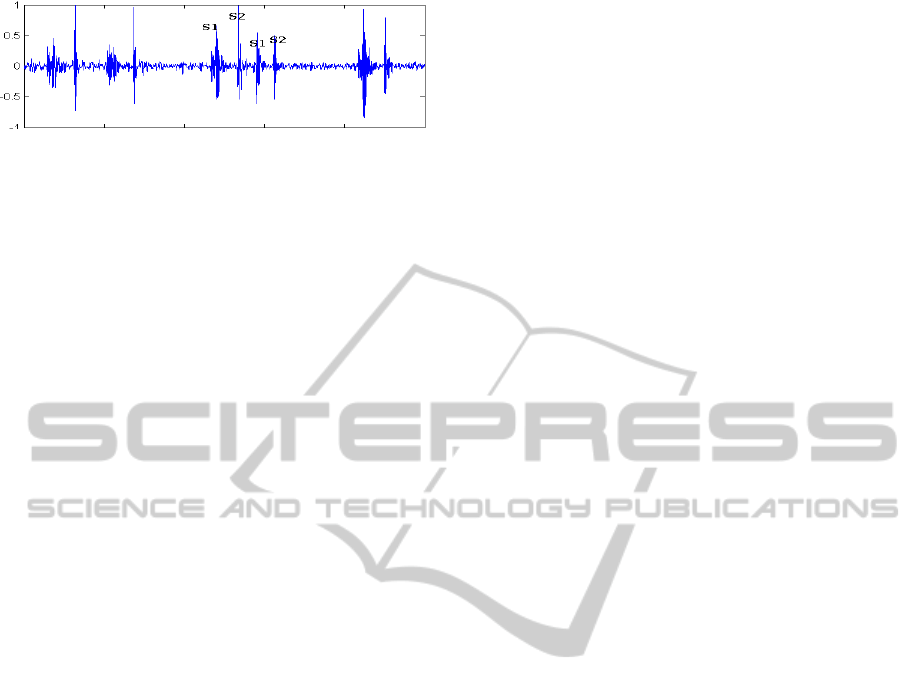
Figure 1: Example of an arrhythmic subject.
This paper is organized as following: sections 2.1
and 2.2 describe the dataset used in this study and
the acquisition and pre-processing of PCG signals,
respectively. In section 2.3 the localization and the
boundaries detection algorithms are presented
briefly, section 2.4 describes the feature extraction
methods. The results and discussion are presented in
section 3, while section 4. consists in conclusions.
2 MATERIAL AND METHODS
2.1 Data Set
Different cardiologists equipped with a prototype
electronic stethoscope with a Bluetooth standard
communication module, have contributed to a
campaign of heart auscultation in the Hospital of
Strasbourg. In parallel, 2 prototypes have been
dedicated to the MARS500 project, promoted by
ESA, in order to collect signals all two months from
6 volunteers (astronauts) in a confinement
experience lasting 520 days and transmitted to IBMP
station in Moscow as a real telemedicine
investigation. The use of prototype electronic
stethoscopes by different cardiologists makes the
database rich in terms of qualitative diversity for the
collected sounds and create the condition for a real
life database.((.n more realistic.))
The dataset contains 80 subjects, including 40
cardiac pathologic auscultation sounds which
contain different systolic murmurs and tachycardia
and or arrhythmia cases. Each recorded auscultation
corresponds to one patient. The length of each
recording lasts between 8 and 12 seconds which
represents generally the time of tolerated apnoea.
2.2 Acquisition and Pre-processing of
PCG Signals
The sounds are recorded with 16 bits accuracy and
8000Hz sampling frequency in a wave format, using
the software “Stetho” developed under Alcatel-
Lucent license. The original signal is decimated by
factor 4 to 2000 Hz sampling frequency and then the
signal is filtered by a high-pass filter with cut-off
frequency of 30 Hz to eliminate the noise collected
by the prototype stethoscope. The filtered signal is
pre-filtered reverse direction so that there is no time
delay in the resulting signal. Then, the
Normalization is applied by setting the variance of
the signal to a value of 1.
2.3 Localization and Boundaries
Detection of Heart Sounds
In this study, the localization of heart sounds is
established by using the SRBF method based on S-
transform and radial basis functions (RBF) neural
network (Moukadem et al., 2011). The boundaries of
the heart sounds are determined by the first local
minima before and after the located sound.
The results were visually inspected by a
cardiologist and erroneously extracted heart sounds
were excluded from the study.
2.4 Classification of S1 and S2
The initial component of S1 is related mitral and
tricuspid valve closure, due to contraction of
ventricles, thus identifying the onset of ventricular
systole and the end of mechanical diastole. The S2 is
produced by the aortic and pulmonic valves closing
when left ventricular pressure decreases under
diastolic aortic pressure. The vibrations of S2 occur
at the end of ventricular contraction and identify the
onset of ventricular diastole and the end of
mechanical systole (Felner, 1990). These
physiological differences lead to different time and
frequency content behaviour between S1 and S2.
Two feature extraction methods for
distinguishing between S1 and S2 are examined.
The feature extraction process extracts a feature
vector per extracted sound H
i
and each of these
vectors is averaged across available extracted sounds
from each subject. So from each subject in the
database, we obtain one S1 feature vector and one
S2 feature vector to use in the training and
classification process.
2.4.1 Feature Extraction using the
s-Transform
The SVD technique is a powerful tool to represent
the time-frequency matrix in a compact manner.
Hassanpour et al. proposed a feature extraction
method based on SVD technique to classify EEG
seizures (Hassanpour et al., 2004). The advantage of
this approach, that it incorporates information from
the eigenvectors, which contains relevant
STUDY OF TWO FEATURE EXTRACTION METHODS TO DISTINGUISH BETWEEN THE FIRST AND THE
SECOND HEART SOUNDS
347
information about signal. Following this approach,
this study proposes a feature extraction method for
S1 and S2 classification.
The time-frequency analysis is performed by the
S-Transform (Stockwell et al., 1996). The S-matrix
S
i
of the extracted heart sound H
i
is decomposed by
the SVD technique as follows:
T
i
UDVS
(1)
Where U(M×N) and V(M×N) are orthonormal
matrices so their squared elements can be considered
as density function (Hassanpour et al., 2004) and
D(M×N) is a diagonal matrix of singular values. The
columns of the orthonormal matrices U and V
contains in this case the time and frequency domain
information, respectively. The eigenvectors related
to the largest singular values contain more
information about the structure of the signal. The
first left eigenvector and the first right eigenvector
that correspond to the largest singular values are
used for the feature extraction process. The
histogram (10 bins) for each related distribution
function is calculated based on the density function.
Five feature vectors obtained by this method are
tested in the classification process; the eigentime
histogram vector U
1
(T-Features), the
eigenfrequency histogram vector V
1
(F-Features), the
singular values vector D
1
(SV Features) and the
time-frequency vector U
1
&V
1
(TF Features). All
vectors have a length of 10 features except the time-
frequency vector that has a length of 20.
2.4.2 Feature Extraction using the EMD
In this study, a new feature extraction method based
on EMD technique and Shannon energy is proposed
for S1 and S2 classification. The EMD method
decomposes a time series signal into IMF
modulating both in amplitude and frequency (Huang
et al., 98).
The initial signal H
i
(t) can be represented as
follows:
n
n
j
ji
rtIMFtH
1
)()(
(2)
Where r(t) is the residual signal. The feature
extraction method consists to calculate the Shannon
Energy of each IMF vector, as follow:
N
k
iii
kIMFkIMFSE
1
22
))(log().(
(3)
Where
4,...,1i and N is the number of samples of
IMF
i
the Shannon energy is smoothed by using a
median filter, and the feature vector is obtained by
applying the same SVD approach used in section
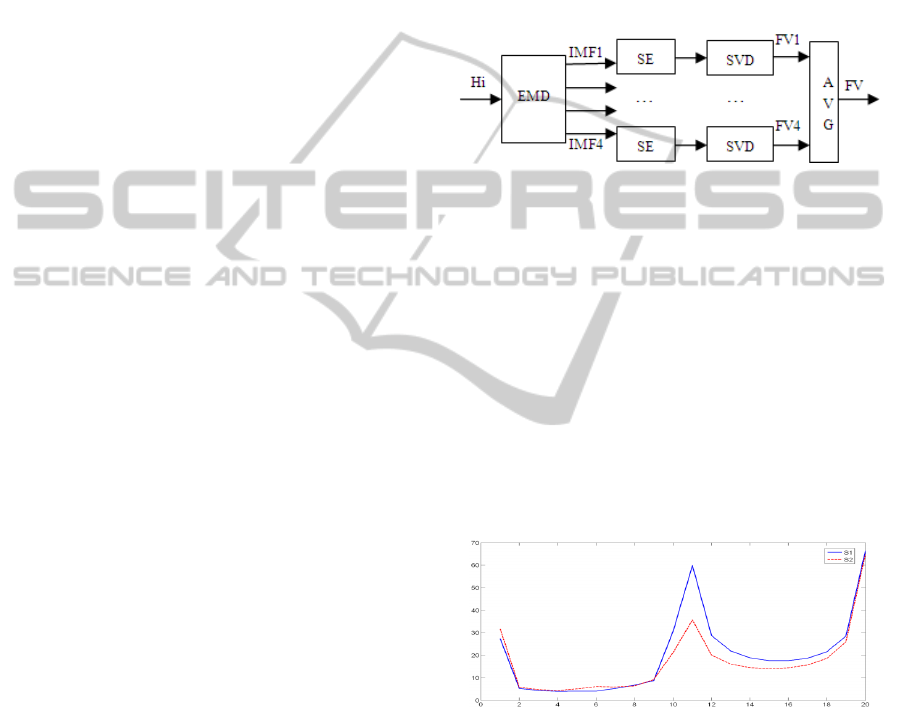
2.5.1 at each calculated IMF (Figure 2). For each
extracted heart sound the first four IMF is
calculated. The others IMF don’t contain relevant
information about S1 and S2. Five feature vectors
obtained by this method are tested in the
classification process; FV1 (that correspond to IMF1
signal), FV2, FV3, FV4 and FV (that correspond to
the average of calculated FVs). The length of each
vector is 10.
Figure 2: Feature vector (FV) of Heart Sounds (Hi)
extracted using EMD and Shannon Energy (SE) before
applying the SVD technique.
3 RESULTS AND DISCUSSION
A 3-Neirest Neighbor (KNN) classifier is used to
evaluate the performance of the nine feature vectors
obtained by the two methods and the 5-fold
approach is used for cross validation. The choice of
KNN classifier was based on its simplicity of and its
robustness to a noisy training data. Other classifiers
can be tested and compared but it is not the main
goal of this study.
Figure 3: Average of TF Feature vectors for S1 (solid line)
and S2 (dashed line) obtained by the S-transform based
method.
The eigenfrequency feature values (first ten
values, figure 3) of S2 are slightly higher than S1 in
all of the cases except the 2 last. However, S1
eigentime feature values (last ten values, figure 3)
are significantly higher than S2 eigentime feature
values. This explains why we obtain a higher
classification rate with eigentime feature compared
to eigenfrequency feature when they are tested
separately (Table1). The singular values are almost
BIOSIGNALS 2012 - International Conference on Bio-inspired Systems and Signal Processing
348

Table 1: Sensitivity and specificity for the nine extracted feature vectors evaluated by a KNN classifier.
KNN T-
Features
F-
Features
SV
Features
TF
Features
FV1 FV2 FV3 FV4 FV
Sensitivity 92% 81% 60% 95% 88% 81% 82% 65% 94%
Specificity 92% 88% 65% 97% 91% 97% 94% 95% 97%
indistinguishable from each other and it is shown by
the low classification rate for the SV features
(Table1). In most cases seen in the medical field, S2
has a higher frequency than S1. This is due to the
fact that S2 is the heart sound associated with the
closure of the aortic valve in a context of high left
ventricular pressure, the mitral closing occurring at
low left ventricular pressure (S1). However, as we
mentioned before, this criterion cannot be
generalized on all real life cases because some
medical conditions are characterized by S2
frequency content lower than S1 frequency content.
Hence, the importance of time-frequency based
features approach, especially in a generic module.
Figure 4: Average of feature vectors (FV) for S1 (solid
line) and S2 (dashed line) obtained by the EMD based
method.
For the EMD based method, the feature vector of
S1 is always higher than the feature vector of S2
(figure 4). This can be explained by the fact that
EMD technique performs a multi resolution analysis
which reflects the richness of the signal at different
frequency bands. Moreover, it is known from a
physiological point of view, that S1 in general is
more complicated than S2, so it is not surprising that
the average of the first four IMF gives higher values
for S1. We note here that FV1, the feature vector
that correspond to the IMF1 gives the best results, in
term of sensitivity, compared to other IMFs when
they are tested separately (Table 1).
4 CONCLUSIONS
Two feature extraction methods based on the SVD
technique are presented in this study for the
classification of S1 and S2. Before applying the
SVD technique, the first method calculates the time-
frequency matrix of segmented heart sound by
applying the S-transform and the second method
calculates the Shannon energy of the first four IMF
obtained by the EMD algorithm. Each feature vector
extracted by these methods is evaluated by applying
a KNN classifier. These methods are tested on a
dataset that contains 80 subjects, including 40
cardiac pathologies sounds which contain different
systolic murmurs and tachycardia cases.
The objective of this paper is to find suitable
features for classification of S1 and S2 without using
the systole regularity criterion. The results obtained
by the proposed approaches are very promising; the
TF Feature vector obtained by the S-transform based
method reaches 96 % correct classification rate, and
the FV feature vector obtained by the EMD based
method reaches 95% correct classification rate. Both
methods are suitable for the main purpose of this
study. More robustness tests against noisy signals,
algorithms complexity, facility of implementation
and more signals, would contribute to choosing the
adequate method in the aim of developing a generic
tool for the automatic heart sounds analysis.
ACKNOWLEDGEMENTS
The authors would like to thank Mr. SIMON Alban
from the University Hospital of Strasbourg, for his
contributions to this study.
REFERENCES
Ahlstrom C., Nonlinear Phonocardiographic Signal
Processing thesis, Linköping University, SE-581 85
Linköping, Sweden, April 2008.
Dokur Z., Ölmez T., Feature determination for heart
sounds based on divergence analysis, Digital Signal
Process. (2007), doi:10.1016/j.dsp. 2007.11.003.
Felner J., The Second Heart Sound, Clinical Methods: The
History, Physical, and Laboratory Examinations. 3rd
edition. 1990.
Kumar D., Carvalho P., Antunes M., Paiva R. P.,
STUDY OF TWO FEATURE EXTRACTION METHODS TO DISTINGUISH BETWEEN THE FIRST AND THE
SECOND HEART SOUNDS
349

Henriques J., An Adaptive Approach to Abnormal
Heart Sound Segmentation, ICASSP 2011.
Hassanpour H., Mesbah M., Boashash B., Time-frequency
feature extraction of newborn EEG seizure using svd-
based techniques. Eurasip J Appl Sig Proc, 16:2544-
2554, 2004.
Huang N. E., Shen Z., Long S. R., Wu Z. C., Shih H. H.,
Zheng Q., Yen N. C, Tung C. C, Liu H. H, The
empirical mode decomposition and the Hilbert
spectrum for nonlinear and non-stationary time series
analysis, Mathematical Physical and Engineering
Sciences 454 (1998) 903–995.
Liang H., Lukkarinen S. and Hartimo I., ”Heart Sound
Segmentation Algorithm Based On Heart Sound
Envelogram”, Proc. of IEEE Computers in
Cardiology, 1997, page. 105-108.
Moukadem A., Dieterlen A., Hueber N., Brandt C.,
Localization of heart sounds based on S-transform and
radial basis functions, 15TH Nordic-Baltic conference
on biomedical engineering and medical physics (NBC
2011) IFMBE Proceedings, 2011, Volume 34, 168-
171, doi: 10.1007/978-3-642-21683-1_42.
Stockwell R. G., Mansinha L., Lowe R. P., Localization of
the complex spectrum: the S-transform, IEEE Trans.
Sig. Proc. 44 (4) (1996) 998–1001.
Yan Z. et al., The moment segmentation analysis of heart
sound pattern, Comput. Methods & Programs Biomed.
(2009), doi:10.1016/j.cmppb.2009.09.008.
BIOSIGNALS 2012 - International Conference on Bio-inspired Systems and Signal Processing
350
