
A HEART RATE PREDICTION MODEL FOR THE
TELEREHABILITATION TRAINING OF CARDIOPULMONARY
PATIENTS
Axel Helmer
1
, Riana Deparade
2
, Friedrich Kretschmer
3
, Okko Lohmann
1
, Andreas Hein
1
,
Michael Marschollek
4
and Uwe Tegtbur
2
1
R&D Division Health, OFFIS Institute for Information Technology, Escherweg 2, D-26121, Oldenburg, Germany
2
Institute of Sports Medicine, Medical School Hannover, Carl-Neuberg-Strasse 1, D-30625, Hannover, Germany
3
Computational Neuroscience, University of Oldenburg, Carl-von-Ossietzky-Strasse 9-11, D-26129, Oldenburg, Germany
4
Peter L. Reichertz Institute for Medical Informatics, University of Braunschweig - Institute of Technology and Hannover
Medical School, Mühlenpfordtstr. 23, D-38106 Braunschweig and Carl-Neuberg-Str. 1, D-30625, Hannover, Germany
Keywords: Modeling, Heart rate, Prediction, Cardiopulmonary rehabilitation.
Abstract: Chronic obstructive pulmonary disease (COPD) and coronary artery disease are severe diseases with
increasing prevalence. They cause dyspnoea, physical inactivity, skeletal muscle atrophy and are associated
with high costs in health systems worldwide. Physical training has many positive effects on the health state
and quality of life of these patients. Heart Rate (HR) is an important parameter that helps physicians and
(tele-) rehabilitation systems to assess and control exercise training intensity and to ensure the patients’
safety during the training. On the basis of 668 training sessions (325 F, 343 M), demographic information
and weather data, we created a model that predicts the training HR for these patients. To allow prediction in
different use cases, we designed five application scenarios. We used a stepwise regression to build a linear
model and performed a cross validation on the resulting model. The results show that age, load, gender and
former HR values are important predictors, whereas weather data and blood pressure just have minor
influence. The prediction accuracy varies with a median root mean square error (RMSE) of ≈11 in scenario
one up to ≈3.2 in scenario four and should therefore be precise enough for the application scenarios
mentioned above.
1 INTRODUCTION
1.1 Background
Patients with chronic obstructive pulmonary disease
(COPD) are suffering from the consequences of a
chronic inflammation of their pulmonary system.
This leads to an obstruction of the bronchi that
causes airflow limitation and shortness of breath.
Often, immobility and social isolation are the
consequences, which in turn reinforce the
degeneration of muscle mass and aggravate the
symptoms. The Global Initiative for Chronic
Obstructive Lung Disease (GOLD) summarizes:
“COPD is the fourth leading cause of death in the
world and further increases in its prevalence and
mortality can be predicted in the coming decades”
(Rodriguez-Roisin and Vestbo, 2009). Just the direct
medical costs attributable to COPD were estimated
at $49.5 billion in the US (Lung Institute, 2009) and
€38.6 billion in the European Union (Simon et al.,
1990) for 2010.
Beside the pharmacological treatment, an
important part of therapy is regular endurance
training. Pulmonary rehabilitation training improves
physical capacity, reduces breathlessness, reduces
the number of hospitalizations and increases the
quality of life (Rodriguez-Roisin and Vestbo, 2009).
1.2 Related Work
Achten and Jeukendrup summarized current research
achievements in the field of heart rate monitoring in
2003 and state: “…the most important application of
30
Helmer A., Deparade R., Kretschmer F., Lohmann O., Hein A., Marschollek M. and Tegtbur U..
A HEART RATE PREDICTION MODEL FOR THE TELEREHABILITATION TRAINING OF CARDIOPULMONARY PATIENTS.
DOI: 10.5220/0003713800300036
In Proceedings of the International Conference on Health Informatics (HEALTHINF-2012), pages 30-36
ISBN: 978-989-8425-88-1
Copyright
c
2012 SCITEPRESS (Science and Technology Publications, Lda.)
HR monitoring is to evaluate the intensity of the
exercise performed” (Achten and Jeukendrup, 2003).
They conclude that the important influence factors
on HR are age, gender, environmental temperature,
hydration and altitude. They estimated the day-to-
day variance under controlled conditions to be 2-4
beats per minute (bpm).
Velikic et al. used data from an accelerometer for
a comparison of different models (linear, non-linear,
Kalman filter) for HR prediction of healthy subjects
and such with congestive heart failure (Velikic et al.,
2010). The two linear models delivered the best
results for a short term prediction of 20 minutes. Su
et al. introduced a model to control HR during
treadmill exercise (Su et al., 2006). Further
approaches for the same application were provided
by Cheng et al. (Cheng et al., 2008) and Mazenc et
al. (Mazenc et al., 2010). Neither have any of these
models been checked for their applicability to
cardiopulmonary patients nor do specialized HR
models exist for these.
1.3 Aim and Scope
Heart rate is an important vital parameter and
thereby an important indicator of a patients physical
state during rehabilitation trainings (Song et al.,
2010). The knowledge about factors that have an
influence on the exercise physiology might help
physicians to take this information into account
when deciding how much load a patient can undergo
during a training session. Hence it could be used to
support creation and optimization of training
schedules and during the current training session
itself to derive the future course.
A difference between the predicted trend of a
normal training and a measured heart rate may give
a hint on a potentially abnormal development and
thereby help to detect critical states before they
occur. This is especially important in tele-
rehabilitation settings, when patient’s train under
unsupervised conditions at home (see (Helmer et al.,
2010); (Lipprandt et al., 2009)). Integrating
predictive models in systems for the planning and
execution of individualized trainings has the
potential to increase patient’s security during
rehabilitation.
The aim of our research, which is presented in
this paper, is to introduce a model which predicts the
patients HR on the basis of given information about
the patient and the environment.
2 METHODS
2.1 Population, Data Acquisition and
Preparation
The data was obtained during outpatient
rehabilitation from cardiopulmonary patients with
NYHA 1-2 and COPD level 2-3. The only exclusion
criterion was the inability to perform training.
We started with an original dataset of 164
patients (82 W, 82 M) and 1201 training sessions,
which were collected between July and September
2009 in the exercise training center of the Medical
School Hannover in addition to regular ambulatory
training sessions. Patients performed their sessions
twice a week, whereas in mean each patient
performed ~8 training sessions (± 7.7). HR was
obtained on the basis of electrocardiogram (ECG)
data. The following additional data were available:
Patient demographics: age, sex
Training data: date and time, duration, load
Vital signs data: resting HR before training,
recovery HR after training, blood pressure (BP)
(rest, load, recovery – systolic and diastolic), Borg
value (Borg, 1970) (used scale 6-20), HR during the
whole training (sample rate ≈ 1 Hz.).
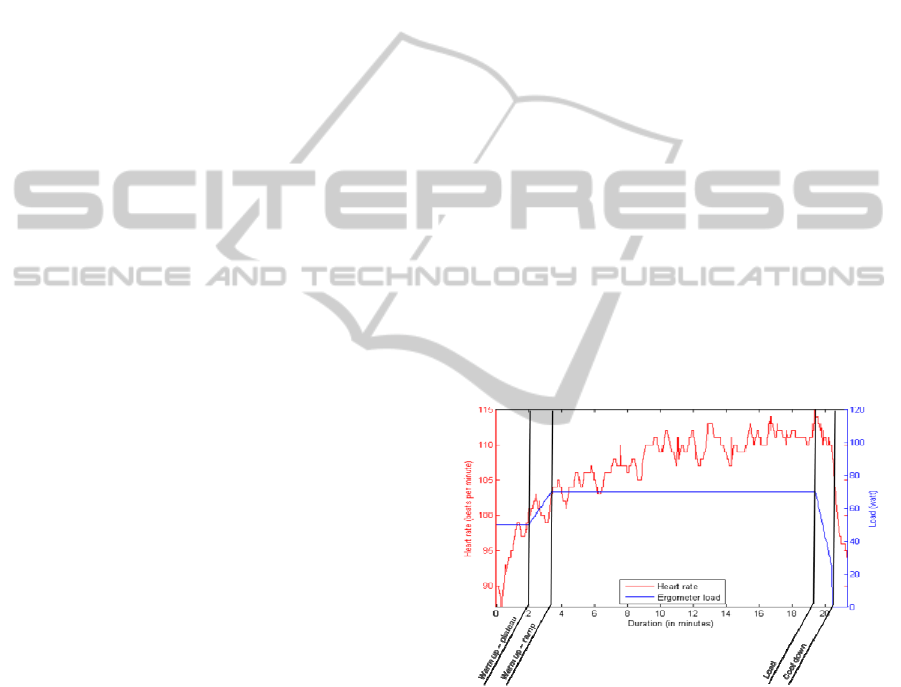
Figure 1: Sample training session with heart rate, training
load and distinction into the four training phases.
We also included environmental variables, which
could have a possible influence. For this purpose we
procured data from the German weather service that
was recorded by a weather station in Hannover
(station id: 2014), where the training took place. We
chose temperature, humidity and air pressure as
main descriptors for weather and added them to the
training data.
Only fully completed training sessions with a
specific phase and full duration and a typical load
course showing the characteristics of a successful
A HEART RATE PREDICTION MODEL FOR THE TELEREHABILITATION TRAINING OF CARDIOPULMONARY
PATIENTS
31
four-phase rehabilitation training (see figure 1) were
included into the dataset. The first phase (warm up)
consists of a load plateau at a certain level. This load
increases stepwise over time in the second phase.
The third phase (load phase) shows a constant load
for at least 10 minutes. In the fourth phase (cool
down) the load is reduced stepwise until it reaches
null. We also excluded sessions, where a monitoring
physician interfered by de- or increasing the training
load, because the reasons of such changes were not
documented in our data. This could also be an
indicator for training under suboptimal conditions,
e.g. the training load was too high or low for the
patient due to an inadequately adapted training
schedule.
To automatically and robustly extract the
sessions from the dataset matching the previously
mentioned criteria, we calculated the difference
derivate of the load values over time to detect
whether the load was in- or decreasing during a
training session. Additionally, a session had to last
from 12 to 26 minutes in total. After discarding all
training sessions not fulfilling these criteria, we
reduced the above mentioned number of 1201 to 668
(325 F, 343 M) training sessions from 115 patients
(in mean 5.8± 4.5 trainings per patient).
2.2 Model Creation
For the integration of the predictive model into
existing training systems the set of potential
predictors (input variables which explain a
significant part of the response variable) varies
depending on the point in time and the use case.
We designed five different scenarios with
expanding/extending datasets, which take place in
settings of telerehabilitation training and during live
training in clinics. The first scenario describes a
situation before training when the schedule is
created, but no reliable weather forecast is available
(approximately three days before the training day).
The second scenario includes the weather forecast.
In the third scenario the patient already wears the
sensors, but the training has not yet been started. The
fourth scenario depicts an ongoing training and the
prediction includes data that was gathered during
previous completed training phases. To provide an
example, the average heart rate of the warm up
plateau phase can be included into the dataset for the
load phase. The fifth scenario describes the situation
after the training and does also include data like the
subjective perceived exertion of the patient
expressed on the Borg scale.
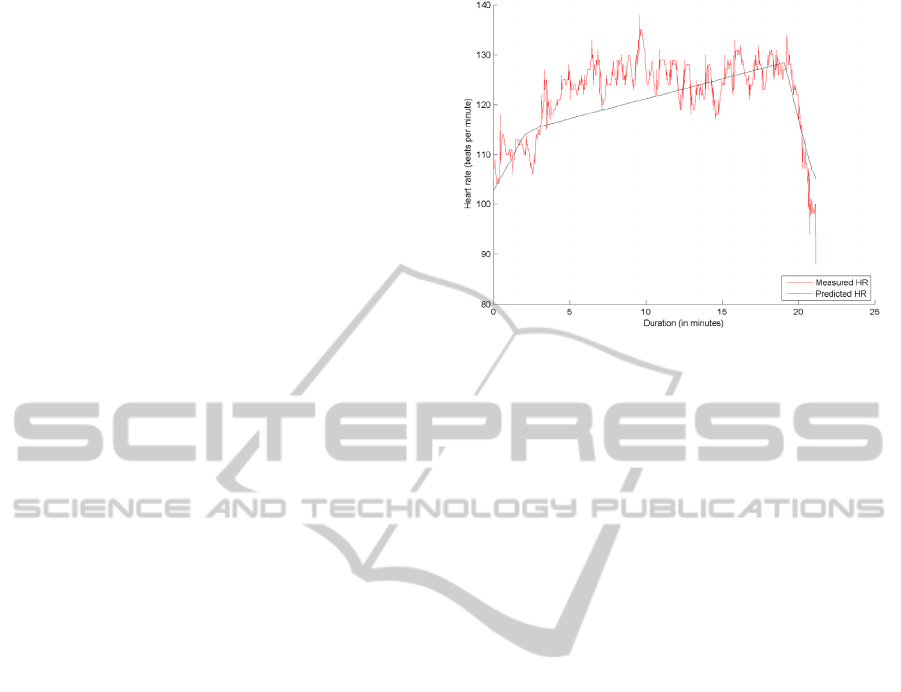
Figure 2: Sample training session for scenario four with
measured and predicted heart rate. The RMSE is
calculated for the four training phases.
The following list is sorted in ascending order by
the number of predictors available and the time in
relation to the training session. Each scenario
expands the predictor set of the previous one:
Scenario S1 (training plan creation): patient
demographics and training plan data (load, duration
of each phase)
Scenario S2 (training plan creation few days
before the training day): weather data
Scenario S3 (at the beginning of the training):
resting HR, resting BP
Scenario S4 (during the training): average HR of
the former phase, HR at the end of the former phase,
BP during the load phase (phase three)
Scenario S5 (after the training): average HR of
current training phase, average HR of load phase,
average HR of all phases, recovery pulse, recovery
BP, average of all BP values, Borg value
The final list of predictors for scenario five included
24 items (see table 1).
To build a hypothesis about which values have a
relevant influence on the HR, we used a stepwise
regression analysis (Hair et al., 2006). This
algorithmic approach performs a multilinear
regression and determines a model, by adding or
removing the variable with the highest or lowest
correlation of the model’s F-statistics stepwisely.
So the variable with the highest chance of
explaining the variance of the given normally
distributed data set is added to the model, when the
correlation is big enough to reject the null
hypothesis. This is done until all variables with
significant influence (predictors) have been added
and all variables with non-significant influence have
been removed from the final model. We used the
HEALTHINF 2012 - International Conference on Health Informatics
32

standard entrance and exit tolerances of p ≤ 0.05 and
p ≥ 0.10 for the model. Additionally, we performed
chi-square tests to confirm the normal distribution of
the HR dataset.
The stepwise regression determines a set of
coefficients (B
i
) and an intercept (also called
constant term) (c) as result. Together with a number
of given predictor values (X
i
) it yields a linear
combination of the following form to calculate the
response variable (Y):
Y = c + b
1
x
1
+ b
2
x
2
... + b
i
x
i
(1)
We created such a submodel for each training phase
(warm up plateau, warm up ramp, training and cool
down) to reflect the different physiological targets.
These four submodels were then concatenated to a
complete model for one training session (see figure
2). This also simplified the comparison to the real
HR of the training sessions used for validation.
2.3 Model Evaluation
To determine the quality of our model and to prevent
overfitting, we performed a 2-fold cross-validation.
We divided the dataset into two parts d
0
and d
1
. Both
parts were of the same size and contained randomly
selected training sessions (n=334) from the dataset.
First, we used d
0
to train the model and validated it
against the d
1
dataset then we performed this
procedure vice versa.
We calculated the root mean square error
(RMSE) which quantifies the deviation between
measured and predicted heart rate over a whole
training.
It is not easy to determine, which predictor of the
resulting model explains which part of the response
variable, as each added predictor depends on the
former one. To make a statement about the influence
of the predictors, we measured the percental
improvement of the RMSE when a predictor is
added to the model in relation to the former one.
3 RESULTS
We modeled the four stages of a training session
(one for each training phase) for the five different
scenarios and determined the weighted RMSE to
quantify the error of each model (see figure 2).
Table 1 shows the contribution of different
predictors to the model and their effect on the
RMSE. Because of their naturally high correlation
(also known as multicollinearity) it is no surprise
Table 1: Mean contribution of the predictors on the scenario (S1-S5) model. All values represent the improvement of the
former RMSE in percent by addition of a predictor during stepwise regression. The “-” symbol denotes that a predictor is
not available in the given scenario. The calculated average influence of a predictor is shown in column “Overall”. The order
of these values is additionally illustrated by a rank order in the last column.
Predictor S1 S2 S3 S4 S5 Overall Rank
Age 11.032 11.032 11.1115 9.002 8.018 10.0391 3
Gender 0.754 0.754 0.745 0.1555 0 0.4817 8
Load 0.368 0.368 5.5555 0.646 0.0775 1.403 6
Overall training duration 0.0645 0.0645 0 0 0 0.0258 12
Duration of current training phase 0.0395 0.0395 0.015 0.019 0.0105 0.0247 13
Air pressure - 0.0265 0.0125 0.141 0.1355 0.078875 11
Temperature - 0 0 0 0 0 -
Humidity - 0 0 0.0585 0 0.014625 14
Resting HR - - 40.9895 7.1535 5.268 17.8036667 2
Resting BP systolic - - 0.494 0.118 0.119 0.24366667 9
Resting BP diastolic - - 0 0 0.0855 0.0285 11
Average HR of former phase - - - 57.0635 54.3 55.68175 1
Load phase BP systolic - - - 0 0.005 0.0025 16
HR at the end of former phase - - - 0 0.0265 0.01325 15
Load phase BP diastolic - - - 0 0 0 -
Average HR of current phase - - - - 5.648 5.648 4
Average HR of load phase - - - - 3.5475 3.548 5
Recovery pulse - - - - 0.6825 0.683 7
Recovery BP diastolic - - - - 0.122 0.122 10
Borg value - - - - 0 0 -
Average HR of all phases - - - - 0 0 -
Average of all BP values systolic - - - - 0 0 -
Average of all BP values diastolic - - - - 0 0 -
Recovery BP systolic - - - - 0 0 -
Total number of predictors 5 8 11 15 24
A HEART RATE PREDICTION MODEL FOR THE TELEREHABILITATION TRAINING OF CARDIOPULMONARY
PATIENTS
33

that four of the first five predictors have a high
impact on the model. Important other predictors are
age and load (Overall>1.4). The only predictor from
the weather data is the air pressure with just a very
small influence of ≈0.08%. Most of the different
blood pressure values and the Borg value have no
impact on the model.
Table 2 shows the accuracy of the prediction. For
the calculation of average and median over the
complete training the phases are weighted by their
duration.
The RMSE for scenario S1 and S2 is similar
(mean ≈12.3 and median ≈11.1). This also shows
that the available weather data has nearly no effect
on HR prediction. With an average HR of ≈98.4
bpm over all training sessions, this is equivalent to a
relative mean error of ≈12.5%. The third scenario
shows an average and median error of ≈8.5 and ≈6.1
which corresponds to a relative mean error of
≈8.6%. The difference between the average and
mean error suggests that there are some outlier
trainings that have a strong influence on the average
error.
Due to the additional predictors in S3, the
median error is almost reduced to 50% compared to
S2. The main reason for this strong improvement is
one dominating predictor: the resting heart rate (see
table 1). The overall ranking of this predictor is
dominated by its S3 value of ≈41%. This strongly
increases the average value where the values are
much lower in S4 (≈7.2%) and S5 (≈5.3%). This
might be caused by the dependence between resting
HR and the average HR of the former phase. The
latter seems to be the better predictor.
S3 is also the scenario in which the training load
has by far the highest influence (≈5.6%) with a
distance of 5% to the next smaller value in S4
(≈0.6%). A plausible explanation for this value
might be that training sessions with
cardiopulmonary patients are generally conducted at
a very low load of ≈35 watt on cycle ergometers.
Therefore the leg movement might have a stronger
influence on the real training load, than the selected
load of the bicycle ergometer.
S4 / S5 are further increasing the precision of the
prediction (mean ≈4.7 / ≈4.9, median ≈3.2 / ≈3.5 in
table 2) with an average relative error of ≈4.8% /
≈5%. This is mainly caused by time-near HR-based
values (average HR of former ≈55.7% and current
phase ≈5.6%).
Although more predictors contribute to scenario
S5 a higher prediction error is calculated compared
to S4, whereas it was vice versa during the model
building process (≈1.56 improvement for the mean
and
≈0.93 for the median RMSE). This is an
indicator for overfitting of the S5 model, which
might occur due to the usage of too many
explanatory variables.
4 DISCUSSION
The stepwise regression algorithm leads to a local
optimum which is not necessarily the global
optimum. A stepwise addition of variables decreases
the models’ RMSE. When using only the RMSE as
an indicator for the degree of influence for each
individual predictor this has the disadvantage, that a
later added predictor may have less influence,
because a part of his improvement is already
explained by the previously added variable. Thereby
the result depends on the order of the steps and
could lead to a suboptimal model when applied to
highly correlated variables (like systolic and
diastolic BP).
Therefore a stepwise regression can never
replace expert knowledge. On a statistical level, we
want to improve the model by performing a factor
analysis that will reduce the number of predictors
and provide a better knowledge about their
correlation to each other. This might also eliminate
the potential overfitting of S5 and enable the transfer
to other training modalities.
The accuracy of our model strongly depends on
the scenario and the associated data items. The first
scenario takes place during the training plan creation
and the calculated model shows the highest error.
This result might still be good enough to gain an
impression about HR development of a common
cardiopulmonary patient during training time. We
believe that the error of this scenario can be
improved by adding further predictors related to the
Table 2: Mean error of the prediction. All values refer to the RMSE of the model in relation to the real HR.
Scenario Phase 1 Phase 2 Phase 3 Phase 4 Average Median
S1
11.448 10.267 12.079 12.954 12.254 11.069
S2
11.443 10.267 12.079 12.986 12.260 11.084
S3
5.528 6.514 8.528 9.561 8.498 6.068
S4
4.347 3.636 4.637 6.572 4.733 3.266
S5
4.762 2.940 4.734 5.281 4.906 3.542
HEALTHINF 2012 - International Conference on Health Informatics
34

patients metabolic response like weight, medication
and information about the current training state.
The available weather data only had a minor
influence and lowers the precision of the model.
This may reflect the fact that weather has no direct
influence on the patient when he trains in a tempered
environment. However, that does not mean that the
direct environment has no influence at all. We want
to examine this by the measurement of the
conditions inside the training area. Furthermore we
are going to examine if the weather indirectly affects
the Borg value, another very important value to
control the intensity of the rehabilitation training.
The influence of the resting HR at the beginning
of a training in S3 leads to a good precision of the
model during the training itself. This predictor is
probably influenced by many other, hard to measure
variables like medical treatment, stress, dehydration
and coffee consumption, which might have a strong
impact on the metabolic system. This leads to the
unexpected observation that the given blood
pressure values show only a very small effect on the
HR. Blood pressure kinetics are in close relationship
to HR, but not to absolute values, due to
antihypertensive treatment in most patient’s.
The prediction can be used to estimate the
patient’s physical state on the day of testing and
thereby help to define an appropriate training
intensity before the training starts.
The phase-wise prediction in S4 during the
runtime of the training shows a relative error below
5%. This should be precise enough to robustly detect
abnormal HR developments and calculate the
optimal load for the next phase. In future we will
focus on the analysis of other time dynamic
predictors that might increase the model accuracy
and also facilitate high refresh rates without the
abstract distinction between training phases.
5 CONCLUSIONS
We created a statistical model to predict HR as an
important vital parameter for the rehabilitation
training of cardiopulmonary patients. We considered
demographic data, training plan information, other
vital parameters and weather information as
potential predictors and classified them into five
aim-specific scenarios. The validation of the model
revealed that weather and the measured blood
pressure have nearly no direct influence on HR. Age
and previously measured HR based variables like the
resting HR strongly influence the responding HR.
The model exhibits an overall low error of ≈11
bpm in median, when used for the creation of a
training schedule (scenario 1). The error is reduced
by about 50%, when the model is used for prediction
at the beginning of a training session. The error
decreases below a significance level when the model
is used during a training to predict HR at the
beginning of each of the four training phases. This
makes it potentially suitable to detect critical
situations before they appear.
The precision of the prediction might be
improved by additionally including expert
knowledge and further statistical methods, but it
already serves as a good basis for the integration of
HR predictive mechanisms into training related
systems and might potentially increase the safety
and efficiency during the rehabilitation training of
cardiopulmonary patients.
ACKNOWLEDGEMENTS
This work was funded in part by the Ministry for
Science and Culture of Lower Saxony within the
Research Network “Design of Environments for
Ageing” (grant VWZN 2420/2524).
REFERENCES
Achten, J., Jeukendrup, A. E., 2003. Heart rate
monitoring: applications and limitations. Sports Med,
33(7):517–538.
Borg, G., 1970. Perceived exertion as an indicator of
somatic stress. Scandinavian journal of Rehabilitation
Medicine, 2(2):92–98.
Cheng, T. M., Savkin, A. V., Celler, B. G., Su, S. W.,
Wang, L., 2008. Nonlinear modeling and control of
human heart rate response during exercise with
various work load intensities. IEEE J BME,
55(11):2499–2508.
Hair, J. F., Black, W. C., Babin, B. J., Anderson, R. E.,
Tatham, R. L., 2006. Multivariate data analysis.
Pearson/Prentice Hall, Upper Saddle River, NJ, 6. ed.
edition. ISBN 0-13-032929-0.
Helmer, A., Song, B., Ludwig, W., Schulze, M.,
Eichelberg, M., Hein, A., Tegtbur, U., Kayser, R.,
Haux, R., Marschollek, M., 2010. A sensor-enhanced
health information system to support automatically
controlled exercise training of COPD patients. In
Pervasive Computing Technologies for Healthcare
(Pervasive Health), 2010 4th International Conference
on, pages 1 – 6.
Lipprandt, M., Eichelberg, M., Thronicke, W., Kruger, J.,
Druke, I., Willemsen, D., Busch, C., Fiehe, C., Zeeb,
E., Hein, A., 2009. OSAMI-D: An open service
A HEART RATE PREDICTION MODEL FOR THE TELEREHABILITATION TRAINING OF CARDIOPULMONARY
PATIENTS
35

platform for healthcare monitoring applications. In
Proc. 2nd Conference on Human System Interactions
HSI ’09, pages 139–145.
Lung, N. H. Institute, 2009. Morbidity & Mortality: 2009
Chart book on Cardiovascular Lung and Blood
Diseases. U.S. Department of Health and Human
Services National Institutes of Health.
Mazenc, F., Malisoff, M., de Queiroz, M., 2010. Model-
based nonlinear control of the human heart rate during
treadmill exercising. In Proc. 49th IEEE Conference
Decision and Control (CDC), pages 1674–1678.
Rodriguez-Roisin, R., Vestbo, J., 2009. Global Strategy
For The Diagnosis, Management, and Prevention Of
Chronic Obstructive Pulmonary Disease. Report.
Simon, P., Schwartzstein, R., Weiss, J., Fencl, V.,
Tegtsoonian, M., 1990. Distinguishable types of
dyspnea in patients with shortness of breath. Am Rev
Respir Dis, 142(5):1009–14.
Song, B., Wolf, K., Gietzelt, M., Al Scharaa, O., Tegtbur,
U., Haux, R., Marschollek, M., 2010. Decision support
for teletraining of copd patients. Methods Inf Med.,
49(1):96–102.
Su, S. W., Wang, L., Celler, B. G., Savkin, A. V., Guo, Y.,
2006. Modelling and control for heart rate regulation
during treadmill exercise. In Proc. 28th Annual Int.
Conference of the IEEE Engineering in Medicine and
Biology Society EMBS ’06, pages 4299–4302.
Velikic, G., Modayil, J., Thomsen, M., Bocko, M.,
Pentland, A., 2010. Predicting heart rate from activity
using linear and non-linear models. In Proceedings of
2011 IEEE 13th International Conference on e-Health
Networking, Applications and Services.
HEALTHINF 2012 - International Conference on Health Informatics
36
