
ON APPLICATIONS OF SEQUENTIAL MULTI-VIEW DENSE
RECONSTRUCTION FROM AERIAL IMAGES
Dimitri Bulatov, Peter Wernerus and Hermann Gross
Fraunhofer Institute of Optronics, System Technologies and Image Exploitation IOSB
Gutleuthausstr. 1, Ettlingen, Germany
Keywords:
Depth map, Point cloud, Urban terrain modeling.
Abstract:
Because of an increasing need and a rapid progress in the development of (unmanned) aerial vehicles and
optical sensors that can be mounted onboard of these sensor platforms, there is also a considerable progress
in 3D analysis of air- and UAV-borne video sequences. This work presents a robust method for multi-camera
dense reconstruction as well as two important applications: creation of dense point clouds with precise 3D
coordinates and, in the case of videos with Nadir perspective, a context-based method for urban terrain mod-
eling. This method, which represents the main contribution of this work, includes automatic generation of
digital terrain models (DTM), extraction of building outlines, modeling and texturing roof surfaces. A simple
interactive method for vegetation segmentation is described as well.
1 INTRODUCTION
Automatic detection and reconstruction of buildings
and vegetation from aerial images has a wide field of
applications (e.g. urban planning, surveillance, disas-
ter rescue). In this field, unmanned aerial vehicles
(UAVs) have become an increasingly attractive tool,
because of their low cost and easy use. From the
mathematical point of view, it leads, however, to an
additional challenge to make difference between 2.5D
and 3D situations. In the first case, we think about
Nadir flights or flights in sufficient altitudes, restricted
depth ranges, and a relatively high potential of model-
based approaches (Fischer et al., 1998; Gross et al.,
2005). The second case implies a relatively high res-
olution of building walls together with surrounding
terrain, wherefore large depth ranges must be taken
into account and generic approaches for building re-
construction (Bulatov and Lavery, 2010; Curless and
Levoy, 1996) from geometric primitives(points, lines,
or triangulated depth maps) obtained in several (ref-
erence) images have clear advantages.
In the present paper, we show how high quality
depth maps can be obtained from short image se-
quences and used to accomplish both tasks. Our input
is thus given by a monocular video or image sequence
processed by a structure-from-motion method, such
that additionally to the camera positions and orienta-
tions, we have a sparse, but precise and reliable set
of 3D points that will be used for dense reconstruc-
tion. After a brief overview of related work in Sec. 2,
the approach (Bulatov et al., 2011) for dense depth
maps computation supported by triangular meshes is
summarized in Sec. 3. A depth map assigns a spatial
coordinate to a dense pixel set of an image. A union
of several such depth maps is a 3D point cloud, which,
visualized in a suitable way (see Sec.4), is often suf-
ficient to perceive the structure of the scene. Never-
theless, for the special case of Nadir images, the as-
sumption of a 2.5D graph (terrain skin) z(x,y) can be
made. We provide in Sec. 5 a model-based approach
tied up with related work (Gross et al., 2005), which
in its original idea, has a LIDAR point cloud as input.
We show qualitative results of the reconstruction in
Sec.6 and give concluding remarks in Sec.7.
2 PREVIOUS WORK
Since the goal of this work is to present the main ap-
plications of depth map extraction rather than depth
map extraction itself, we refer to a survey (Scharstein
and Szeliski, 2002) for a detailed overviewof state-of-
the-art algorithms on dense stereo. Since depth val-
ues are usually discretized and the discretization arti-
facts are undesirable in scenes with many non-fronto-
parallel surfaces, which are typical for UAV videos,
triangular meshes from already available points will
275
Bulatov D., Wernerus P. and Gross H. (2012).
ON APPLICATIONS OF SEQUENTIAL MULTI-VIEW DENSE RECONSTRUCTION FROM AERIAL IMAGES.
In Proceedings of the 1st International Conference on Pattern Recognition Applications and Methods, pages 275-280
DOI: 10.5220/0003707802750280
Copyright
c
SciTePress
be extensively used in the course of this work to re-
place discretization with triangular interpolation.
If 3D point clouds are dense and accurate enough,
they can not only be directly visualized on different
levels of detail but also processed with techniques
mentioned in survey (Kobbelt and Botsch, 2004).
Also, we refer to the work (Pock et al., 2011) for
overview of existing functionals allowing 2.5D-based
depth map fusion. Finally, numerous approaches for
building extraction from images exist. Since it is
hardly possible to obtain heights of buildings from
only one image, those reconstruction pipelines that
work with single images, e.g. those reviewed by
(Mayer, 1999), are less stable than the process of ob-
taining building outlines from image sequences with
partial overlaps. The work of (Rottensteiner, 2010)
presupposes a color segmentation of a pair of images
and uses LIDAR point clouds (sparse, but homoge-
neously distributed in the images) to determine ini-
tial orientation of planes. The non-trivial parts in-
clude grouping the segments into planes and gener-
alizing this approach to video sequences with hun-
dreds of frames. In (Baillard and Zisserman, 2000),
the (roof) planes are associated with an induced ho-
mography with three degrees of freedom between cor-
responding images. If a correspondence of lines bor-
dering this plane is established, the number of degrees
of freedom is reduced to one, namely, the inclination
angle of the (half)-plane. This angle is estimated by
means of error minimization algorithms; the initial-
ization is computed for points with high response of
a ”cornerness” operator (Harris and Stevens, 1998)
in order to facilitate search for correspondences and
then refined for the rest of pixels presumed to lie in
the half-plane. In the next step, neighboring relations
are extensively exploited for grouping of lines, delin-
eation and fusing of planes etc. However, the tasks of
detection and matching edges are not always feasible
for optical images of low quality. The approach of
(Mayer and Bartelsen, 2008) consists of determining
building walls from vertical planes. The algorithm is
very simple and fast because a pixel-wise depth cal-
culation is not performed. However, without a com-
plete visibility analysis, it is not possible to determine
the borders of the walls. Determination of roofs is
also not performed. To our knowledge, the majority
of state-of-the-art approaches does not use dense 3D
point clouds from passive sensors for obtaining build-
ings and vegetation. Hence, we strive to make use
of the rapid progress in depth map calculation from
image sequences and adopt different features of algo-
rithms originally elaborated for LIDAR point clouds
(Geibel and Stilla, 2000; Gross et al., 2005; Rotten-
steiner, 2010).
3 SEQUENTIAL MULTI-VIEW
DENSE RECONSTRUCTION
We consider a sequence of 5 to 10 images I
k
, the
corresponding camera matrices P
k
, and a sparse 3D
point cloud that was obtained by a structure-from-
motion approach from characteristic points detected
and tracked in the images. The desired output is a
dense 3D point cloud corresponding to any pixel of
the reference image (typically in the middle of the se-
quence), as depicted in Fig. 1. In the following, we
give a description of the algorithm (Bulatov et al.,
2011), in which a detailed insight into choice of rele-
vant terms and parameters is provided.
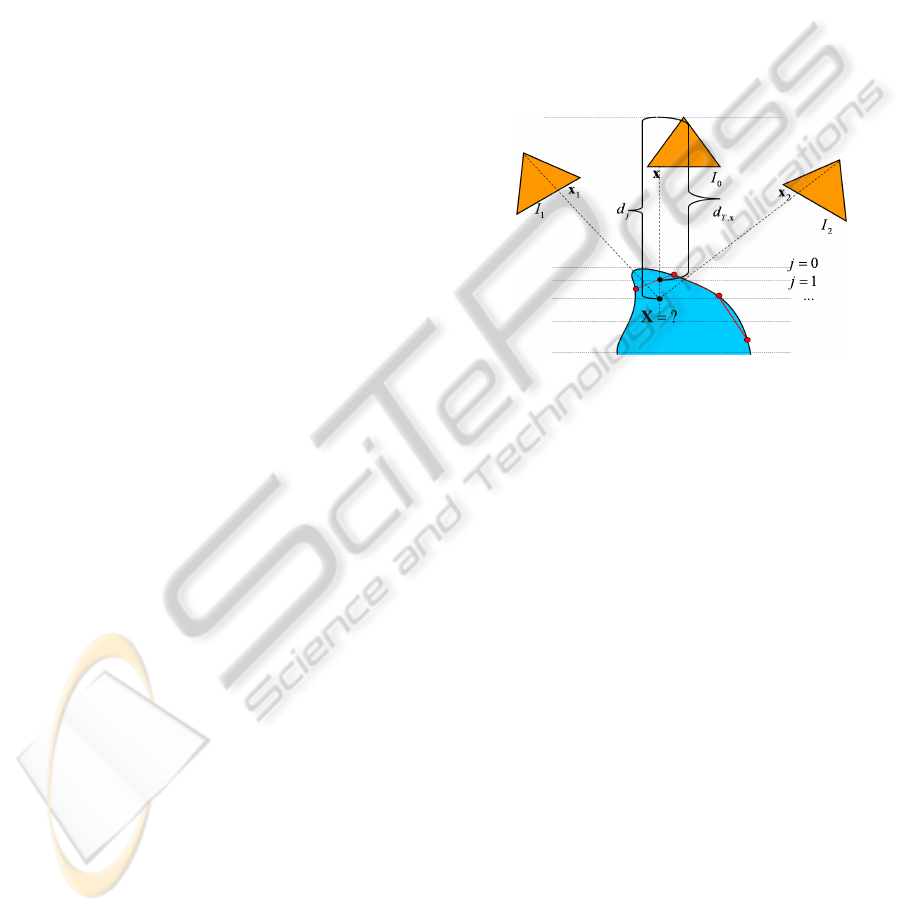
Figure 1: A multi-view configuration. Cameras are de-
picted by triangles, the object surface is below, already re-
constructed points are shown by red circles and the triangu-
lation by red lines. The unknown depth value is determined
by projecting the corresponding 3D point into other images
and comparing intensities of projected (dashed lines) points.
For any pixel x = x
m
of the reference image, there
is only one degree of freedom for its position x
mk
in
another image I
k
. This degree of freedom is given by
the depth value d of x (Hartley and Zisserman, 2000).
The depth is the distance from the corresponding 3D
point X to the principal plane, and, in the case of a
classical pinhole camera with calibration matrix K,
rotation matrix R and translation vector C, the coordi-
nates of X are given as a function of d by the relation:
X = d · (KR)
−1
x+ C. (1)
A reasonable depth range is discretized into depth
labels d
j
. For every pixel x
m
of the reference im-
age, every label d
j
and every other image I
k
of the
sequence, the windows I
k
(w(x
mk
(d
j
))) are compared
with I(w(x
m
)). Here x
mk
is the projection of X from
(1) by camera matrix P
k
and the comparison function
between two such windows w can be, e.g., a trun-
cated sum of absolute values (our choice) of inten-
sity differences or normalized cross correlation. The
data is aggregated into a cost matrix E
data
(m, j). If
x lies in the convex hull of already available points,
ICPRAM 2012 - International Conference on Pattern Recognition Applications and Methods
276

or, more precisely, in a triangle T of their Delaunay-
triangulation in Image I
0
, we add to E
data
a triangle-
based smoothness term E
mesh
that biases the cost val-
ues of x to be equal to the depth d
T,x
resulting from
intersection of the reprojection ray at x with the sup-
port plane of T. In other words, E
mesh
(m, j) can be
any non-decreasing function of kd
j
− d
T,x
m
k, where
d
T,x
= ad
a
+ bd
b
+ cd
c
, (2)
a,b,c are the local barycentric coordinates of x in
T and d
a
,d
b
,d
c
are the depth values at the trian-
gle vertices. This triangle-based smoothing reduces
matching cost ambiguities in untextured areas. The
second step consists of the non-local optimization;
the smoothness function E
smooth
and the optimza-
tion method are chosen according to (Hirschm¨uller,
2008). This methods performs – in a reasonable time
– quite well also in scenes with manyslanted surfaces.
Finally triangles consistent with the surface are se-
lected. To achieve this, the percentage of pixels x with
minimum cost values similar to that resulting from
d
T,x
is measured for every triangle T. In other words,
one checks for x
m
∈ T if min
j
E (m, j)/E (m, j
T
) > r,
where E = E
data
+ E
mesh
+ E
smooth
, j
T
is the depth
label corresponding to d
T,x
and r ≈ 1. When the per-
centage of pixels in a triangle T exceeds a threshold,
all pixels within T are assigned depth values from (2).
This evaluation will facilitate the normal vector ex-
traction in Sec.5.1. Equation (??) is recursive.
4 FUSION, FILTERING AND
VISUALIZATION OF DENSE
POINT CLOUDS
A typical UAV-borne video contains many overlap-
ping images and provides a sufficient coverage of
the scene. Coordinates of 3D points corresponding
to pixels of different reference images are simultane-
ously calculated from the corresponding depth maps
using (1). Unfortunately, the depth estimation is
error-prone, although the number of outliers is greatly
reduced by means of the multi-view reconstruction
presented in Sec. 3. In order to reduce the number of
outliers in the resulting point set, following assump-
tions have been made: given a sufficiently high over-
lap of depth maps, pixels consistent with the surface
can be expected not only within the neighborhood of
correctly estimated points in the same, but also in
other depth maps. On the other hand, outliers tend
to have isolated positions. As a consequence, the lo-
cal density at a 3D point X and the quality of X are
strongly correlated. We assign X an accumulator
W(X) =
∑
X
N
∈N
exp
(ρ − kX− X
N
k)
2
σ
2
where N = {X
N
: kX− X
N
k < ρ}
(3)
and ρ, σ are empiric constants. We define X to be con-
sistent with the surface if the quantile value of the ac-
cumulator function W(X) exceeds a given threshold;
this threshold is, however, not global, but is an in-
creasing function of point density in different regions
of the computation domain. Doing so, will take the
fact into account that the different regions of the scene
are covered by a different number of depth maps.
The output of this procedure is a relatively precise
and homogeneously distributed dense 3D point cloud.
In our OpenGL interface, these 3D points, colored ac-
cording to the correspondingreference images, can be
directly visualized and manipulated. Three main ap-
plications that have these point clouds as input are:
multi-modal registration (Bodensteiner et al., 2010),
generic surface reconstruction, but also the context-
based approach described in Sec.5.1.
5 MODEL-BASED URBAN
TERRAIN RECONSTRUCTION
5.1 Building Extraction
We now consider the situation where (nearly) Nadir
views of the terrain are given. In order to work with
Euclidean units, we project z-coordinates of points
from Sec.4 into the xy-plane and grouping of these
z-values into cells (rastering). In order to segment
buildings from the surrounding, (not necessarily pla-
nar) terrain, the Digital Terrain Model (DTM) ex-
traction is carried out. At the beginning, cells cor-
responding to the ground – those with minimum al-
titude within a circular filter – are fixed; whereby
the circle radius corresponds to the largest dimension
of the smallest building. To cope with few remain-
ing outliers, the original approach of (Gross et al.,
2005), which proposes a solution of Neumann Differ-
ential equation, can be replaced by one of the robust
cost function mentioned in (Pock et al., 2011). We
chose the 2.5D-based L
1
-spline solution due to (Bu-
latov and Lavery, 2010). For the sake of computa-
tion time, the Digital Surface Model (DSM) is given
by a low-pass filtering of the rasterized image. The
height information, given by the difference of DSM
and DTM, is used in a three-step procedure for deter-
mining shape and height of the buildings. The aerial
image is needed to detect trees and to texture the ter-
rain model and the roofs. The procedure is briefly de-
ON APPLICATIONS OF SEQUENTIAL MULTI-VIEW DENSE RECONSTRUCTION FROM AERIAL IMAGES
277
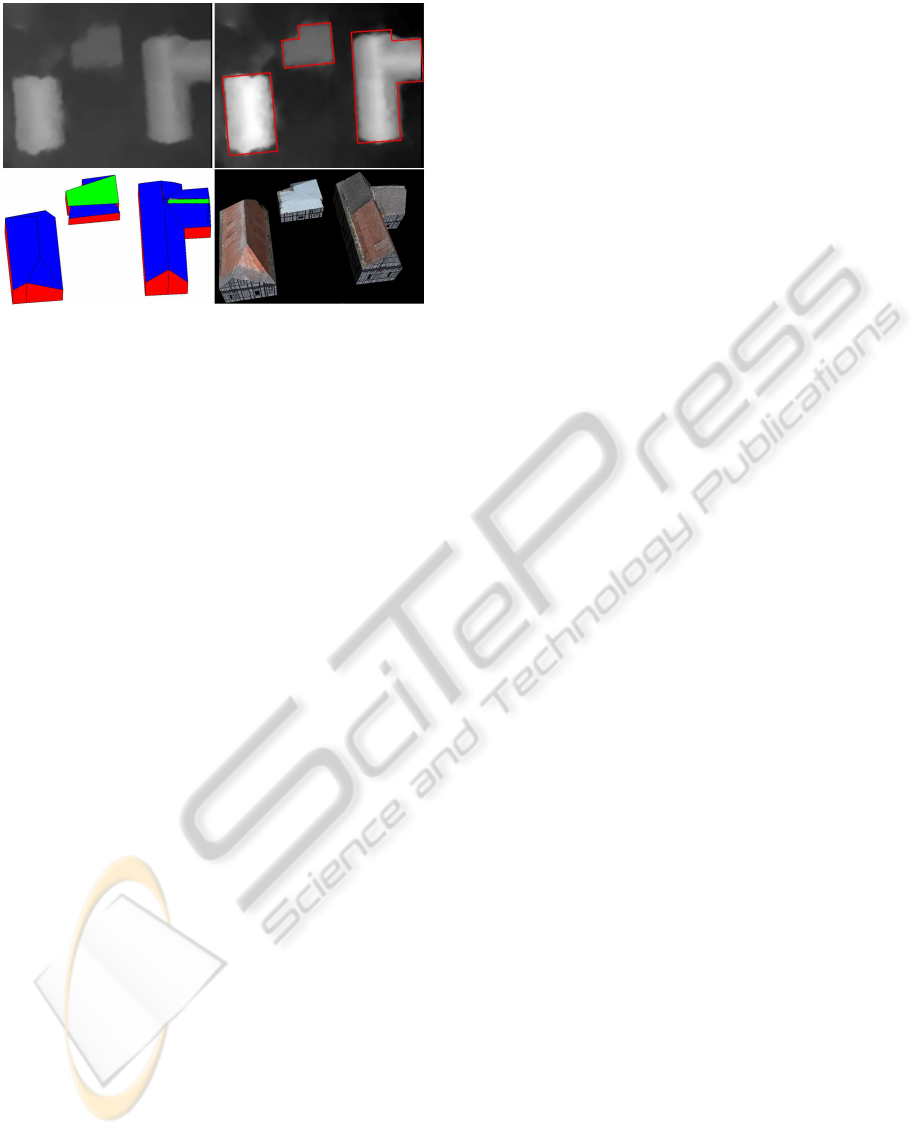
Figure 2: Three steps of context-based building modeling.
The main input is given by (a fragment of) the depth map
followed by extraction of building outlines, modeling of
roof surfaces and texturing. Data set Bonnland, see Sec.6.2.
scribed in the following three paragraphs and visual-
ized in Fig. 2.
Extraction of Building Outlines. The segmenta-
tion process for buildings delivers regions whose bo-
undaries are approximated by rectangular polygons.
If there are small convexities or indentations in the
building contour, short edges are removed by mod-
ifying the object contour through iterative general-
ization. The area is changed as little as possible by
adding to or removing from the object rectangular
subparts. As a result, building outlines are created.
Roof Plane Modeling. To model roof planes, the ap-
proach (Geibel and Stilla, 2000) was incurred into our
work. The normal vector of every internal building
pixel x is determined by computing a local adaptive
operator in a small window around x. Contrary to the
original approach of (Gross et al., 2005) which de-
rived roof planes orientation by extracting dominant
directions of a weighted histogram over all pixels in
the interrelated areas of a building, this task is now
solved by k-means-based clustering these normal vec-
tors and grouping connected pixels into regions. The
roof surfaces are described by polygons afterwards. A
polygonencloses the entire roof surface including dis-
turbed areas; its borders are determined by intersec-
tions of the approximated roof plane with its neigh-
bor planes. Finally, the walls of the buildings are con-
structed through the outer polygon edges of the roof
surfaces (upper edge) and through the terrain height
(lower edge) available from the depth map.
Texturing. The roofs and terrain are textured by
means of the aerial image. If calibrated terrestrial
views are available, the process of texturing can be
extended to the building walls, see e.g. (Haala, 2005).
5.2 An Interactive Tree Detection
Approach
The determination of the building contour is often dis-
turbed by vegetation – especially if the roof is par-
tially occluded by trees. Since tree classification by
first/last echo is impossible for these point clouds,
classification is done in the rasterized image. In the
aerial image, some tree regions are interactively de-
fined. For each band (RGB), mean value and stan-
dard deviation inside the defined tree regions are cal-
culated. All pixels with color values of a smaller devi-
ation from the mean value than the standard deviation
for each band are declared as treelike pixels. These
pixels of the depth map are excluded from the build-
ing reconstruction. In sufficient large tree like areas,
trees are added to the model. To model a tree, we first
create an image V illustrating a tree with transparent
background. The treecolor can be modified to match
the season or the color of the detected tree regions.
Finally, two such images V are placed vertically and
perpendicularly to each other into the model.
6 COMPUTATIONAL RESULTS
6.1 Model-free Dense Reconstruction
We first consider a video sequence representing a
rather complicated building – the cathedral of Speyer
(Germany), recorded by a hand-held camera onboard
of a Cessna. The angle of inclination of the camera
is about 30 degrees to cover building walls. We ob-
tained a relative orientation of the camera trajectory
and a sparse point cloud with (Bulatov, 2008). Depth
map computation was performed by the method de-
scribed in Sec. 3 from seven images. A reference
frame and the corresponding depth map is depicted in
Fig.3, top, while the bottom of the figure represents
two views of a point cloud, before and after fusion,
obtained from seven such depth maps and visualized
in our OpenGL-interface.
6.2 Urban Terrain Modeling
The input data set of this section is a video taken dur-
ing an UAV flight over the village Bonnland, in Ger-
many. After a structure-from-motion algorithm (Bu-
latov, 2008), the depth maps supported by triangu-
lar meshes were obtained from five reference frames.
One of these reference images and the correspond-
ing depth map are presented in Fig.4, top. From the
ICPRAM 2012 - International Conference on Pattern Recognition Applications and Methods
278
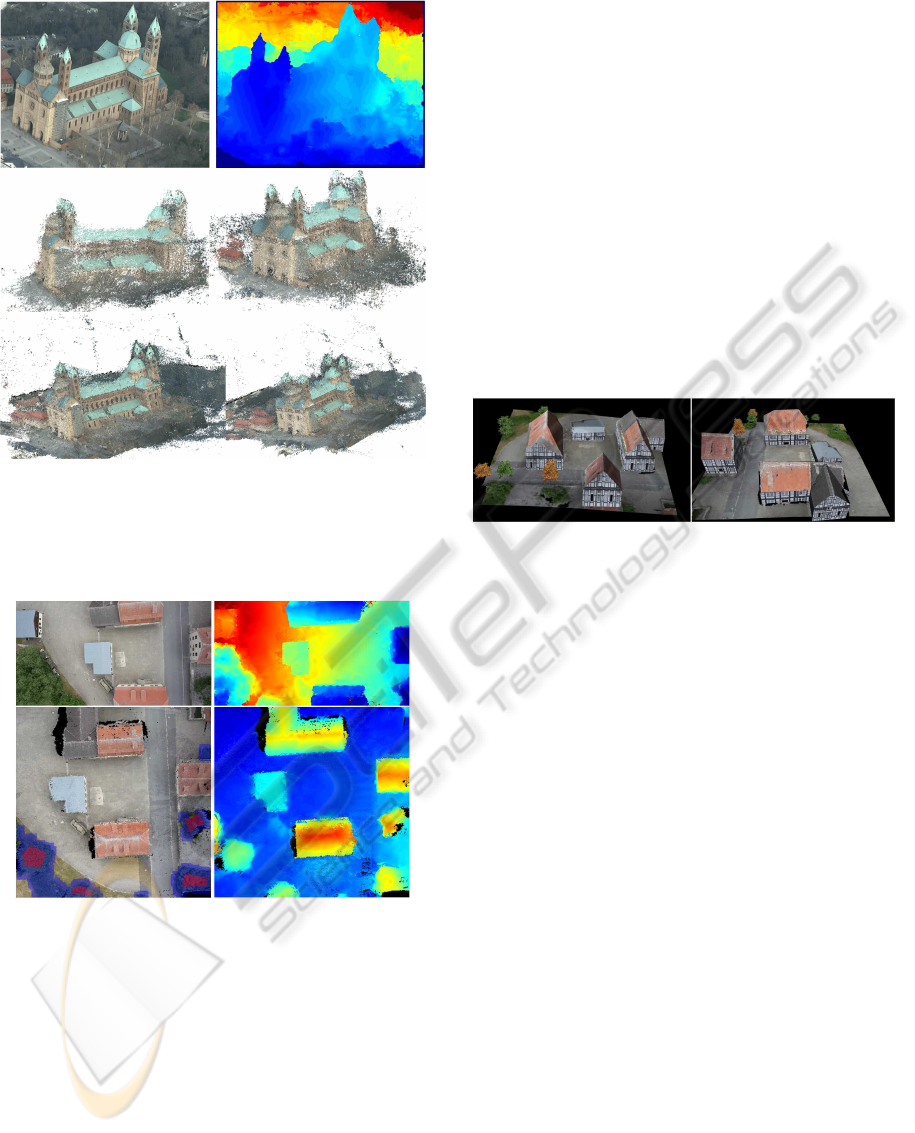
Figure 3: Dense reconstruction of the data set Speyer. Top
row: A video frame and the corresponding depth map. Two
views of the dense point cloud before and after filtering are
shown in the second and last row, respectively. The number
of outliers in the last row is greatly reduced.
Figure 4: Input and intermediate results of the reconstruc-
tion of sequence Bonnland. Top row: a reference image
and the corresponding depth map. Bottom left: the syn-
thetic image obtained by the procedure of Sec. 4 and bottom
right the corresponding terrain skin map z(x,y). In the syn-
thetic image, interactively determined regions of vegetation
are depicted in dark-red, those automatically detected and
post-processed by morphological operations are violet.
depth maps, the z-coordinates of the 3D points are ob-
tained by the proceduredescribed in Sec. 4 and resam-
pled on a rectangular equally-spaced grid (x
k
,y
l
),k =
0,...,470, l = 0, ..., 480. The values for x
0
, x
470
, y
0
,
y
480
are given by the minimum and maximum of x and
y coordinates of the data points, respectively, while
the value of the terrain skin map z(k, l) is the me-
dian of z-coordinates of all data points (x,y) such that
x
k
≤ x < x
k+1
,y
l
≤ y < y
l+1
, see illustration in Fig. 4,
bottom. This is the input image for the algorithm
described in Sec. 5. Two views of the scenery are
depicted in Fig. 5. From the illustration, it becomes
clear that in the small, exemplary sample of the data
set, all four buildings were detected and correctly re-
constructed. For building reconstruction from larger
data sets, the steps of Euclidean reconstruction and
depth maps computation must be performed for dif-
ferent, overlapping parts of the terrain and then fused
by means of the rasterization procedure. The compu-
tation of the DTM is then carried out by the domain-
decomposition routine of (Lin et al., 2006) while the
building reconstruction procedure does not have such
limitations with respect to number of building or size
of the rasterized image.
Figure 5: Views of the model of the data set Bonnland.
Building walls are textured according to regional traditions
while the trees can be modeled according to season. In the
densely wooded regions (in the bottom left corner in all im-
ages of Fig. 4), trees from Sec.6.2 with a constant diameter
are instantiated until they fill the region.
7 CONCLUSIONS AND
OUTLOOK
A robust and automatic approach for extraction of
dense 3D point clouds from several images was pre-
sented. We improved the performance of non-local
methods by overcoming biases towards fronto paral-
lel surfaces and a more reliable reconstruction in tex-
tureless areas by consideration of triangular meshes.
In order to obtain correct depths for pixels that either
lie outside the convex hull spanned by already avail-
able points or in triangles inconsistent with the sur-
face, non-local optimization methodscan be used. Al-
though the semi-global algorithm with 16 optimiza-
tion paths, as proposed in (Hirschm¨uller, 2008), usu-
ally provides good results, the implementation of the
software is very flexible. New cost and aggregation
functions, but also triangular-based smoothness terms
and non-local algorithms can easily be added as addi-
tional modules.
Two applications of sequential multi-view dense
reconstruction were discussed. First we presented the
creation and visualization of dense point clouds from
ON APPLICATIONS OF SEQUENTIAL MULTI-VIEW DENSE RECONSTRUCTION FROM AERIAL IMAGES
279

several reference images. Remaining outliers were re-
moved according to the local density (accumulator)
function (3). Further integration of color and con-
fidence information will concede an additional sta-
bility in the approach. The second application con-
cerns building modeling. The three-step procedure
of (Gross et al., 2005), with the two modifications
of DTM modeling by means of a robust cost func-
tion (L
1
-splines) and k-means based normal vector
clustering, also automatically processes dense point
clouds obtained by passive sensors from light UAVs
in nadir view. Therefore it is shown, that methods for
large scale range data with homegenously distributed
samples can be adapted to relatively low quality, se-
quentially obtained data of theoretical infinite length.
In the majority of cases, urban structures are recon-
structed well, as one can see from Fig. 5. To per-
form an accurate quantitative evaluation of complete-
ness and correctness of the procedure in comparison
with other procedures, such as (Rottensteiner, 2010),
reconstruction of either several high-resolution aerial
images or a larger video sequence must be performed.
These goals are currently being met, but they are be-
yond the scope of our work. Further consideration
of image information (e.g. segmentation) will be a
topic of future work. One can additionally filter out
vegetation: analyzing the reference image by means
of trained data is the only interactive part of the ap-
proach. The trees can then be found in larger regions
of the image (sequence); their height is given by the
depth map. Also here efforts must be made in future
by using color and gradient information in input im-
ages as well as confidence maps for better building
contour extraction and roof analysis.
REFERENCES
Baillard, C. and Zisserman, A. (2000). A plane-sweep strat-
egy for the 3D reconstruction of buildings from mul-
tiple images. ISPRS Congress and Exhibition in Ams-
terdam (Netherlands).
Bodensteiner, C., Hebel, M., and Arens, M. (2010). Ac-
curate single image multi-modal camera pose esti-
mation. Workshop on Reconstruction and Modeling
of Large-Scale 3D Virtual Environments. European
Conference on Computer Vision (ECCV).
Bulatov, D. (2008). Towards Euclidean reconstruction from
video sequences. Int. Conf.Computer Vision Theory
and Applications (2), pages 476–483.
Bulatov, D. and Lavery, J. (2010). Reconstruction and tex-
turing of 3D urban terrain from uncalibrated monocu-
lar images using L
1
Splines. Photogrammetric Engi-
neering and Remote Sensing, 75(10):439–450.
Bulatov, D., Wernerus, P., and Heipke, C. (2011). Multi-
view dense matching supported by triangular meshes.
ISPRS Journal of Photogrammetry and Remote Sens-
ing, accepted for publication.
Curless, B. and Levoy, M. (1996). A volumetric method for
building complex models from range images. Proc.
ACM SIGGRAPH, 30:303–312.
Fischer, A., Kolbe, T., Lang, F., Cremers, A., F¨orstner,
W., Pl¨umer, L., and Steinhage, V. (1998). Extracting
buildings from aerial images using hierarchical aggre-
gation in 2D and 3D. Computer Vision and Image
Understanding, 72(2):185–203.
Geibel, R. and Stilla, U. (2000). Segmentation of Laser-
altimeter data for building reconstruction: Compari-
son of different procedures. Int. Arch. of Photogram-
metry and Remote Sensing, 33 part B3:326–334.
Gross, H., Th¨onnessen, U., and v. Hansen, W. (2005). 3D-
Modeling of urban structures. Joint Workshop of IS-
PRS/DAGM Object Extraction for 3D City Models,
Road Databases, and Traffic Monitoring CMRT05,
Int. Arch. of Photogrammetry and Remote Sensing, 36,
Part 3W24:137–142.
Haala, N. (2005). Multi-Sensor-Photogrammetrie – Vi-
sion oder Wirklichkeit? Habilitation, Deutsche Geo-
d¨atische Kommission, M¨unchen, C589.
Harris, C. G. and Stevens, M. J. (1998). A combined corner
and edge detector. Proc. of 4th Alvey Vision Confer-
ence, pages 147–151.
Hartley, R. and Zisserman, A. (2000). Multiple view geom-
etry in computer vision. Cambridge University Press.
Hirschm¨uller, H. (2008). Stereo processing by semi-global
matching and mutual information. IEEE Transac-
tions on Pattern Analysis and Machine Intelligence,
30(2):328–341.
Kobbelt, L. and Botsch, M. (2004). A survey of point-
based techniques in computer graphics. Computers
& Graphics, 28(6):801–814.
Lin, Y.-M., Zhang, W., Wang, Y., Fang, S.-C., and Lavery, J.
E. (2006). Computationally efficient models of urban
and natural terrain by non-iterative domain decompo-
sition with l
1
-smoothing splines. Proc. 25th Army Sci-
ence Conf., Department of the Army, Washington DC,
USA.
Mayer, H. (1999). Automatic object extraction from aerial
imagery – A Survey focusing on buildings. Computer
Vision and Image Understanding, 74(2):139–149.
Mayer, H. and Bartelsen, J. (2008). Automated 3D re-
construction of urban areas from networks of wide-
baseline image sequences. The Int. Arch. of the Pho-
togrammetry, Remote Sensing and Spatial Informa-
tion Sciences, 37, Part B5:633–638.
Pock, T., Zebedin, L., and Bischof, H. (2011). Tgv-
fusion. Rain-bow of Computer Science. Springer-
Verlag, 6570/2011:245–258.
Rottensteiner, F. (2010). Roof plane segmentation by com-
bining multiple images and point clouds. Proc. of
Photogrammetric Computer Vision and Image Analy-
sis Conference, Int. Arch. of Photogrammetry and Re-
mote Sensing, 38, Part 3A:245–250.
Scharstein, D. and Szeliski, R. (2002). A Taxonomy
and Evaluation of Dense Two-frame Stereo Corres-
pondence Algorithms. International Journal of Com-
puter Vision, 47(1):7–42. Images and ground truth can
be downloaded at: http://bj.middlebury.edu/∼schar/
stereo/data/Tsukuba/.
ICPRAM 2012 - International Conference on Pattern Recognition Applications and Methods
280
