
AN ARTIFICIAL STOCK MARKET
Martin Sewell
The Cambridge Centre for Climate Change Mitigation Research (4CMR), Department of Land Economy,
University of Cambridge, 16-21 Silver Street, Cambridge, CB3 9EP, United Kingdom
Keywords:
Artificial stock market, Technical analysis, Fundamental analysis, Behavioural finance, Multiagent systems.
Abstract:
To set the scene, fundamental analysis, technical analysis, behavioural finance and multiagent systems are
introduced and discussed. The work utilizes behavioural finance; the evolved heuristics and biases exhibited
by fundamental analysts and technical analysts, inducing underreaction and overreaction, are used to build an
agent-based artificial stock market. Results showed that whether a fundamental analyst, or a technical analyst,
it pays to be in a small majority of about 60 per cent, whilst being in a small minority is the least profitable
position to be in. As the number of technical analysts increases, the standard deviation of returns decreases,
whilst the skewness increases. Whilst kurtosis of market returns peaks with around 40 per cent technical
analysts, and rapidly declines as the number of technical analysts exceeds 90 per cent. The autocorrelation
of returns is close to zero with 100 per cent fundamental analysts, and approaches one as the proportion of
technical analysts approaches 100 per cent. The artificial stock market replicates mean returns, the standard
deviation of returns, the absolute returns correlation and the squared returns correlation of a real stock market,
but failed to accurately replicate the skewness, kurtosis and autocorrelation of returns.
1 INTRODUCTION
1.1 Objectives
The focus of this paper is modelling. The aim is to
build an agent-based artificial stock market and ex-
plore the effect of the ratio of fundamental analysts
to technical analysts, and whether and when the re-
sultant time series displays the statistical properties
exhibited by a real market.
1.2 Background
1.2.1 Fundamental Analysis
Fundamental analysis is a method of forecasting mar-
kets through the analysis of relevant news.
1.2.2 Technical Analysis
The second class of ‘actors’ employed in the model
are technical analysts. Technical analysts rely on the
assumption that markets discount everything except
information generated by market action, ergo, all you
need is data generated by market action. Let us for-
mally define technical analysis. If P is price, D is
data generated by the process of trading, and t is
time, then technical analysis is the art of inferring
E(P
t|t>0
|D
t|t<0
).
A taxonomy of the various methods of techni-
cal analysis applied by practitioners is provided by
the syllabus of the Society of Technical Analyst’s
Diploma.
1
However, the technician’s number one
rule is that they follow the trend. Quoting a best-
selling practitioner’s book on technical analysis (Mur-
phy, 1999, p. 49), ‘The concept of trend is absolutely
essential to the technical approach to market analy-
sis. All of the tools used by the chartist—support
and resistance levels, price patterns, moving averages,
trendlines, etc.—have the sole purpose of helping to
measure the trend of the market for the purpose of
participating in the trend. We often hear such famil-
iar expressions as “always trade in the direction of the
trend,” never buck the trend,” or “the trend is your
friend.”’
1.2.3 Behavioural Finance
The algorithms employed by the artificial stock mar-
ket are based on the behaviour of real market partic-
ipants, rather than the actions of the rational but hy-
1
http://www.sta-uk.org/sta diploma.html
293
Sewell M..
AN ARTIFICIAL STOCK MARKET.
DOI: 10.5220/0003687002930300
In Proceedings of the 4th International Conference on Agents and Artificial Intelligence (ICAART-2012), pages 293-300
ISBN: 978-989-8425-96-6
Copyright
c
2012 SCITEPRESS (Science and Technology Publications, Lda.)

pothetical Homo economicus. Behavioural finance is
the study of the influence of psychology on the be-
haviour of financial practitioners and the subsequent
effect on markets. Behavioural finance is of interest
because it helps explain why and how markets might
be inefficient.
Consider some common heuristics and biases.
Availability (Tversky and Kahneman, 1973) is a cog-
nitive heuristic in which a decision maker relies upon
knowledge that is readily available rather than exam-
ine other alternatives or procedures. Representative-
ness (Tversky and Kahneman, 1974) leads people to
predict future events by looking for familiar patterns
and taking a short history of data and assuming that
future patterns will resemble past ones. The status
quo bias (Samuelson and Zeckhauser, 1988) is a cog-
nitive bias for the status quo; in other words, people
tend to be biased towards doing nothing or maintain-
ing their current or previous decision. The status quo
bias can lead to another cognitive heuristic, known
as anchoring (Tversky and Kahneman, 1974), which
describes the common human tendency to make deci-
sions based on an initial ‘anchor’. We prefer relative
thinking to absolute thinking. Other observed consis-
tent but irrational behaviour includes overconfidence,
optimism and herding.
1.2.4 Multiagent Systems
A multiagent system is a system in which several in-
teracting, autonomous, intelligent agents pursue some
set of goals or perform some set of tasks.
The artificial stock market in this paper employs
a multiagent system. Two good books on multi-
agent system are (Weiss, 1999) and (Wooldridge,
2002). In a classic paper, (Arthur et al., 1997) pro-
posed a theory of asset pricing based on heteroge-
neous agents who continually adapt their expecta-
tions to the market that these expectations aggrega-
tively create, thus creating an artificial stock mar-
ket. (LeBaron, 2006) surveys research on agent-based
models used in finance. (Railsback, 2001) addresses
the problem of getting ‘results’—general principles
and conclusions—from multiagent systems and rec-
ommends a pattern-oriented approach.
1.3 Criticisms of Multiagent Systems
Agent-based modelling can stand accused of being
poor science. To do science, one needs ways to test
hypotheses and reach general conclusions. Some of
the problems with multiagent systems:
• Too many free parameters.
• In common with all empirical research, one can
always find evidence to support what one seeks
to prove. Too many possible explanations of the
results leads to the opportunity for story telling.
• No general theoretical way to know whether a
given simulation configuration is the only way to
get from some set of initial conditions to a result
or one of a family of hundreds or millions of ways
to get to a result.
• Model validation can be complicated.
• Difficult to verify that the models are consistent
enough to be useful.
Daniel Kahneman shared the Nobel Prize in Eco-
nomics in 2002 with Vernon Smith. Economists
once thought of their science as inherently non-
experimental, but Smith pioneered laboratory exper-
imental economics, and spearheaded ‘wind tunnel
tests’, where trials of new markets could be tried out
in the lab before being implemented in the real world,
giving policy makers a better understanding of how a
new market is likely to work in practice. Going one
step further, from the laboratory to the computer, on
balance I consider agent-based modelling to be an ef-
fective way of studying behavioural finance, because
empirical results derived from the laboratory can be
aggregated and modelled flexibly and at low cost.
2 HEURISTICS AND BIASES
From my work on the evolutionary foundations of
heuristics and biases (Sewell, 2011b), I identified the
following heuristics and biases in the modern day in-
vestor.
• Overconfidence is likely to lead investors to trade
too much, generally preferring actively man-
aged funds. Excess overconfidence among males
in particular explains the popularity of trading
among men.
• Optimism naturally creates a ‘bullish’ tendency
and can create asymmetry in the behaviour of
markets.
• Availability could, for example, cause us to pur-
chase shares in a company simply because it
comes to mind more readily.
• Herding can lead investors to focus only on a sub-
set of securities, whilst neglecting other securities
with near identical exogenous characteristics.
• Representativeness leads analysts to believe that
trends we observe are likely to continue. Repre-
sentativeness causes trend following by technical
analysts and overreaction among fundamental an-
ICAART 2012 - International Conference on Agents and Artificial Intelligence
294

alysts.
• Anchoring is likely to cause fundamental analysts
to underreact, for example to earnings announce-
ments.
Overconfidence leads to excess trading and helps cre-
ate a liquid market in the first place, optimism likely
increases market participation in general, whilst avail-
ability and herding will generally only effect a subset
of stocks so their impact would be diluted when ag-
gregated across stocks in general. So I only imple-
ment the final two points above, which are the most
relevant regarding market impact. In summary, fol-
lowing (Barberis et al., 1998) we expect underreac-
tion to news but an overreaction to a series of good
or bad news from fundamental analysts, and trend
following from technical analysts. We do not have
sufficient news data to test this hypothesis directly,
but would expect it to generate kurtosis and non-
linearities in market data, which are indeed found in
real markets (Sewell, 2011a).
3 MARKET PARTICIPANTS
The objective is to model a stock market using a mul-
tiagent system. The main criteria is to be as realistic
as possible; that is, the problem domain is mapped
onto the model. The only other criteria is to keep the
model as simple as possible (which is often at odds
with the quest for realism). In practice, traders are
essentially divided into two groups, fundamental an-
alysts (who tend to be longer term) and technical an-
alysts (who tend to be shorter term); the distribution
of agents in our model shall mirror this dichotomy
((Lux, 1995; Hong and Stein, 1999) took a similar
approach). Reviewing the existing literature, at one
extreme, some artificial markets employ agents with
zero intelligence (Gode and Sunder, 1993; Farmer
et al., 2005). Whilst in some implementations agents
are able to swap between technical analysis and fun-
damental analysis depending on their profits (they
have the ability to learn) (Lux, 1998; Lux and March-
esi, 1999; Lux and Marchesi, 2000). I reject the appli-
cation of zero intelligence agents, as in practice most
traders have a reasonably consistent strategy (which
may or may not work). I also reject the idea of agents
swapping between technical analysis and fundamen-
tal analysis, because in practice technical analysts and
fundamental analysts tend to be somewhat antagonis-
tic towards each other
2
. Finally, I reject the notion of
agents learning. Due to a combination of overconfi-
dence, a limited exposure to markets (at most one wo-
rking life) and noise, real traders do not learn how
to predict markets
3
(even if they did, as new traders
replaced the old, they would not improve ‘on av-
erage’); this stasis is trivially mirrored. Indeed,
(Martinez-Jaramillo, 2007; Martinez-Jaramillo and
Tsang, 2009) developed an artificial financial mar-
ket and investigated the effects on the market when
the agents learn, and, on average, their model without
learning replicated the stylized facts most accurately
(though not by much). In my model the technical ana-
lysts simply follow the technician’s number one rule:
they follow the trend, so the model fails to replicate
some of the more complex strategies that chartists fol-
low. The artificial market operates such that each time
step represents one trading day, and the stock price
may be interpreted as a daily closing price.
Below is a taxonomy of five groups of market par-
ticipants.
Fundamental Analysts
• Poor: Trade randomly—fundamental analysts
lacking sufficient skills or experience to analyse
a company will make mistakes at random.
• Real: Consistent, correlated and irrational—
Homo sapiens employed as fundamental analysts
will be susceptible to behavioural biases and make
systematic errors.
• Good: Rational—Skilled fundamental analysts
(Homo economicus) with the ability to accurately
analyse a company, and thus evaluate the value of
its stock.
Technical Analysts
4
• Poor: Trade randomly—those employed as tech-
nical analysts but lacking the ability or experience
to follow the rules of technical analysis.
• Good: Consistent, correlated and irrational—
experienced technical analysts able to trade in ac-
cordance with the rules of technical analysis.
Assuming that all five types of market participant
exist (they do), with imperfect arbitrage opportunities
2
There are two forms of analysis and the practitioners
of each tend to be somewhat antagonistic. Fundamental an-
alysts have referred to Technical analysts as indulging in
voodoo and shamanism and a technician once described the
former’s efforts as “fundamentally a waste of time”’ (Soci-
ety of Technical Analysts, 1999, p. 2).
3
Indeed, there is a negative relationship between the
tenure of a hedge fund manager and hedge fund returns
(Boyson, 2003).
4
Technical analysis is a behavioural bias (representative-
ness), here a ‘good’ technical analyst is one who accurately
and consistently trades according to the rules of technical
analysis.
AN ARTIFICIAL STOCK MARKET
295

and no 100 per cent rational traders, the resultant ef-
fect on the market is the aggregate effect of real fun-
damental analysts trading against good technical an-
alysts. A multiagent system with technical and fun-
damental agents is used to model price action. This
work employs a bottom-up approach and has been de-
veloped from first principles.
4 ARTIFICIAL STOCK MARKET
4.1 Fundamental Analysis
News, by definition, is unpredictable (otherwise it
would have been reported yesterday), so let us assume
that the cumulative impact of relevant news on a stock
follows a geometric random walk. Fundamental an-
alysts calculate the intrinsic value of a stock by the
analysis of relevant news. Let the exogenous variable
V
t
be the perceived fundamental value at time t, where
logV follows a random walk. Note that V is not di-
rectly observable, but changes in the variable are ob-
servable in the form of news, and the model assumes
that V may be calculated. If V increases, this corre-
sponds to good news, if it decreases, this corresponds
to bad news. The fundamental analysts trade on the
basis of this perceived fundamental value alone (they
do not consider historical prices). At each time step,
if the price of a stock is below (above) the perceived
fundamental value of the stock, fundamental analysts
will take a long (short) position in proportion to the
logarithm of the perceived fundamental value over the
price. In other words, the fundamental analysts trade
in such a way that they always move the price towards
the fundamental value. Formally,
log
V
t
V
t−1
> 0 represents good news, and
log
V
t
V
t−1
< 0 represents bad news.
Let n
f
be the proportion of the total number of trades
made by fundamental analysts and P
t
the price at time
t. The idea is to model an underreaction to news,
but an overreaction to a series of good or bad news.
Therefore, the fundamental agents overreact to three
or more successive good (or bad) news items, are
neutral towards exactly two successive good (or bad)
news items and underreact otherwise. In a market
populated entirely by fundamental analysts, the log
return of the price between time t and time t +1 would
be F
t
. The values for the reaction variable, r, below,
are chosen with reference to (Theobald and Yallup,
2004)’s direct measures of the degrees of overreac-
tion and underreactions in financial markets, but the
figures used here are subject to significant uncertainty.
F
t
= r log
V
t
P
t
(1)
where
r =
1.1 if V
t
> V
t−1
> V
t−2
> V
t−3
or
V
t
< V
t−1
< V
t−2
< V
t−3
; else
1 if V
t
> V
t−1
> V
t−2
or V
t
< V
t−1
< V
t−2
;
else
0.9.
(2)
4.2 Technical Analysis
The technical analysts follow the trend, i.e. display
momentum; they consider the historical price of a
stock, and nothing else. At each time step, they ex-
hibit persistence by trading in such a way that the
price is biased towards continuing in the same direc-
tion as the recent past.
Let n
t
be the proportion of trades made by techni-
cal analysts. The technical analysts’ trend-following
strategy looks back three days and weights the price
changes by recency. In this model if the market were
populated entirely by technical analysts, the log re-
turn of the price between time t and time t + 1 would
be T
t
.
T
t
= c
3
log
P
t−2
P
t−3
+ c
2
log
P
t−1
P
t−2
+ c log
P
t
P
t−1
, (3)
where the coefficients c
3
, c
2
and c form an increasing
geometric sequence so that more recent price changes
have a greater impact on T , and sum to one. Solving
c
3
+ c
2
+ c = 1, which has one real root, gives us c =
0.544.
4.3 Stock Price Returns
Changes in price are determined by the following
equation:
log
P
t+1
P
t
= n
f
F
t
+ n
t
T
t
. (4)
By way of example, if P
t
> V
t
, the fundamental ana-
lyst believes that the stock is overvalued. Those who
hold the stock may sell it, those who don’t may either
do nothing or short the stock. Or the fundamental an-
alyst may publish a recommendation that the stock is
a sell. The point is that on aggregate the actions of the
fundamental analysts will put pressure on the stock
price to fall. If, however, the technical analysts put
even greater selling pressure on the stock, the funda-
mental analysts will become net buyers.
ICAART 2012 - International Conference on Agents and Artificial Intelligence
296
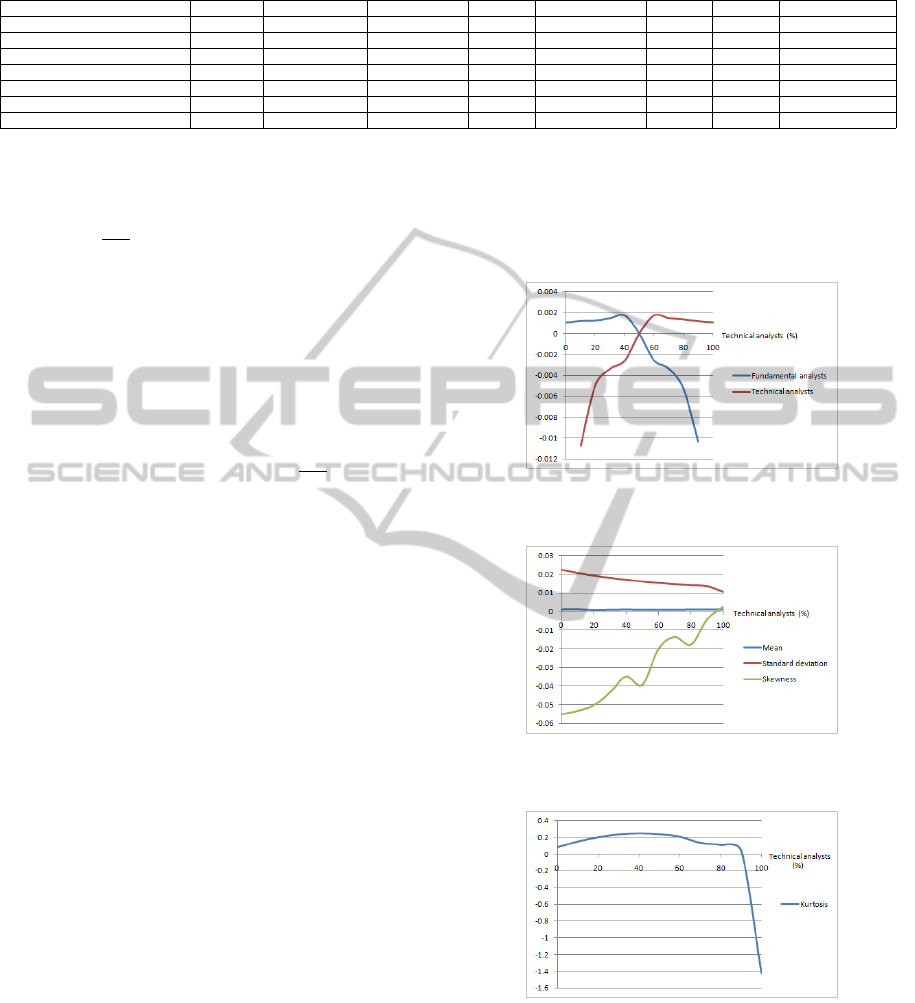
Table 1: Statistics of daily stock log returns (Taylor, 2005).
Coca Cola General Electric General Motors Glaxo Marks & Spencer Shell Mean Standard deviation
Mean 0.001167 0.000742 0.000558 0.001473 0.000725 0.000763 0.000905 0.000344
Standard deviation 0.0169 0.0151 0.0176 0.0179 0.0166 0.0130 0.0162 0.0018
Skewness 0.08 0.03 0.13 0.33 0.03 0.23 0.14 0.12
Kurtosis 5.68 5.43 4.56 6.93 4.40 5.18 5.36 0.91
Returns autocorrelation -0.035 -0.023 -0.003 0.08 0.034 0.045 0.016 0.044
Absolute returns autocorrelation 0.329 0.224 0.204 0.247 0.155 0.196 0.226 0.059
Squared returns autocorrelation 0.545 0.303 0.398 0.414 0.288 0.293 0.374 0.100
(Taylor, 2005) includes various statistics on
stocks, repeated in Table 1. In order to determine the
mean and standard deviation of the Gaussian random
variable log
V
t
V
t−1
, first, a realistic ratio of 50% fun-
damental trades and 50% technical trades (n
f
= 0.5
and n
t
= 0.5) was chosen. Then the mean and stan-
dard deviation space was discretised, an exhaustive
enumeration of return sequences generated, one for
each discrete parameter setting pair, and the pair for
which the mean and standard deviation of the simu-
lated stock returns most closely matched those of the
empirical data in Table 1 was chosen. This resulted
in a mean of 0.0013 and a standard deviation of 0.023
for the Gaussian random variable log
V
t
V
t−1
. The model
was run over 50,000 days twenty times, and averages
of various statistics calculated.
5 RESULTS
Recall that P
t
is the price of a stock at time t, and
V
t
is the perceived fundamental value of the stock
at time t. Note that (Shiller, 1981) calculated that
stock market volatility is five to thirteen times too
high to be attributed to new information, so we should
not expect the standard deviation of P log returns
to equal the standard deviation of V log returns (al-
though perhaps surprisingly, in this model, the latter
is slightly greater). Table 2 (p. 6) lists various statis-
tics of the returns generated by the model as the pro-
portion of technical analysts to fundamental analysts
varies. Figure 1 shows the mean return per analyst,
as the proportion technical analysts/fundamental ana-
lysts varies. Figure 2 shows the mean, standard devia-
tion and skewness of market log returns as the propor-
tion technical analysts/fundamental analysts varies.
Figure 3 shows the kurtosis of market log returns
as the proportion technical analysts/fundamental ana-
lysts varies. Figure 4 (page 6) shows the autocorrela-
tions of returns, absolute returns and squared returns
as the proportion technical analysts/fundamental an-
alysts varies. Table 3 (p. 6) shows that with a real-
istic proportion of technical and fundamental trades,
the artificial stock market replicates mean returns, the
standard deviation of returns, the absolute returns cor-
relation and the squared returns correlation of a real
stock market. However, the artificial stock market
failed to accurately replicate the skewness, kurtosis
and autocorrelation of returns.
Figure 1: Mean log return (P&L) per analyst.
Figure 2: Statistics of price log returns.
Figure 3: Kurtosis of price log returns.
6 DISCUSSION
The results show that whether a fundamental ana-
lyst, or a technical analyst, it pays to be in the ma-
jority, ideally of about 60 per cent, whilst being in
a small minority is the least profitable position to be
AN ARTIFICIAL STOCK MARKET
297

Table 2: Statistics generated by the artificial stock market.
Fundamental analysts (%) 100 90 80 70 60 50 40 30 20 10 0
Technical analysts (%) 0 10 20 30 40 50 60 70 80 90 100
Mean fundamental analyst return 0.0011 0.0012 0.0012 0.0015 0.0017 0.0000 -0.0026 -0.0033 -0.0053 -0.0103
Mean technical analyst return -0.0107 -0.0049 -0.0034 -0.0026 0.0000 0.0017 0.0014 0.0013 0.0011 0.0010
Mean return 0.0011 0.0011 0.0010 0.0010 0.0010 0.0010 0.0010 0.0010 0.0011 0.0010 0.0010
Returns standard deviation 0.0226 0.0208 0.0194 0.0182 0.0172 0.0163 0.0155 0.0149 0.0143 0.0138 0.0108
Returns skewness -0.0552 -0.0533 -0.0503 -0.0434 -0.0348 -0.0393 -0.0201 -0.0136 -0.0178 -0.0043 0.0025
Returns kurtosis 0.0822 0.1512 0.2010 0.2350 0.2476 0.2371 0.2073 0.1348 0.1100 0.0394 -1.4268
Returns autocorrelation 0.0658 0.2038 0.3338 0.4566 0.5690 0.6710 0.7627 0.8423 0.9088 0.9617 1.0000
Absolute returns autocorrelation 0.0093 0.0364 0.0931 0.1750 0.2803 0.4045 0.5403 0.6730 0.7984 0.9083 1.0000
Squared returns autocorrelation 0.0088 0.0401 0.1029 0.1899 0.3021 0.4259 0.5650 0.6974 0.8226 0.9244 1.0000
Figure 4: Autocorrelations of price log returns.
Table 3: Range of proportions of technical analysts in the
artificial stock market that replicate stylized facts.
Statistic Proportion of
technical ana-
lysts
Mean return 0–100%
Returns standard deviation 40–70%
Returns skewness none
Returns kurtosis none
Returns autocorrelation none
Absolute returns autocorrelation 30–40%
Squared returns autocorrelation 40–50%
in. Mean stock returns are low and positive regard-
less of the relative proportions of analysts, this is con-
sistent with a real market. As the number of tech-
nical analysts increases, the standard deviation of re-
turns decreases, whilst remaining realistic, whilst the
skewness increases. The model exhibited slight neg-
ative skewness, whilst real markets exhibit significant
positive skewness. The kurtosis of returns peaks at
around 0.25 with around 40 per cent technical ana-
lysts, and rapidly declines as the number of technical
analysts exceeds 90 per cent. In contrast, the kurtosis
of daily stock returns in real markets is around 5. The
autocorrelation of returns is close to zero with 100 per
cent fundamental analysts, and approaches one as the
proportion of technical analysts approaches 100 per
cent. Unsurprisingly, the trend-following technical
analysts created positive autocorrelations in returns in
the model, but autocorrelations of returns are close to
zero in real markets. The autocorrelation of absolute
and squared returns is realistic only around the region
of 30%–50% technical analysts. How has the model
fared in light of the criticisms of multiagent systems
that were highlighted in Section 1.3 (p. 2)? The main
concern, that one can vary any free parameter until
one obtains the result that one desires, i.e. high kurto-
sis, was mitigated by keeping the number of varying
parameters to a minimum, by using realistic assump-
tions. (Martinez-Jaramillo, 2007; Martinez-Jaramillo
and Tsang, 2009) investigated the different conditions
under which the statistical properties of an artificial
stock market resemble those of a real financial mar-
ket. Their approach replicated the stylized facts of
a financial market far more accurately than my own;
this was possible by including and adjusting a much
larger number of parameters.
7 CONCLUSIONS
Those heuristics and biases which contribute to be-
havioural finance were identified, and used to build
a theoretical model of market action which simulates
the aggregates of many interacting agents. The arti-
ficial market exposed the effect of varying the pro-
portion of technical analysts to fundamental analysts.
It pays to be among the majority, whether a funda-
mental analyst, or a technical analyst. The artificial
stock market replicates mean returns, the standard de-
viation of returns, the absolute returns correlation and
the squared returns correlation of a real stock market,
but failed to accurately replicate the skewness, kurto-
sis and autocorrelation of returns. This implies that
the model has failed to capture some of the dynamics
underlying the process of price formation.
ACKNOWLEDGEMENTS
Thanks to David Barber, Edward Tsang and the
anonymous reviewers for various suggestions.
ICAART 2012 - International Conference on Agents and Artificial Intelligence
298

REFERENCES
Arthur, W. B., Holland, J. H., LeBaron,
B., Palmer, R., and Tayler, P. (1997).
http://www.santafe.edu/research/publications/wpabst
ract/199612093 Asset pricing under endogenous
expectations in an artificial stock market. In Arthur,
W. B., Durlauf, S. N., and Lane, D. A., editors,
The Economy as an Evolving Complex System II,
volume XXVII of Santa Fe Institute Studies in the
Sciences of Complexity, pages 15–44, Reading, MA.
Addison-Wesley.
Barberis, N., Shleifer, A., and Vishny, R. (1998).
http://dx.doi.org/10.1016/S0304-405X(98)00027-0 A
model of investor sentiment. Journal of Financial
Economics, 49(3):307–343.
Boyson, N. M. (2003). http://www.edhec-risk.com/site ed
hecrisk/public/research news/choice/RISKReview10
74252964311707089 Why do experienced hedge fund
managers have lower returns? Working paper, Purdue
University.
Farmer, J. D., Patelli, P., and Zovko, I. I. (2005).
http://www.pnas.org/content/102/6/2254.abstract The
predictive power of zero intelligence in financial mar-
kets. Proceedings of the National Academy of Sci-
ences of the United States of America, 102(6):2254–
2259.
Gode, D. K. and Sunder, S. (1993).
http://www.jstor.org/stable/2138676 Allocative
efficiency of markets with zero-intelligence traders:
Market as a partial substitute for individual rationality.
Journal of Political Economy, 101(1):119–137.
Hong, H. and Stein, J. C. (1999).
http://www.afajof.org/journal/abstract.asp?ref=0022-
1082&vid=54&iid=6&aid=184&s=-9999 A unified
theory of underreaction, momentum trading, and
overreaction in asset markets. The Journal of
Finance, 54(6):2143–2184.
LeBaron, B. (2006). http://dx.doi.org/10.1016/S1574-
0021(05)02024-1 Agent-based computational finance.
In Tesfatsion, L. and Judd, K. L., editors, Handbook
of Computational Economics: Agent-Based Computa-
tional Economics, Volume 2, chapter 24, pages 1187–
1233. Elsevier/North-Holland, Amsterdam.
Lux, T. (1995). http://www.jstor.org/stable/2235156 Herd
behaviour, bubbles and crashes. The Economic Jour-
nal, 105(431):881–896.
Lux, T. (1998). http://dx.doi.org/10.1016/S0167-
2681Socio-economic dynamics of speculative
markets: Interacting agents, chaos, and the fat tails of
return distributions. Journal of Economic Behavior &
Organization, 33(2):143–165.
Lux, T. and Marchesi, M. (1999).
http://www.nature.com/nature/journal/v397/n6719/ab
s/397498a0.html Scaling and criticality in a stochastic
multi-agent model of a financial market. Nature,
397(6719):498–500.
Lux, T. and Marchesi, M. (2000).
http://www.worldscinet.com/ijtaf/03/0304/S0219024
900000826.html Volatility clustering in financial mar-
kets: A microsimulation of interacting agents. Inter-
national Journal of Theoretical and Applied Finance,
3(4):675–702.
Martinez-Jaramillo, S. (2007). http://cswww.essex.ac.uk/
Research/CSP/finance/papers/Martinez-PhD2007.pdf
Artificial Financial Markets: An Agent Based Ap-
proach to Reproduce Stylized Facts and to Study the
Red Queen Effect. PhD thesis, University of Essex,
Colchester.
Martinez-Jaramillo, S. and Tsang, E. P. K. (2009).
http://ieeexplore.ieee.org/xpls/abs all.jsp?arnumber=
4769014 An heterogeneous, endogenous and coevo-
lutionary GP-based financial market. IEEE Transac-
tions on Evolutionary Computation, 13(1):33–55.
Murphy, J. J. (1999). http://www.amazon.com/Technical-
Analysis-Financial-Markets-Comprehensive/dp/0735
200661 Technical Analysis of the Financial Markets:
A Comprehensive Guide to Trading Methods and Ap-
plications. New York Institute of Finance, New York.
Railsback, S. F. (2001). http://rmmc.asu.edu/abstracts/nrm/
vol14-3/rail.pdf Getting “results”: The pattern-
oriented approach to analyzing natural systems with
individual-based models. Natural Resource Modeling,
14(3):465–475.
Samuelson, W. and Zeckhauser, R. (1988).
http://www.springerlink.com/content/h1548722q126
n043/ Status quo bias in decision making. Journal of
Risk and Uncertainty, 1(1):7–59.
Sewell, M. (2011a). http://www-typo3.cs.ucl.ac.uk/fileadm
in/UCL-CS/images/Research
Student Information/R
N 11 01.pdf Characterization of financial time series.
Research Note RN/11/01, University College London,
London.
Sewell, M. (2011b). http://www.springerlink.com/content/n
3k66780q6107653/ The evolution of entrepreneurs
and venture capitalists. In Yazdipour, R., editor, Ad-
vances in Entrepreneurial Finance: With Applications
from Behavioral Finance and Economics, chapter 11,
pages 205–217. Springer, New York.
Shiller, R. J. (1981). http://www.jstor.org/stable/1802789
Do stock prices move too much to be justified by sub-
sequent changes in dividends? The American Eco-
nomic Review, 71(3):421–436.
Society of Technical Analysts (1999). Analysis. STA
Diploma Course.
Taylor, S. J. (2005). http://press.princeton.edu/titles/8055.
html Asset Price Dynamics, Volatility, and Prediction.
Princeton University Press, Princeton, NJ.
Theobald, M. and Yallup, P. (2004).
http://dx.doi.org/10.1016/S1386-4181%2802%2900
068-X Determining security speed of adjustment co-
efficients. Journal of Financial Markets, 7(1):75–96.
Tversky, A. and Kahneman, D. (1973).
http://dx.doi.org/10.1016/0010-0285(73)90033-9
Availability: A heuristic for judging frequency and
probability. Cognitive Psychology, 5(2):207–232.
Tversky, A. and Kahneman, D. (1974).
http://www.sciencemag.org/cgi/content/abstract/185/
4157/1124 Judgment under uncertainty: Heuristics
and biases. Science, 185(4157):1124–1131.
AN ARTIFICIAL STOCK MARKET
299

Weiss, G., editor (1999). http://mitpress.mit.edu/catalog/
item/default.asp?ttype=2&tid=8273 Multiagent Sys-
tems: A Modern Approach to Distributed Artificial In-
telligence. The MIT Press, Cambridge, MA.
Wooldridge, M. (2002). http://eu.wiley.com/WileyCDA/
WileyTitle/productCd-047149691X.html An Introduc-
tion to Multiagent Systems. Wiley, Chichester.
ICAART 2012 - International Conference on Agents and Artificial Intelligence
300
