
THE RESEARCH OF PUBLIC TRANSPORT ENTERPRISES
QUOTA FLOATING FUEL
National Standard GB4353 Fuel Consumption for Passenger Vehicles in
Operation Applied to the Public Transport Enterprise
Yeshi Yuan and Minghong Liu
ChongQing New Town Public Transport Co.,Ltd, ChongQing, China
Keywords: Public transportation, Fuel consumption management, Floating quota, Energy consumption.
Abstract: The research of fuel floating quota is an important innovation for unban public transport fuel quota
management. In this paper ,based in national standard GB4353 Fuel consumption for passenger vehicles in
operation, carried out the study of how to make fuel quota scientifically in urban public transport enterprises
,and combined with actual data to confirm. Many years of practice, research results have proved highly
scientific and feasible.
1 INTRODUCTION
The evaluation on the fuel consumption of public
transport enterprises is in a quota assessment mode
for a long time. That is, when the plan is issued at
the beginning of the year, set a fuel consumption
quota for one bicycle in a month, and then carry the
assessment into execution. In general, the planned
quota is se down by combining historical
experiences with measured data. This practice has a
few drawbacks as follows:
Firstly, quota data based on experiences lacks
credibility. Once historical experiences have
deviation, the quota data will be in error.
Secondly, since there are no experiences in new
routes and new models, we take the measurement by
stimulating full load or laying down a quota data
based on the constitutor’s experiences. After
commissioning after some time, make correction in
according to the real data. With the changes of
passenger flow volume and climate, the fuel
assumption of passenger vehicles also changes. No
matter for passengers, drivers or companies, the
quota quantitative assessment is neither scientific
nor reasonable. At the same time, it is possible for
most of the drivers who are in responsible for new
routes and new models to drive in a higher fuel
consumption way, just in order to get a relatively
loose quota policy.
Therefore, the traditional quota customization
method is unable to solve the questions such as how
to establish fuel consumption when passenger flow
volume, roads or climate change. So one of the most
important problems in transit enterprises
management is the establishment of a scientific and
reasonable fuel plan quota.
2 THE MAIN FACTORS THAT
AFFECT BUS FUEL
CONSUMPTION
Most of Chongqing buses use natural gas. Combined
with national standard GB4353 Fuel consumption
for passenger vehicles in operation, the author
deems that the following factors exist:
Firstly, the factor of LPG station: the accuracy of
gas-send machine’s measurement, the amount of
water and sulphur cut in natural gas, pressure in
sending gases, etc.
Secondly, the factors of roads: quantities and
grades of slopes in urban lines, traffic jam situation,
the amounts of stops, traffic lights and pedestrian
crossing, the frequency of vehicle’s starting.
Thirdly, the factors of vehicle situation: the bus’s
weight, engine displacement, vehicle’s working life,
repairing degree, etc.
291
Yuan Y. and Liu M..
THE RESEARCH OF PUBLIC TRANSPORT ENTERPRISES QUOTA FLOATING FUEL - National Standard GB4353 Fuel Consumption for Passenger
Vehicles in Operation Applied to the Public Transport Enterprise.
DOI: 10.5220/0003603102910296
In Proceedings of the 13th International Conference on Enterprise Information Systems (BIS-2011), pages 291-296
ISBN: 978-989-8425-54-6
Copyright
c
2011 SCITEPRESS (Science and Technology Publications, Lda.)
Fourthly, the factors of drivers’ corporation: the
same road line and the same vehicle, differences
between old and new drivers, and differences of
Energy-saving consciousness.
Fifthly, passenger turnover: the quantity of
passengers load and the frequency of passenger
transfer.
Sixthly, influences of climate: as gas fuel,
climate has a great influence on gas density, some
abnormal conditions as ice blocking also occurs.
Seventhly, influences of altitude: altitude has an
effect on fuel consumption as well as on engine’s
influx of air.
We strongly encourage authors to use this
document for the preparation of the camera-ready.
Please follow the instructions closely in order to
make the volume look as uniform as possible.
(Moore and Lopes, 1999).
Please remember that all the papers must be in
English and without orthographic errors.
Do not add any text to the headers (do not set
running heads) and footers, not even page numbers,
because text will be added electronically.
For a best viewing experience the used font
should be Times New Roman, on a Macintosh use
the font named times, except on special occasions,
such as program code (Section 2.3.7).
3 PROBLEM ANALYSIS AND
SOLUTION
According to national standard GB4353 Fuel
Consumption for passenger vehicles in operation, at
the same operation condition, the fuel consumption
of a large passenger-car is
i
Q =(
a
q
×
S/100+
b
q
×
N
×
S/1000+
c
q
×
(G-
0
G )
×
S/100)
×
Kr
×
K
t
×
K
h
(1)
In this formula,
Q
——vehicle’s operation fuel consumption,L;
a
q ——The basic car fuel consumption,L/100km;
b
q ——Basic additional fuel consumption of
passenger turnover,L/1000p·100km;
c
q ——Basic additional fuel consumption of the
vehicle’s own weight,L/100t·km;
S
——The distance that the bus runs in the same
operation condition,km;
N
——the amount of passengers,p;
G
——the bus’s own weight;
0
G ——buses’ standard weight ;
K
r
——Road correction coefficient
K
t
——Temperature correction coefficient;
K
h
——the altitude correction coefficient;
According to the theoretical data provided by
Engine manufacturer: 1
3
M
natural gas can replace
1.08L gasoline, but due to its uncompleted
combustion, the actual computation is 1
3
M
=1L.
Compared with the vehicle running environment
in national standard formula, the vehicle running
environment in transit enterprises has many
drawbacks. It can not meet S’s (the vehicle’s
travelling distances in the same condition) design
conditions, mainly in several aspects as follows:
1, because buses need to stop in many settled
stops, they must moor and start many times;
2, because passengers get on and off the bus in
different stops, the amount of passengers in different
stops are not the same, thus causes bigger loading
section difference.
3, the Index test environment in national standard
formula is the standard running fuel consumption,
experimenters will not save or waste fuel intended.
However, bus companies often have a quota
appraisal on drivers, in order to strengthen their
energy saving consciousness and effects. Therefore,
in calculating bus route data, it is necessary to
consider the condition when drivers save fuel
intended.
In view of these factors and national standard
data, this essay makes an analysis of historical fuel
consumption data
Firstly, it makes an analysis and comparison of
three factors’ influences on fuel consumption, which
are
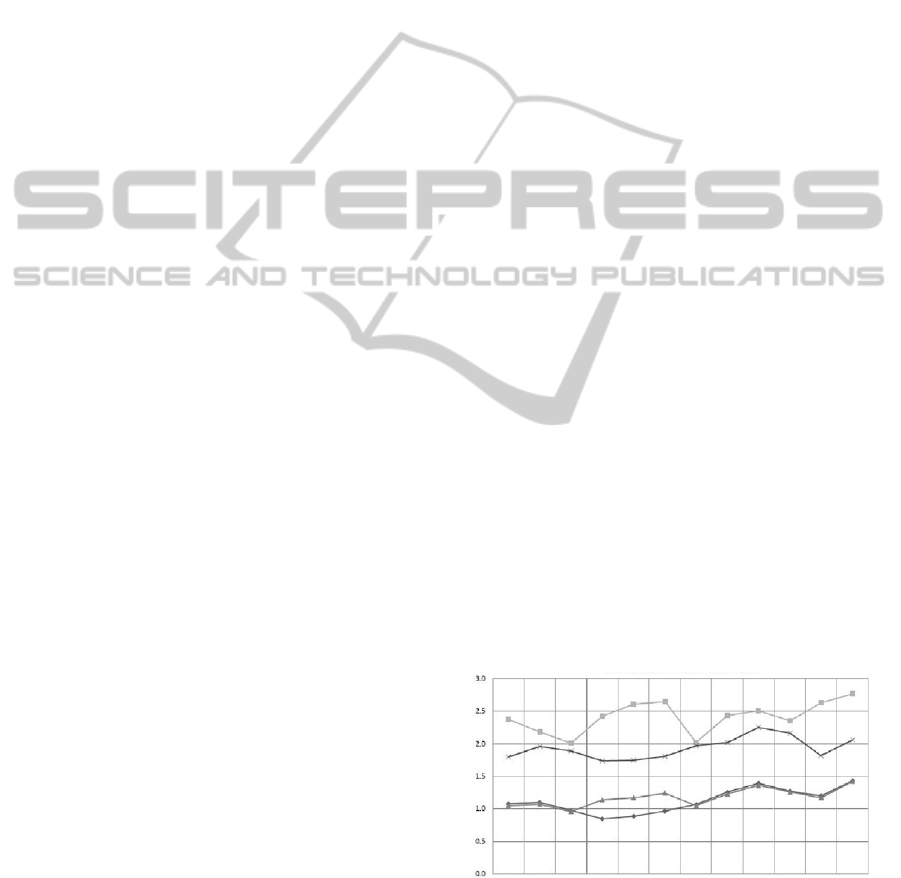
Illustration: the statistical proportion of per-
bicycle passenger throughout is 1:10000; the
statistical proportion of per-bicycle income statistics
1:10000 ; the statistical proportion of per-bicycle
natural gas consumption is 1:1000.
Figure 1: The average.
Note: the account form of per-bicycle passenger
throughout: 1, income in IC card
From chart one, we can see that per-bicycle
passenger throughout changes in accordance to per-
ICEIS 2011 - 13th International Conference on Enterprise Information Systems
292
bicycle natural gas consumption. So there is a
relatively stable relationship between passenger
throughout and natural gas consumption.
Meanwhile, because of the influences of the
discount in IC card and chartered cars, the curve of
passenger transport income and distance income
changes irregularly. Therefore, it is possible to
regard per-bicycle passenger throughout as one of
the parameters of fuel consumption quota.
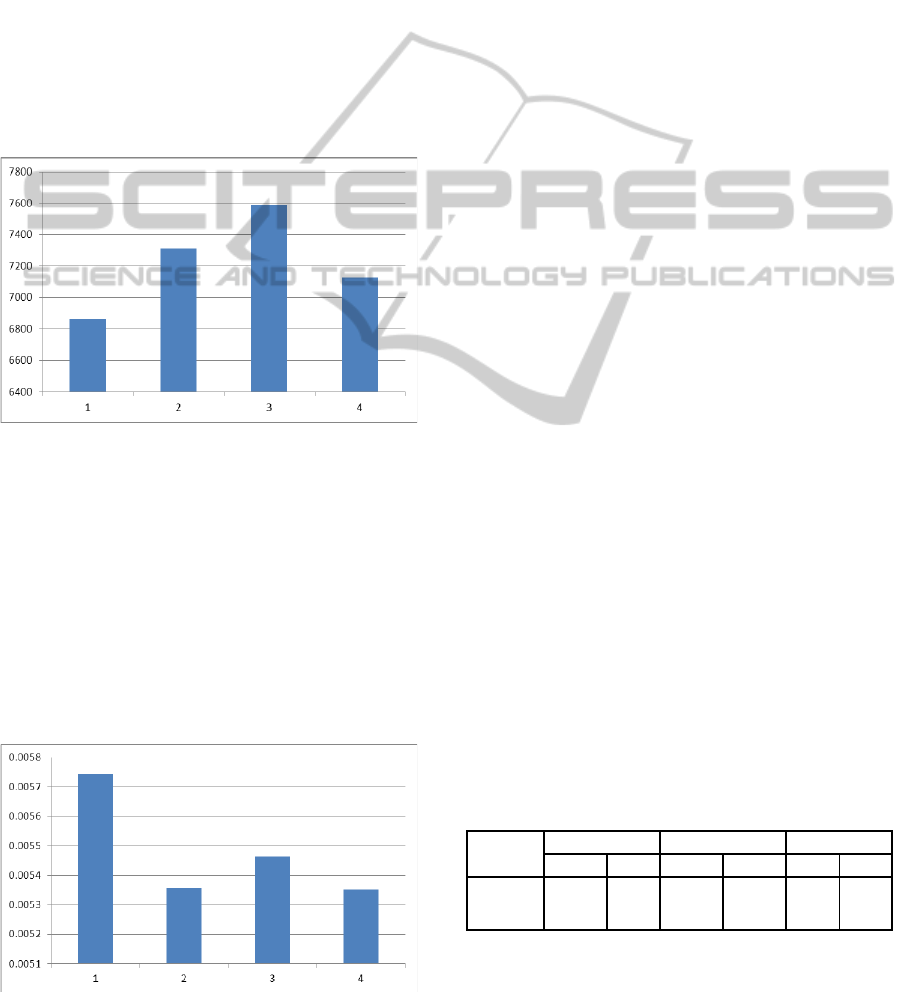
Secondly, Chongqing has four distinct seasons.
In summer the temperature is often above 37℃, in
winter it is below 5 ℃ . According to relevant
material, the ideal temperature of gasoline is
between 5 ℃ and 28 ℃ . Natural gas has a lower
density than gasoline, so it is more greatly
influenced by temperature.
Figure 2: The automobile.
From chart two we can see that temperature has
an influence on fuel consumption. In Chongqing,
passenger capacity in different seasons has marked
differences. Especially in summer, the high
temperature and summer vacation makes less people
go outward by bus, and also bring an effect on fuel
consumption. In chart two, the amount of passenger
capacity has not been taken into consideration, so it
is not accurate. Therefore, it is necessary to bond
passenger capacity together to analyze the effect that
is brought by temperature. As shown in figure 3:
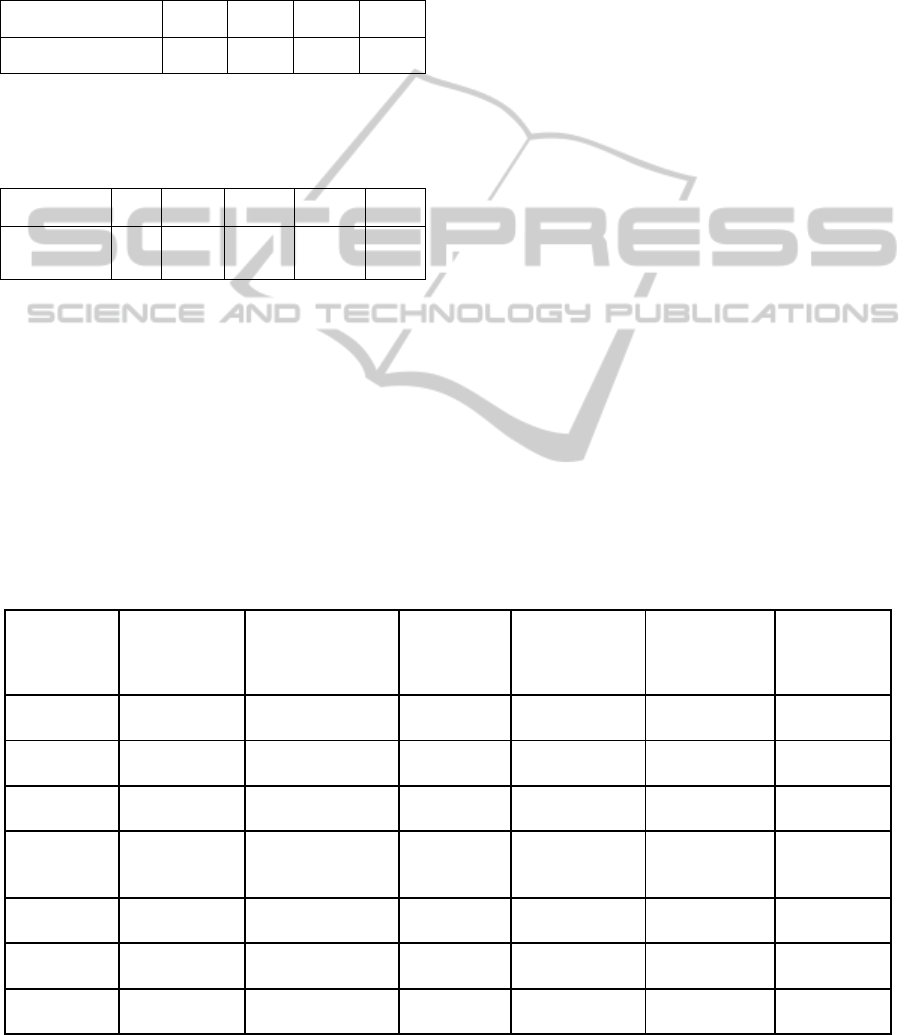
Figure 3: The nature gas.
Chart three analyses passenger capacity’s
influence on natural gas consumption. It seems that
this chart corresponds with rules. In summertime per
capita natural gas consumption is the highest, winter
is in the second place and spring and fall is the
lowest. According to the analysis results and
practical experience, the high temperature in
summer has a big influence on natural gas
consumption, which causes the highest consumption
proportion. The consumption in winter is influenced
by some factors such as temperature, the
consumption proportion is higher than which in
spring and fall.
Thirdly, the experimental environment of transit
enterprises is different from national standard
environment, which cannot be operated in the same
environment for a long time. But due to the buses’
fixed line, there is a law to observe. Use a line for a
unit, and ascertain corresponding modulus based on
fuzzy average method, and then make a comparison
of the coefficient in national standard data.
In national standard data, fuel consumption
consists of four sections: totally basic consumption,
passenger turnover, the empty bus’s weight,
environment condition. Basic operating conditions:
monthly average temperature is between 5℃and 28,
the altitude is no more than 500m.
Totally Basic Consumption
Totally basic consumption refers to the fuel
consumption when the vehicle runs per kilometre in
basic running conditions. In national standard, there
is a standard for some modes. However, what we
need to notice in actual process is that vehicles in the
same type have different basic consumption if they
have distinctive engine displacements. For instance,
Dongfeng cycling vehicles’ engine displacement is
5.42L, totally basic consumption is 23. But if it has a
NQ160 fitting, the engine displacement is 5.96L. it
increases 11 percent when compared with EQ6100
engine. Correspondingly, basic consumption should
be added to 25.3.
The following chart is the totally basic
consumption of different types in national standard:
Table 1: National standard.
Vehicle’s
types
Jiefang Dongfeng Huanghe
bicycle hinge bicycle bicycle hinge bicycle
q
a
23.5 28 23 23.5 28 23
L/100km
Passenger Turnover
The national calculation of fuel consumption needs
to meet several factors, that is, at the same distance,
THE RESEARCH OF PUBLIC TRANSPORT ENTERPRISES QUOTA FLOATING FUEL - National Standard GB4353
Fuel Consumption for Passenger Vehicles in Operation Applied to the Public Transport Enterprise
293

the environment same as passenger turnover and
load level should accorded with each other. But the
vehicle operation is affected by several factors such
as stops intensity, passengers’ get-on-and-off
frequency and road changing conditions. Because
the operation environment in every section has
significant changes, these factors should be
considered reasonably.
Suppose there are buses A and B, which are the
same type, run in the same section and load the same
amount of passengers and their drivers’ operation
level are the same. If passengers in bus A get on and
off the bus frequently, then A has fewer passengers
in united time, and it is loose in the bus, thus causes
a low fuel consumption: in contrast, B has more
passengers in united time, and it is crowded in the
bus, thus causes a high fuel consumption. Analogize
in turn, for buses which have the same amount of
passengers and same distances, the longer they run,
the lower fuel they consumed. It is corresponded
with the notion that every section in the formula uses
kilo consumption as a unit and uses person/
kilometres method.
The following chart is the basic additional fuel
consumption of different vehicles’ passenger
turnover:
Table 2: The consumption of turnover.
Vehicle’s types
Jiefang Dongfeng Huanghe
bicycle hinge bicycle hinge bicycle hinge
q
b
1 0.75 0.8 0.7 0.75 0.55
L/1000p·km
The Empty Bus’s Weight
In calculating fuel consumption, it is necessary to
take
the empty bus’s weight into account. In this
respect, buses’ application is the same with national
calculating method. The vehicle’s weight increment
(△G ) minus standard vehicle weight
0
G (see
chart two). Because the numerous number of buses,
it is necessary to use some simple skills in
calculating. For example, people collection bus and
automated collection bus can increase or decrease
attendants’ weights, and CNG vehicle buses can
calculate bottles’ weight together. For the same type,
the bus with air conditioners and those without air
conditioners can be calculated together.
The following chart is the basic additional fuel
consumption of different vehicles’ standard weight
and weight changes:
Table 3: The consumption of standard weight.
Vehicle’s types
Jiefang Dongfeng Huanghe
bicycle hinge bicycle hinge bicycle hinge
G
0
(吨)
6 9.3 6.2 10.5 8.3 13.5
q
c
1.5 1.2 1.25 1 1.15 0.85
L/100t·km
The Correction Coefficients of Roads,
Altitudes and Seasons
The application of buses should use every line as a
unit and test it based some factors such as the
amount of slopes, the density of stops and traffic
lights, traffic jam situation, closed situation and
standard ruining speed. At the beginning, it is
feasible to imitate historical data and test and modify
it gradually.
The following chart is the reference road correction
coefficient of different levels of highways and urban
roads.
Table 4: The reference road correction coefficient.
Road category The first category
The second
category
The third category The fourth category The fifth category The sixth category
Highway
levels
Plains, rolling
terrain, highways of
first, second and
third level
Plains, rolling
terrain, highways
of the fourth level
Ridges and weigh
grave、highways
of second and
third level
The Highways
beyond plains and
weigh grave
The fourth level
highways beyond
plains and weigh
grave
Highways beyond
ridges and heavy
high
Urban road levels
Plains, rolling
terrain, highways
of the first,
second, third and
fourth level
Heavy ridges’
highways of the
first, second, third
and fourth level
Roads beyond
levels
Road correction
coefficient
Kr
1.00 1.10 1.25 1.35 1.45 1.70
ICEIS 2011 - 13th International Conference on Enterprise Information Systems
294
As we said above, natural is more greatly
affected by temperature than gasoline. According to
the operation of this system in Chongqing, the
experiences are that in specific operation, the
median should be obtained by monthly temperature
changes.
Table 5: The median.
Monthly average
temperature
Lower
than 5℃
5-12℃ 12-35℃
Higher
than 35℃
Temperature correction
coefficient Kt
1.03 1.01 1.00 1.02
The national standard provides altitude
correction coefficient
Table 6: Correction coefficient.
altitude
≤
500
>500-
1500
>1500-
2500
>2500-
3500
>3500
altitude
correction
coefficient Kh
1.00 1.03 1.07 1.13 1.20
According to the former analysis and vast actual
data simulation computation, the fuel consumption
formula which is applied to buses is obtained:
i
Q =(
a
q
×
S/100+
b
q
×
N
×
S/1000+
c
q
×
(G-
0
G )
×
S/100)
×
K
r
×
K
t
×
K
h
(2)
In this formula,
Q ——vehicle’s operation fuel consumption,L;
a
q ——the basic car fuel consumption,L/100km;
b
q
——Basic additional fuel consumption of
passenger turnover,L/1000p·100km;
c
q
——Basic additional fuel consumption of the
vehicle’s own weight,L/100t·km;
S
—— the distance that the bus runs in the same
operation condition,km;
N
——the amount of passengers,p;
G
——the bus’s own weight;
0
G
——buses’ standard weight ;
K
r
——Road correction coefficient
K
t
——Temperature correction coefficient;
K
h
——The altitude correction coefficient;
In order to verify the method, especially the
influences of persons, we select some representative
lines to make s comparison. In chart six, lines A, B
and C have similar environment:
1, ring cars in the same region, small operation limit,
same section
2, operated by the same branch office, repaired in
the same warranty factory
3, because of the same operation date, their types are
the same, drivers’ conditions, skills and working
ages are similar.
The three lines are mainly different in directions,
lines and especially in passenger capacity; the
following chart is their operation in November:
Table 7: The three line.
llines
Quota Q
(cube/100 km)
Actual quotab Q
0
(cube/100 km)
actual
difference
basic
consumption in
empty q
a
Basic additional
consumption of
passenger
turnover q
b
Daily
passenger
amount of a
bus N
d
Aline A 35.83 35.97 -0.14 23 0.8 944.5
Lline B 34.92 35.03 -0.11 23 0.8 898.5
Cline C 33.36 33.12 0.24 23 0.8 762
Bus passenger
flow section
coefficient FN
Daily distance
SN
basic consumption
of the bus’s weight
q
a
The bus’s e
weight G
(ton)
Road correction
coefficient Kr
Season
correction
coefficient K
t
The altitude
correction
coefficient K
h
2 217.9 1.25 7.55 1.1 1 1
2 234.2 1.25 7.55 1.1 1 1
2 256.5 1.25 7.55 1.1 1 1
THE RESEARCH OF PUBLIC TRANSPORT ENTERPRISES QUOTA FLOATING FUEL - National Standard GB4353
Fuel Consumption for Passenger Vehicles in Operation Applied to the Public Transport Enterprise
295

According to the former analysis, line A and B,
which has more passengers, consume more natural
gas, and C, which has fewer passengers, consume
less natural gas. The highest deviation of calculation
quota is 7.19 ‰. So the formula can reflect fuel
consumption in a relative genuineness
This kind of fuel planning system has proved a
strong manoeuvrability after several years’ operation
in bus limited company in New City, Chongqing and
has received extensive approve. The foundation of
this mathematical model is a reformation and
innovation of bus energy management. It provides
new thinking patterns at the same time. For example,
it can applied in a large extent, and it can be
perfected gradually, and make more contribution to
public transport enterprise's scientific management.
REFERENCE
National Standard GB4353 Fuel Consumption for
passenger vehicles in operation
ICEIS 2011 - 13th International Conference on Enterprise Information Systems
296
