
MEASURING I/O PERFORMANCE IN XEN
PARAVIRTUALIZATION VIRTUAL MACHINES
Giovanni Giacobbi and Tullio Vardanega
Department of Pure and Applied Mathematics, University of Padova, Padua, Italy
Keywords: Virtualization, Xen, I/O performance, Storage.
Abstract: This report summarizes the results obtained with measurements of I/O performance in Xen paravirtualized
machines. Focus was put on the performance differences between storage virtualized on a file system as
opposed to directly based on a native partition. The experiments are structured in a repeatable and controlled
way. Some important notions are also discussed about hard disks geometry and measurement units.
1 INTRODUCTION
1.1 Motivation
One of the requirements to deliver high quality
services is to have a reliable computing
infrastructure. Nowadays, companies building their
own computing farm incur high costs because some
of their infrastructure components do not scale down
with the needs of small and medium sized
enterprises, like for example a UPS (Uninterruptible
Power System), or a large-bandwidth redundant link
to the Internet. In most cases, the net result is that
companies end up with overprovisioned and unused
computing resources.
This phenomenon motivated the creation of
companies whose core business case is the supply of
IaaS (Infrastructure as a Service), which assume that
companies requiring computing resources can pay
for what they actually use, only when they need it,
and scaled exactly to their needs.
The main actuator of IaaS is system
virtualization. The current market offers a wide
choice of the so-called monitors or hypervisors, that
is the software layer which enables a single physical
hardware to appear like as many virtual machines as
required, all sharing the same physical resources.
Xen (Barham et al., 2003) was chosen as the
reference hypervisor for our experiments, on account
of its open source nature and the active community
of developers.
We started studying the core functionality of Xen
in April 2010, and soon we realized the obvious: that
in order to do good virtualization you need to be
fully acquainted with every single detail of
computers architecture, from assembly op codes to
the format of message packets exchanged between
your CPU and your SATA hard disk. At the present
state of the art, the bottleneck of virtualization is the
I/O, in particular the storage facilities. Reducing by
even a small factor the overhead in the data path
from the virtual machine to the physical storage, like
tuning a buffer setting in the host’s kernel, can earn
significant performance improvement at the user
level.
1.2 Contribution
The measurements presented in this paper may be
read as terms of reference for the I/O performance
you can expect from different setups.
Our prime objective was that the measurements
were repeatable and explainable. We therefore paid
special attention to the preparation of the
environment as well as of course to execution of the
experiments. For example we obviously discarded
all measurements executed on a busy system
because the scheduling algorithm of the operating
system could interfere with our need for
determinism. Similarly, we cannot compare
measurements from different hard disks or partitions
for the reasons discussed in section 2.1 below. We
also took care in handling the measurement units, so
as to avoid any confusion between the quantities
expressed in multiples of 1024 (KiB, MiB, etc) and
of 1000 (kB, MB, etc).
656
Giacobbi G. and Vardanega T..
MEASURING I/O PERFORMANCE IN XEN PARAVIRTUALIZATION VIRTUAL MACHINES.
DOI: 10.5220/0003450106560662
In Proceedings of the 1st International Conference on Cloud Computing and Services Science (CLOSER-2011), pages 656-662
ISBN: 978-989-8425-52-2
Copyright
c
2011 SCITEPRESS (Science and Technology Publications, Lda.)
1.3 Related Work
Storage technologies are currently receiving a lot of
attention (Adams and Agesen; 2006, Mattmann,
2010; Menon et al., 2005), especially, but not
exclusively the quantitative evaluation of the quality
of the service they provide. There are also some on-
going efforts in the development of QoS monitors
(Chambliss et al., 2005) that defer overzealous
requests that would penalize other time critical
requests. In this paper we focus on a different idea,
to give a numerical value of the maximum and
minimum overheads you can incur in accessing the
storage, by changing only the software
configuration. The numerical values we present are
bound to the particular hardware we used in our
experiments, but the proportional overheads
calculated in this way should be completely context
independent and therefore valid in general.
The only real way to obtain better performance
in I/O is using directed I/O architecture (Intel
Virtualization Technology), which allows guest
operating systems to communicate directly with the
hardware in a safe and isolated way, for example by
using an InfiniBand channel (Huang et al., 2005).
2 MEASUREMENT
ENVIRONMENT
2.1 The Measurement Hardware
The same hardware was used throughout all the
experiments, since the comparison is itself more
important than the numbers. For the sake of the
record, however, the main important details about
the hardware are reported here:
CPU: AMD Athlon 1640B 2.7MHz
RAM: 6GB DDR3
HD: Western Digital WD1600AJS, 7.2krpm
The hard disk manufacturer declared a throughput of
972 Mbit/s, which, once converted to binary units, is
about 116 MiB/s.
2.2 Hard Disk Geometry
Before deciding the initial partitioning of the hard
disk space, it is important to observe that the access
speed is not constant across the addressing space of
a mechanical device
1
. The cylindrical shape of the
1
Solid-state drives (SSDs) are expected to have a perfectly linear
access speed throughout the addressing space, but I didn’t have a
chance to verify this.
hard disk causes the sectors to pass under the heads
at different speeds depending on their geometrical
position. Manufacturers are aware of this
phenomenon and of course they try to place the
sectors more densely towards the center, but there
are physical limitations that cannot be overcome.
Moreover, modern hard disk drives use advanced
firmware which, in contrast with the older CHS
(Cylinder, Head, Sector) coordinates, uses LBA
(Logical Block Addressing) coordinates, which
abstract the physical position of the sectors by
mapping them to an integer number. As a
consequence, the access speed is theoretically
unpredictable because the mapping function is not
known, and for example the firmware might quite
possibly detect and replace a faulty block by
remapping its logical coordinate to a spare unused
sector. Nonetheless, we can assume that there is
some model which describes the access speeds
monotonically with the logical address, and we can
infer it with some preliminary read test.
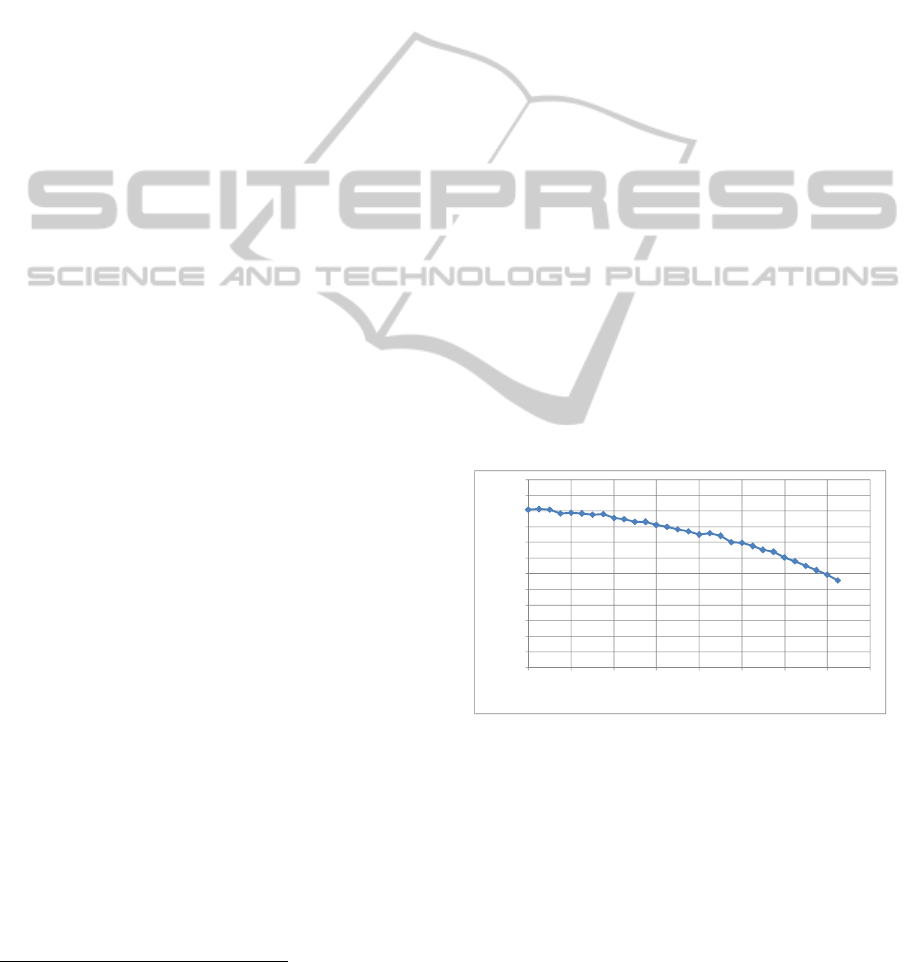
Figure 1 shows the results of the access speed
test, which was executed by reading 1 GiB of data
every 5GiB on the logical address of the hard disk.
Because of the virtualization overheads, all the
following measurements have to be strictly lower
than the values obtained in this manner. The user
requirement is obviously to get performance
numbers as close as possible to these ones from
virtual machines.
Figure 1: Chart for the hard disk geometry, showing
clearly that the access speed of a hard disk is constant over
the logical address coordinates.
2.3 Buffered I/O and Direct I/O in
Linux
In 2001 Andrea Arcangeli proposed (Arcangeli,
2001) and later got approved a patch for the Linux
kernel that allows direct memory transfers. In Linux,
and in many other Unix-like operating systems, the
I/O is buffered, which means that for each
sys_write call the data is first copied from the
0,0
10,0
20,0
30,0
40,0
50,0
60,0
70,0
80,0
90,0
100,0
110,0
120,0
0 20 40 60 80 100 120 140 160
Speed(MiB/s)
Startingoffset(GiB)
MEASURING I/O PERFORMANCE IN XEN PARAVIRTUALIZATION VIRTUAL MACHINES
657
user-space memory to a kernel-space allocated
buffer, and later on a I/O DMA transfer is initialized
using the kernel buffer as memory source. This
strategy has several implications, one of which is
that the operating system applies some (possibly
fair) scheduling of hardware operations across
concurrent processes. Unfortunately, this arbitration
incurs overhead in the memory-to-memory copy
operation required to make this buffering possible.
This notwithstanding, current-generation hardware is
rather fast nowadays in this kind of operations.
The direct I/O, implemented in Linux with a flag
named O_DIRECT, instructs the kernel to initialize
the hardware I/O DMA operation right away,
originating directly from the user space buffer of the
calling application. The consequence is that we save
the overhead of the memory-to-memory transfer, but
we face the problem that hardware requests have a
specific duty-cycle, which spaces them by a
minimum time span. It therefore follows that if we
do not have enough data to transfer we will end up
wasting more time waiting for the hardware
operation to finish than the amount we save by
skipping the buffering. This latter fact will be
evident in section 3, where we compare the results
obtained with and without the O_DIRECT flag.
2.4 Environment Setup
The experimental environment consists of the
operating systems installed on the hardware and the
partitioning of the physical and virtualized hard
disks. It is really important to plan in advance how
this is going to look like, because a change in the
configuration requires all the experiments to be
executed again to preserve the consistency of the
measurements.
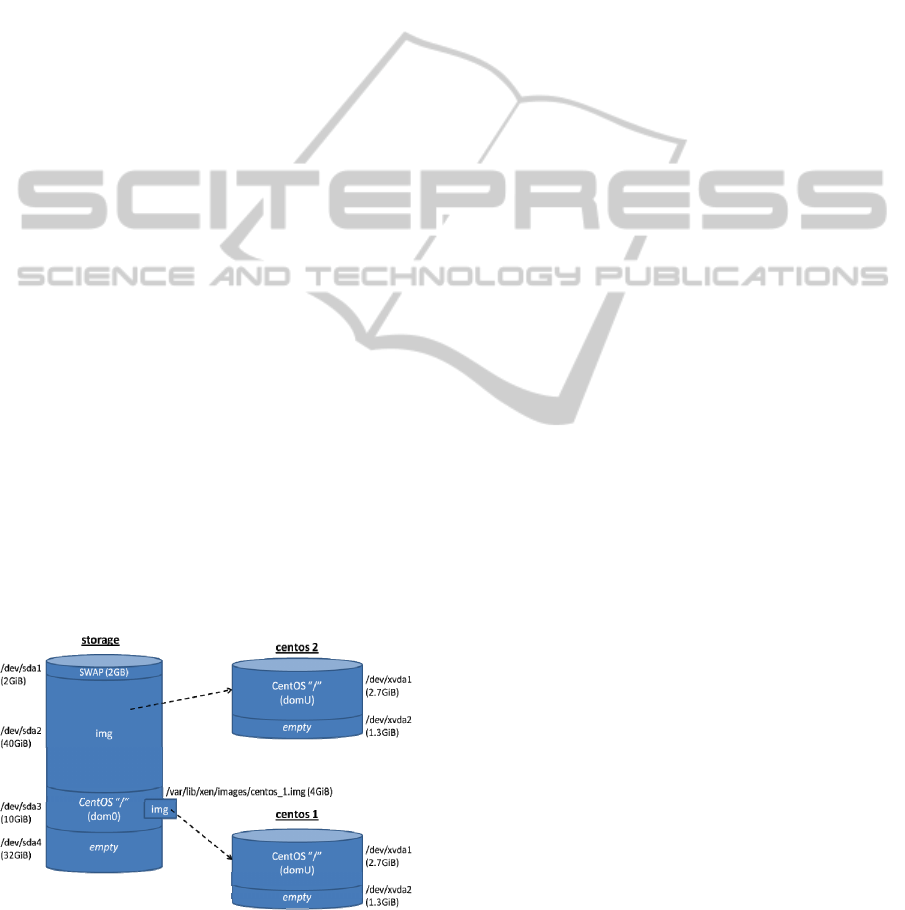
Figure 2: General layout for the experimental environment
representing physical and virtual storage and its partitions.
Figure 2 represents the final setup of the
measurement environment. Initially, we only have
an empty space named “storage”, which is the
physical hard disk of 84 GiB. This space is initially
partitioned as described in the figure, with four
partitions of 2 GiB, 40 GiB, 10 GiB and 32 GiB
respectively. The Linux distribution we chose was
CentOS 5.5 (CentOS Project), which was installed in
the partition number 3 of 10 GiB.
After configuration, an empty file of 4 GiB was
created using the command:
dd if=/dev/zero \
of=/var/lib/xen/images/centos_1.img \
bs=4k count=1M
This file became the virtual storage of the first
Virtual Machine (VM) “centos1”. This VM was then
installed again with CentOS 5.5, partitioning its
virtual storage of 4 GiB in two partitions of 2.7 GiB
and 1.3 GiB respectively, with the operating system
installed in the first partition.
After configuring this new installation, the VM
was shut down and its configured image was
duplicated in the empty partition /dev/sda2,
started, and reconfigured as “centos2”.
Extreme care was used while configuring both
the host and guest installations, by removing all the
daemons which were not strictly required by our
tests. This way, the background noise caused by
context switching was reduced to the minimum
possible extent.
With the steps above, we created four machines:
storage, the host operating system, also called
domain 0 in the Xen parlance. This machine
should always perform best, but we will see
that in certain cases due to a double memory
buffering operated by the various layers,
particular measurements can be surprisingly
higher for the guest operating systems.
centos1, the first virtual machine with storage
virtualized from a single file on the file system
of the host
centos2, the second virtual machine which uses
a physical partition as virtualized storage
centos2lvm, similar to centos2, but placed
above a layer of LVM (Logical Volume
Manager) handled by the host operating
system.
2.5 Experiments
We wanted our experiments to return meaningful
and comparable numerical values representing the
I/O performance of each of the four machines. Each
experiment consists of writing and reading a long
series of zeroes to and from a partition, while
CLOSER 2011 - International Conference on Cloud Computing and Services Science
658
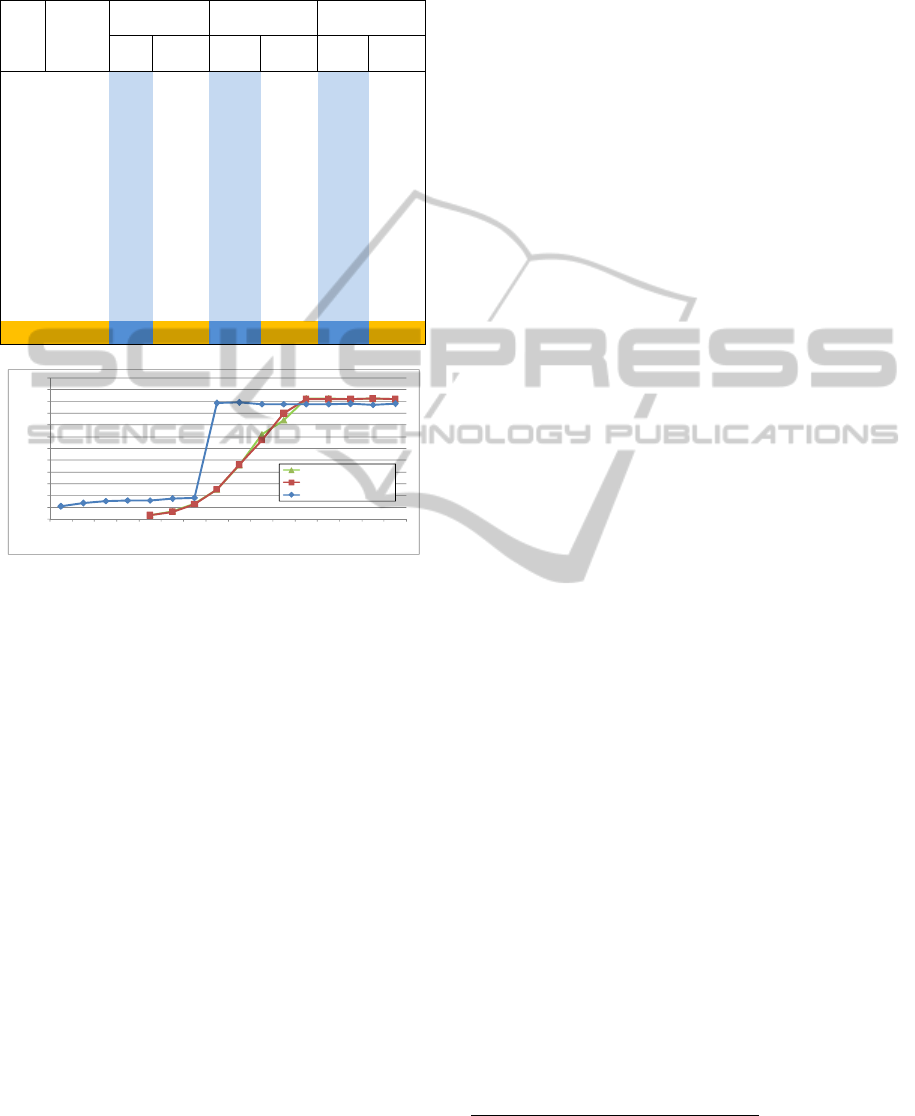
Table 1: Numerical results for read/write measurement on
native host “storage”, with and without the O_DIRECT
flag, using 1GiB of data and a variable block size.
BS(B) Count
Write1GB
Write1GBwith
O_DIRECT
Read1GBwith
O_DIRECT
Time
(s)
Speed
(MiB/s)
Time
(s)
Speed
(MiB/s)
Time
(s)
Speed
(MiB/s)
512 2097152 63,83 16,0 320,65 3,2 293,88 3,5
1ki 1048576 59,04 17,3 160,27 6,4 148,91 6,9
2ki 524288 56,82 18,0 80,25 12,8 77,58 13,2
4ki 262144 10,40 98,4 40,56 25,2 40,50 25,3
8ki 131072 10,34 99,1 22,11 46,3 22,37 45,8
16ki 65536 10,50 97,6 15,21 67,3 14,21 72,1
32ki 32768 10,47 97,8 11,40 89,8 12,21 83,9
64ki 16384 10,50 97,5 10,07 101,7 10,01 102,3
128ki 8192 10,48 97,7 10,06 101,8 10,02 102,2
256ki 4096 10,46 97,9 10,05 101,9 10,03 102,1
512ki 2048 10,54 97,2 10,02 102,2 10,01 102,3
1Mi 1024 10,45 98,0 10,07 101,7 10,02 102,2
Figure 3: Chart of the read/write measurement on native
host with fixed data size of 1GiB relatively to Table 1.
measuring the time it takes to complete the
operation.
For each experiment, three speed tests are executed:
1. A buffered write test of 1GiB of data
2. A direct write test of 1GiB of data
3. A direct read test of 1GiB of data
Each test depends on two important control
variables, the data size being transferred and the
block size used when invoking the operating
system’s primitives. Taken together, these two
variables determine a three-dimensional space. To
simplify the analysis of the results however we
considered one variable at a time, keeping the other
one constant.
Experiment 1 measured the I/O performance of
the storage machine, the native operating system. In
this experiment the data size was fixed and constant.
The values obtained in this way were then used as
terms of comparison for the values obtained in the
subsequent experiments.
To avoid incurring overheads from operating
system, caching effects, as well as general noise in
the measurements, a large enough amount of data
was used, as determined with experiment 2. In this
experiment the block size was set to a very large
fixed value and was kept constant throughout the
experiment.
The block size influences the results because the
smaller its value, the bigger the number of switches
between the user space and the kernel space is,
which incurs an important overhead especially in
virtualized machines.
3 RESULTS
3.1 Procedure
All the experiments were performed using the
command “dd”, using some basic bash
programming. Here is an example of the script for
the read test on the virtual machine:
benchmark() {
SIZE=$((1024*1024*1024*1))
BS=$1
COUNT=$(($SIZE / $BS))
echo "[+] SIZE=$SIZE BS=$BS
COUNT=$COUNT"
dd if=/dev/xvda2 of=/dev/null \
bs=$BS count=$COUNT \
iflag=direct 2>&1 | grep copied
echo
}
3.2 Experiment 1: Storage/var Block
Size
In the first experiment the data size was fixed to the
value of 1 GiB while the block size varied between
32 B
2
and 1 MiB. The same measurement was later
repeated using the O_DIRECT flag discussed
earlier. The results are reported in Table 1, and
depicted in Figure 3.
The first thing to note is that the buffered writing
(blue line) has a sharp drop below block size 4 KiB:
this is most likely explained by the heuristics used
by the operating system regarding the decision as to
when to flush the internal buffers collected with
previous I/O operations. It is best therefore to first
examine the behaviour of the direct I/O operations
(red and green lines).
Reading and writing have the same average
trend, so it does not make any difference about
which one to examine. Starting from block size of
64 KiB, the overall performance stabilizes to the
2
For the direct I/O, block sizes below 512 B were not tested
because the trend was clear, plus it was excessively slow and
of no interest for the results pursued.
0,0
10,0
20,0
30,0
40,0
50,0
60,0
70,0
80,0
90,0
100,0
110,0
120,0
32 64 128 256 512 1ki 2ki 4ki 8ki 16ki 32ki 64ki 128ki 256ki 512ki 1Mi
Speed(MiB/s)
Blocksize (B)
Read1GBwith O_DIRECT
Write1GBwith O_DIRECT
Write1GB
MEASURING I/O PERFORMANCE IN XEN PARAVIRTUALIZATION VIRTUAL MACHINES
659
value we could expect to be the hardware limit,
about 102 MiB/s. Below this block size, we observe
a progressive drop of performance, which can be
explained as the duration of the hardware I/O
operation which takes a fixed amount of time
independently of the amount of data being
transferred.
At the same time, we notice that the buffering
operation, with bigger data blocks, incurs a penalty
of about 3 MiB/s, which corresponds to about 4% of
the total bandwidth.
3.3 Experiment 2: Storage/var Data
Size
The second measurement performed on the host
machine “storage” was performed by holding the
block size to a very large value, 1 MiB and varying
the total data size. The purpose of this measurement
was to examine the point at which the result
stabilizes and the effect of CPU caches and
scheduler non-determinism is no longer dominant.
Results are reported in Table 2 and analyzed in
Figure 4.
Table 2: Results for read/write measurement on native
host “storage”, with and without the O_DIRECT flag, with
fixed block size of 1MiB and variable block size.
Size
(B)
Write1MiBblock
Write1MiBblock
withO_DIRECT
Read1MiBblock
withO_DIRECT
Time
(s)
Speed
(MiB/s)
Time
(s)
Speed
(MiB/s)
Time
(s)
Speed
(MiB/s)
1Mi 0,03 37,3 0,03 37,8 0,04 26,8
2Mi 0,03 67,7 0,03 67,8 0,02 83,5
4Mi 0,06 62,0 0,05 83,9 0,04 109,6
8Mi 0,11 73,3 0,10 79,6 0,08 106,0
16Mi 0,21 76,9 0,17 92,0 0,16 102,6
32Mi 0,42 76,4 0,34 93,5 0,30 106,4
64Mi 0,81 78,9 0,67 96,1 0,61 105,5
128Mi 1,57 81,6 1,29 98,9 1,26 101,4
256Mi 2,84 90,0 2,57 99,6 2,51 101,9
512Mi 5,44 94,1 5,08 100,8 5,01 102,2
1Gi 10,53 97,3 10,07 101,7 10,01 102,3
2Gi 20,57 99,6 20,10 101,9 20,03 102,2
4Gi 40,59 100,9 40,30 101,6 40,04 102,3
8Gi 80,92 101,2 80,44 101,8 80,13 102,2
16Gi 162,84 100,6 162,38 100,9 161,44 101,5
It is easy to notice that the noise is big with
smaller amounts of data: this is obviously the effect
of scheduling, context switches, and other
background activities occurring at the operating
system level. The obtained values tend to converge
at bigger amounts of data and the value selected for
the subsequent experiments was 1 GiB, which is a
good compromise between data size and stability of
the measurement.
Figure 4: Chart for read/write measurement on native host
with fixed block size relatively to Table 2.
3.4 Experiment 3: Centos1
After building solid frame of reference for the
expected results, it is time to proceed with
measuring the I/O performance of the
paravirtualized installations. The “centos1” VM was
freshly restarted, which is the one with the file
image storage. The file is saved on the file system of
the host OS, which is running an ext4 partition. The
measurement was executed with read/write
operations on the empty partition /dev/xvda2
using the same dd command as before, with variable
block size and fixed data size of 1 GiB. The results
are reported in Figure 5.
Figure 5: Chart for results of experiment 3, machine
“centos1”, read/write on file image based storage in
comparison with the host OS results from experiment 1.
We note that the buffered write operations reach
the maximum average speed even for small block
sizes (1 KiB), while the read/write operations with
O_DIRECT flag reach fast speed with very large
block sizes (about 1 MiB), but pay a very high
overhead price for each I/O operation.
3.5 Experiment 4: Centos2
After experiment 3, the VM “centos1” was shut
down and the VM “centos2” was started up, and the
same measurement was repeated.
0,0
10,0
20,0
30,0
40,0
50,0
60,0
70,0
80,0
90,0
100,0
110,0
120,0
1Mi 2Mi 4Mi 8Mi 16Mi 32Mi 64Mi 128Mi256Mi512Mi 1Gi 2Gi 4Gi 8Gi 16Gi
Speed(MiB/s)
Filesize (B)
Read1MiBblockwith O_DIRECT
Write1MiBblockwith O_DIRECT
Write1MiBblock
0,0
10,0
20,0
30,0
40,0
50,0
60,0
70,0
80,0
90,0
100,0
110,0
120,0
512 1ki 2ki 4ki 8ki 16ki 32ki 64ki 128ki 256ki 512ki 1Mi
Speed(MiB/s)
Block size (B)
Write1GBwith O_DIRECT
Nativ e write with O_DIRECT
Read1GBwith O_DIRECT
Nativ e write
Write1GB
CLOSER 2011 - International Conference on Cloud Computing and Services Science
660
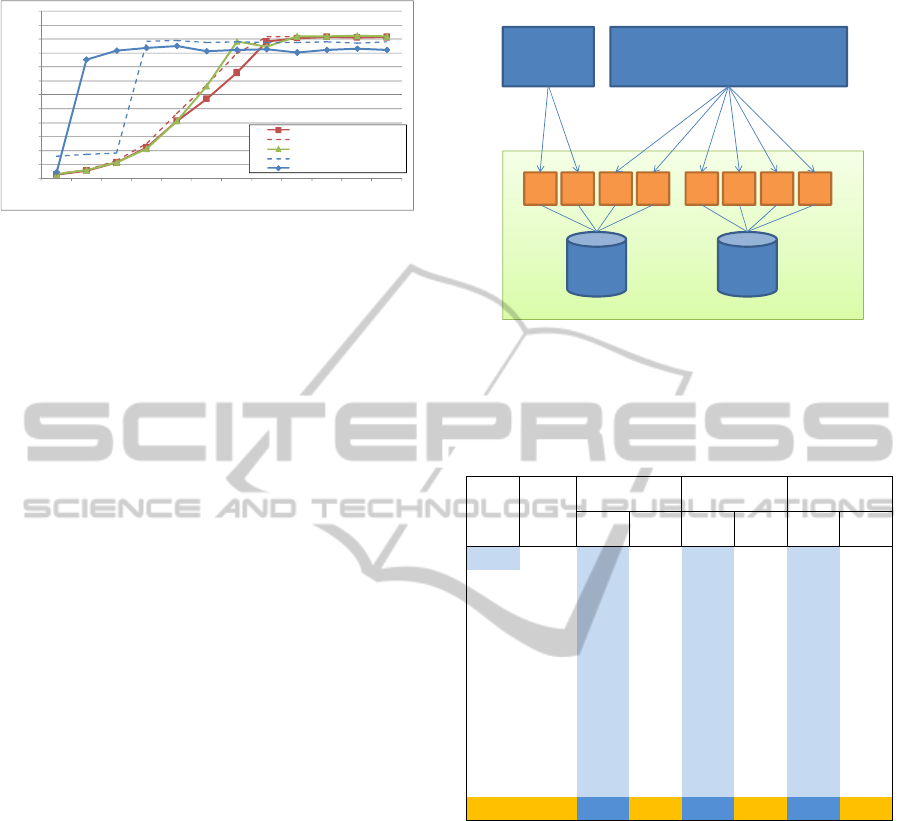
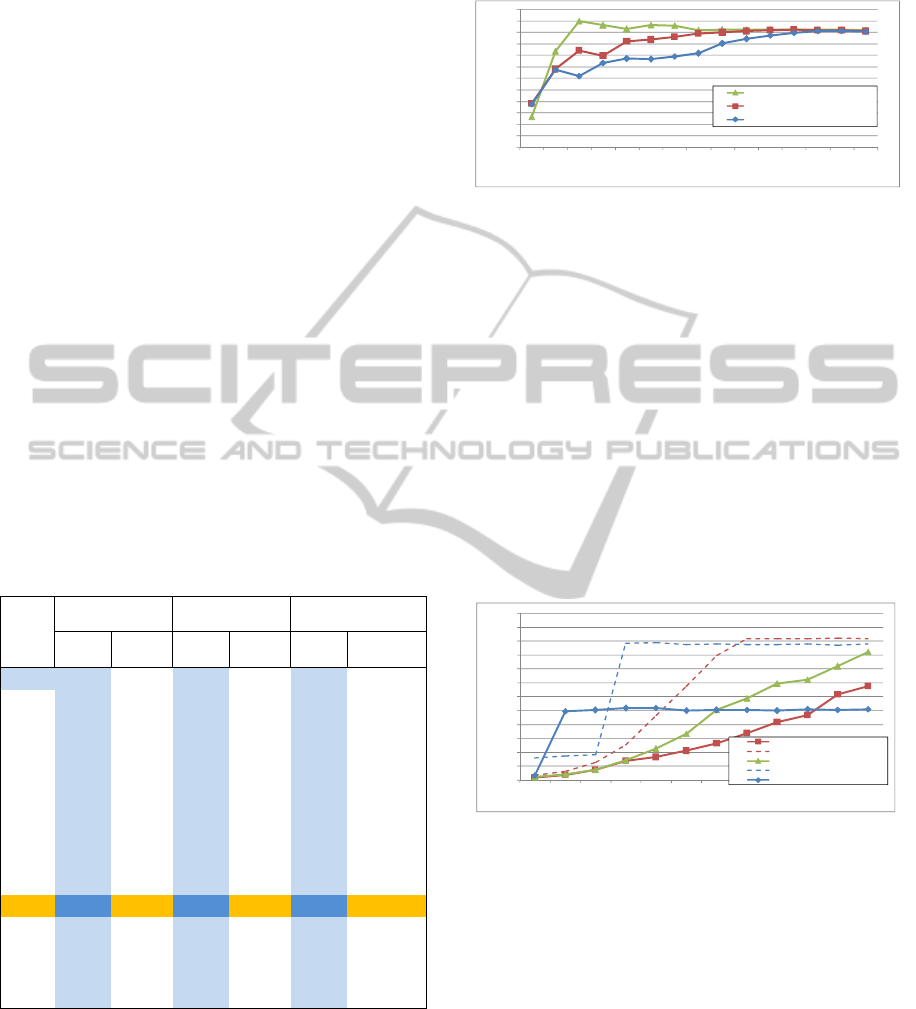
Figure 6: Chart for results of experiment 4, machine
“centos2”, read/write on native partition storage in
comparison with the host OS results from experiment 1.
These results show that once again buffered I/O has
a sharp drop at block size 1 KiB, also evident in the
chart in Figure 6. At the same time, the direct I/O
follows more or less the value trend observed for the
native transfer speeds.
Starting from a block size of 128 KiB, we get
really important information about the direct I/O
transfers (red and green lines), as they are greater
than the buffered I/O from the native operating
system (dashed blue line), and are equivalent to the
direct I/O transfer of the native operating system
(dashed red line). This suggests that there are no
observable penalties in the transfer because the
read/write commands are directly passed to the
hardware by the hypervisor after checking their
sanity.
Conversely, we see that the buffered I/O (blue
line), with the buffering happening inside the guest
operating system, pays a higher overhead penalty
because the memory-to-memory operations are more
expensive in the virtualized environment.
3.6 Experiment 5: Centos2lvm
Due to the difficulties with managing native
partitions, we turned our attention to the overhead
caused by the addition of a partition abstraction
layer, called Logical Volume Manager (Vanel and
Knaap, 2000). LVM makes it possible to
dynamically create and delete partitions without the
need for rebooting the host machine. The general
idea is depicted in Figure 7.
Table 3 reports the result of the same
measurements for the “centos2lvm” VM, and shows
that the introduction of this additional layer does not
change the overall transfer speeds.
3.7 Final Comparison
We can now compare the results we obtained for the
four machines “storage”, the native and host
machine, “centos1” virtual machine with its file
Figure 7: Generic schema of the Logical Volume Manager
functionality.
Table 3: Results for read/write speed measure on LVM
based storage virtualization with variable block size and
fixed total size of 1 GiB.
BS(B) Count
Write1GB
Write1GBwith
O_DIRECT
Read1GBwith
O_DIRECT
Time(s)
Speed
(MiB/s)
Time(s)
Speed
(MiB/s)
Time(s)
Speed
(MiB/s)
512 2097152 228,97 4,5 365,80 2,8 341,70 3,0
1ki 1048576 11,45 89,4 182,75 5,6 175,34 5,8
2ki 524288 11,14 91,9 96,25 10,6 88,54 11,6
4ki 262144 11,08 92,4 46,86 21,9 48,16 21,3
8ki 131072 11,24 91,1 24,88 41,2 24,69 41,5
16ki 65536 11,29 90,7 18,06 56,7 15,39 66,5
32ki 32768 11,25 91,0 13,38 76,5 10,53 97,2
64ki 16384 11,24 91,1 10,37 98,8 10,12 101,2
128ki 8192 11,12 92,1 10,12 101,2 10,04 102,0
256ki 4096 11,23 91,2 10,05 101,8 10,04 102,0
512ki 2048 11,32 90,4 10,15 100,9 10,04 102,0
1Mi 1024 11,19 91,5 10,19 100,5 10,03 102,1
image based storage, and “centos2” virtual machine
both in the native partition version and the LVM
partition one.
Figure 8 shows an overall view of the
performance obtained with each particular setup,
while Figure 9 and Figure 10 show in detail the
compared results. From this comparison, it is
apparent that the overhead introduced by the use of
LVM is negligible, while the overhead introduced
by using a file stored in the host file system, like in
VM “centos1”, is very significant. The reason is that
LVM is implemented as a low-level kernel routine,
while file systems (in Unix-like operating systems)
are implemented as a kernel-level process, which
requires context switching to perform its indexing
and writing operations for each write request
received.
0,0
10,0
20,0
30,0
40,0
50,0
60,0
70,0
80,0
90,0
100,0
110,0
120,0
512 1ki 2ki 4ki 8ki 16ki 32ki 64ki 128ki 256ki 512ki 1Mi
Speed(MiB/s)
Block size (B)
Write1GBwith O_DIRECT
Nativewr ite with O_DIRECT
Read1GBwith O_DIRECT
Nativewr ite
Write1GB
HD HD
PE PE PE PE PE PE PE PE
VolumeGroup
Logical
Volume1
Logical
Volume2
MEASURING I/O PERFORMANCE IN XEN PARAVIRTUALIZATION VIRTUAL MACHINES
661
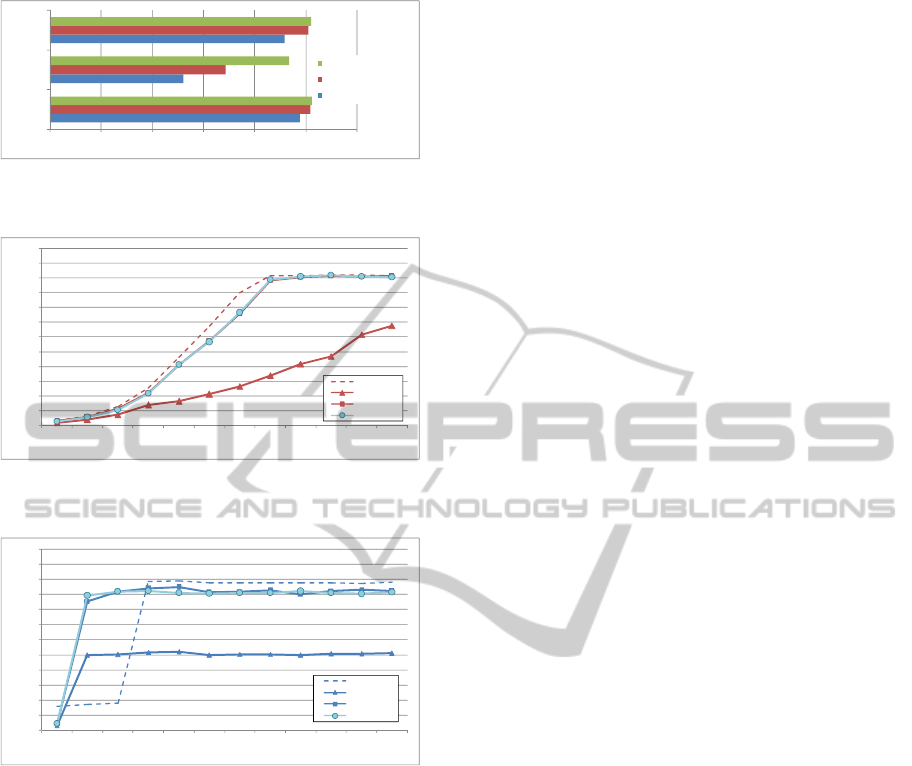
Figure 8: Overall view of the I/O performance of the three
machines for buffered and direct read/write speed tests.
Figure 9: Final comparison of the direct I/O write test with
variable block size and fixed data size of 1 GiB.
Figure 10: Final comparison of the buffered I/O write test
with variable block size and fixed data size of 1 GiB.
4 CONCLUSIONS
The performance difference observed between a VM
configured to use a native partition storage and the
VM using a file image storage shows beyond any
doubt that the right way to implement storage
virtualization is the native partition.
From the administrator point of view using
native partitions is penalizing due to the intrinsic
inflexibility of native partitions. Using file images
allows easier operations such as move, backup, and
share over the network of the images.
We have seen that the introduction of LVM does
not add any significant overhead to the eventual
performance, but gives some more flexibility to the
management, which represents an ideal compromise.
Our next step is to investigate and evaluate ways
to export LVM capabilities through a local area
network, while incurring as low overheads as
possible. Possible solutions include remote storage
protocols such as iSCSI, InfiniBand/iSER, NFS.
ACKNOWLEDGEMENTS
Special thanks to Roberto Tecchio for the technical
insight and advice, and to InfoNet Solutions SRL for
providing the hardware used throughout the
experiments.
REFERENCES
Barham, P., et al. Xen and the Art of Virtualization.
Cambridge: University of Cambridge, 2003.
Adams, K. e Agesen, O. s.l.: A comparison of software
and hardware techniques for x86 virtualization.
Proceedings of the Conference on Architectural
Support for Programming Languages and Operating
Systems, 2006.
Mattmann, C. A. Experiments with Storage and
Preservation of NASA's Planetary Data via the Cloud.
computer.org. September/October, 2010.
Menon, A., et al. Palo Alto: Diagnosing Performance
Overheads in the Xen Virtual Machine Environment.
HP Laboratories, 2005. HPL-2005-80.
Chambliss, D. D., et al. s.l.: Performance virtualization for
large-scale storage systems. Proceedings of the 22nd
International Symposium on Reliable Distributed
Systems, 2003. 1060-9857/03.
Intel Virtualization Technology for Directed I/O
Architecture Specification. [Online] 2006.
ftp://download.intel.com/technology/computing/vptec
h/Intel%28r%29_VT_for_Direct_IO.pdf.
Huang, W., et al. InfiniBand Support in Xen Virtual
Machine Environment. Columbus: The Ohio State
University, 2005. OSU-CISRC-10/05-TR63.
Arcangeli, A. O_DIRECT. UKUUG Manchester. [Online]
July 2001. http://www.ukuug.org/events/linux2001/
papers/html/AArcangeli-o_direct.html.
The Community ENTerprise Operating System. [Online]
CentOS Project. http://www.centos.org/.
Vanel, L. e Knaap, R. AIX Logical Volume Manager, from
A to Z: Introduction and Concepts. s.l.: IBM
Redbooks, 2000. SG24-5432-00.
0 20406080100120
native
centos1
file
centos2
partition
read1GBBS=1Mdirect
write 1GB BS=1Mdirect
write 1GB BS=1M
0,0
10,0
20,0
30,0
40,0
50,0
60,0
70,0
80,0
90,0
100,0
110,0
120,0
512 1ki 2ki 4ki 8ki 16ki 32ki 64ki 128ki 256ki 512ki 1Mi
Speed(MiB/s)
Block size (B)
storage
centos1
centos2
centos2lvm
0,0
10,0
20,0
30,0
40,0
50,0
60,0
70,0
80,0
90,0
100,0
110,0
120,0
123456789101112
Speed(MiB/s)
Block size (B)
storage
centos1
centos2
centos2lvm
CLOSER 2011 - International Conference on Cloud Computing and Services Science
662
