
EXECUTION MEASUREMENT-DRIVEN CONTINUOUS
IMPROVEMENT OF BUSINESS PROCESSES
IMPLEMENTED BY SERVICES
Andrea Delgado
Computer Science Institute, Faculty of Engineering, University of the Republica, Montevideo, Uruguay
Barbara Weber
Computer Science Institute, Quality Engineering Research Group, University of Innsbruck, Innsbruck, Austria
Francisco Ruiz, Ignacio García-Rodríguez de Guzmán
Alarcos Research Group, Technologies and IS Department, University of Castilla-La Mancha, Ciudad Real, Spain
Keywords: Business Process Management (BPM), Service Oriented Computing (SOC), Business process execution
measures, Continuous business process improvement.
Abstract: Continuous improvement of business processes is becoming increasingly important for organizations that
need to maintain and improve their business in the current context, and to that end the continuous
incorporation of changes to improve it is a key issue. However, an organization that has not defined how to
measure and analyze the execution of its business processes is unlikely to have real and reliable information
to introduce these changes. Nor will it easily achieve the goals set for the improvement effort that has been
set out. MINERVA framework provides a comprehensive guide for the continuous improvement of business
processes implemented by services and following principles of model driven development. Among other
elements it defines a Business Process Continuous Improvement Process (BPCIP) and a Business Process
Execution Measurement Model (BPEMM). In this paper we present the BPCIP and the BPEMM to first
identify the business goals defined for business processes; second, to select the appropriate execution
measures to be implemented and collect the associated execution information; third, to analyze and evaluate
this information, identifying improvement opportunities, and fourth, to integrate these improvements into
business processes in a systematic way to achieve the specific improvement results.
1 INTRODUCTION
The Business Process Management (BPM) (Weske,
2007) (van der Aalst et al., 2003) (Smith et al, 2003)
paradigm is being used increasingly in organizations
to manage their business. The explicit modelling of
business processes (i.e. using BPMN (OMG,2008a))
together with information regarding its execution
constitute the main elements with which to compare
the functioning of the organization as it moves
towards achieving its business goals. The
measurement of their business process execution is a
key issue to be able to analyze its operation to see if
business goals are being achieved. If they are not,
the idea is to find improvement opportunities that
would modify the business process so that it could
reach the goals defined.
MINERVA framework (Delgado et.al, 2009b)
(Delgado et. al, 2010c) provides support for the
business process lifecycle (Weske, 2007) and its
continuous improvement, implementing them with
services (Papazoglou et al, 2007) using model driven
development (Mellor et. al, 2003). It is made up of
three dimensions: conceptual (Delgado et.al, 2010a),
methodological (Delgado et.al, 2009a) (Delgado
et.al, 2010d) and tools (Delgado et.al, 2010b). It
thereby integrates concepts, models, methodologies
and processes for both development and
improvement, and tools. In this article we extend the
definition of MINERVA describing the Business
48
Delgado A., Weber B., Ruiz F. and García Rodríguez de Guzmán I..
EXECUTION MEASUREMENT-DRIVEN CONTINUOUS IMPROVEMENT OF BUSINESS PROCESSES IMPLEMENTED BY SERVICES.
DOI: 10.5220/0003428300480059
In Proceedings of the 6th International Conference on Evaluation of Novel Approaches to Software Engineering (ENASE-2011), pages 48-59
ISBN: 978-989-8425-57-7
Copyright
c
2011 SCITEPRESS (Science and Technology Publications, Lda.)
Process Continuous Improvement Process (BPCIP)
for guiding the improvement effort and the Business
Process Execution Measurement Model (BPEMM)
to guide the selection, implementation, collection,
analysis and evaluation of execution measures for
Business Process (BP) implemented by services.
The rest of the article is organized as follows: in
Section 2 the BPCIP is presented detailing its phases
and activities. Section 3 describes the BPEMM
along with an example of its use. Section 4 sets out
related work and finally in Section 5 conclusions
and future work are discussed.
2 BP CONTINUOUS
IMPROVEMENT PROCESS
The Business Process Continuous Improvement
Process (BPCIP) is defined in the methodological
dimension of MINERVA, and its main objective is
to guide the improvement effort in the organization.
It integrates the phases of the business process
lifecycle in (Weske, 2007) and those from the
continuous improvement process
PmCOMPETISOFT
in (Pino et.al, 2009). The measures defined in the
Business Process Execution Measurement Model
(BPEMM) are used to relate the BP execution to the
organization’s business goals explicitly, as well as to
implement, register and asses the associated data. In
Section 3 BPEMM will be described in detail.
A complete execution cycle through the
MINERVA framework begins with modeling a new
BP or redesigning an existing one in BPMN, whose
execution is then measured and evaluated, aiming to
identify improvement opportunities. BPMN was
selected for many reasons mainly as it is an OMG
standard widely adopted and MINERVA is a
standardized framework. These improvements can
then be fed back into the business process following
a systematic approach based on the continuous
improvement process defined. Finally, the measures
of the new version of the business process
comprising the improvements made are compared
with the previous version, to evaluate the results of
the changes carried out. The general framework of
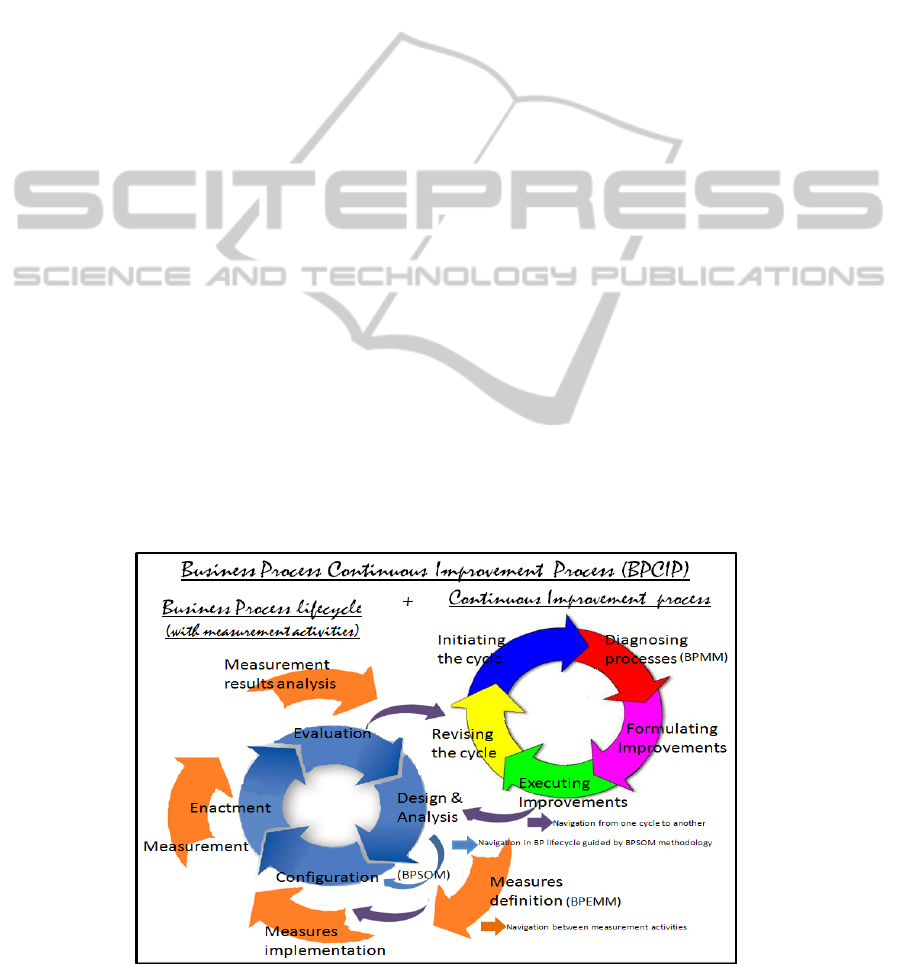
BPCIP is shown in Figure 1.
On the left side of Figure 1 the business process
lifecycle (bottom left circle) defines four phases:
Design & Analysis, Configuration, Enactment and
Evaluation. For each of these phases we show
explicitly the corresponding measurement activities
in which the BPEMM is used (outer four arrowed
circle). In addition, the arrow from
Design&Analysis to Configuration indicates the use
of the Business Process Service Oriented
Methodology (BPSOM) to guide the implementation
of business processes with services. On the right side
the continuous improvement process (upper right
circle) defines five phases: Initiating the cycle,
Diagnosing processes, Formulating improvements,
Executing improvements and Revising the cycle.
Three arrows indicate the navigation from one cycle
to another: from the Executing improvements phase
of the improvement process to the Design &Analysis
or the Configuration phases to re-enter BP lifecycle,
and from the Evaluation phase to the Revising the
cycle phase to return to the improvement process.
Figure 1: MINERVA Business Process Continuous Improvement Process (BPCIP).
EXECUTION MEASUREMENT-DRIVEN CONTINUOUS IMPROVEMENT OF BUSINESS PROCESSES
IMPLEMENTED BY SERVICES
49

2.1 Process Phases and Activities
This section sets out the particular phases and the
activities in executing a complete BPCIP cycle of
MINERVA framework, as shown in Figure 1.
2.1.1 Design & Analysis
The cycle begins with the design and specification
of a business process by means of BPMN models as
part of the Design & Analysis phase. These models
are then validated through simulation or analytical
techniques to determine their relevance to the
specified business goals, or to evaluate different
design options for it. Moreover, to asses quality
characteristics of the model created (i.e.,
complexity) as well as to detect potential problems
in early stages, design measures not presented here
can be used (Rolón et. al, 2006) (Cardoso, 2006)
(Mendling, 2008) (Sánchez González et. al, 2010).
Finally, the BPEMM of MINERVA is used to select
execution measures according both with the business
objectives defined for the BP and the business
strategy of the organization.
Figure 2: Main activities in Design&Analysis phase.
2.1.2 Configuration
In the Configuration phase the BPs are implemented
by services with model driven development, guided
by the BPSOM methodology (Delgado et.al, 2009a).
BPSOM defines the disciplines Business Modeling,
Services Design and Implementation with activities,
input and output deliverables, and roles needed to
carry out the service development starting from the
BP that has been defined. In addition, QVT (OMG,
2008b) transformations are defined and executed to
generate SoaML (OMG, 2009) service models from
BPMN models. This phase is also concerned with
the implementation of the execution measures
selected to be integrated directly into the process
engine or into software systems, in the form of
execution logs to register the information needed.
Figure 3: Main activities in Configuration phase.
2.1.3 Enactment
In the Enactment phase the BPs are executed in an
appropriate process engine according to their
implementation (BPEL/XPDL), from which to
invoke the services realizing BP activities, sub-
process or even the complete BP. The execution
measures defined and implemented are collected as
BP cases (instances) are executed, registering the
events and information needed for the execution
measures to be calculated later.
Figure 4: Main activities in Enactment phase.
2.1.4 Evaluation
The BP execution is then assessed in the Evaluation
phase analyzing the measurement results. For this to
be done, the execution measures are calculated on
the basis of the information registered in the
execution logs using the Process Mining (van der
Aalst et al, 2007) framework ProM (ProM). By
means of several plug-ins ProM allows different
views of the associated information to be analyzed.
Using the analysis performed it is possible to
identify improvement opportunities for redesigning
the BP, which can be related to the BP modelling
level as well as to the software realizing the BP
(implemented services), such as bottlenecks in the
BP or service execution delays. For the redesign of
the BP several existing approaches can be used
(Reijers, 2003) (Maruster, 2009) (Netjes, 2010).
Figure 5: Main activities in Evaluation phase.
2.1.5 Initiating the Cycle
Once the improvement opportunities have been
identified, the continuous improvement process to
carry out the improvement effort is undertaken,
executing the corresponding phases. This implies the
introduction of the improvements in a systematic
way in order to assure the achievement of the results
specified for the improvement of some or several BP
characteristics. In the Initiating the cycle phase the
improvements to be included in this iteration are
established, including the BPs and the characteristics
to be improved, as well as the results expected after
the introduction of the improvements that have been
defined. This can also lead to a revision of the
execution measures chosen.
Validate
themodel
ModelingBP
withBPMN
Select
execution
measures
Design&
Analysis
Implement
measures
collection
ImplementBP
withservicesusing
BPSOM
(SOC,MDD)
Configuration
Collect
execution
measures
ExecuteBP
(processengine
+services)
Enactment
Analyze
measurement
results
Calculate
execution
measures
Identify
Improvement
opportunities
Evaluation
ENASE 2011 - 6th International Conference on Evaluation of Novel Software Approaches to Software Engineering
50
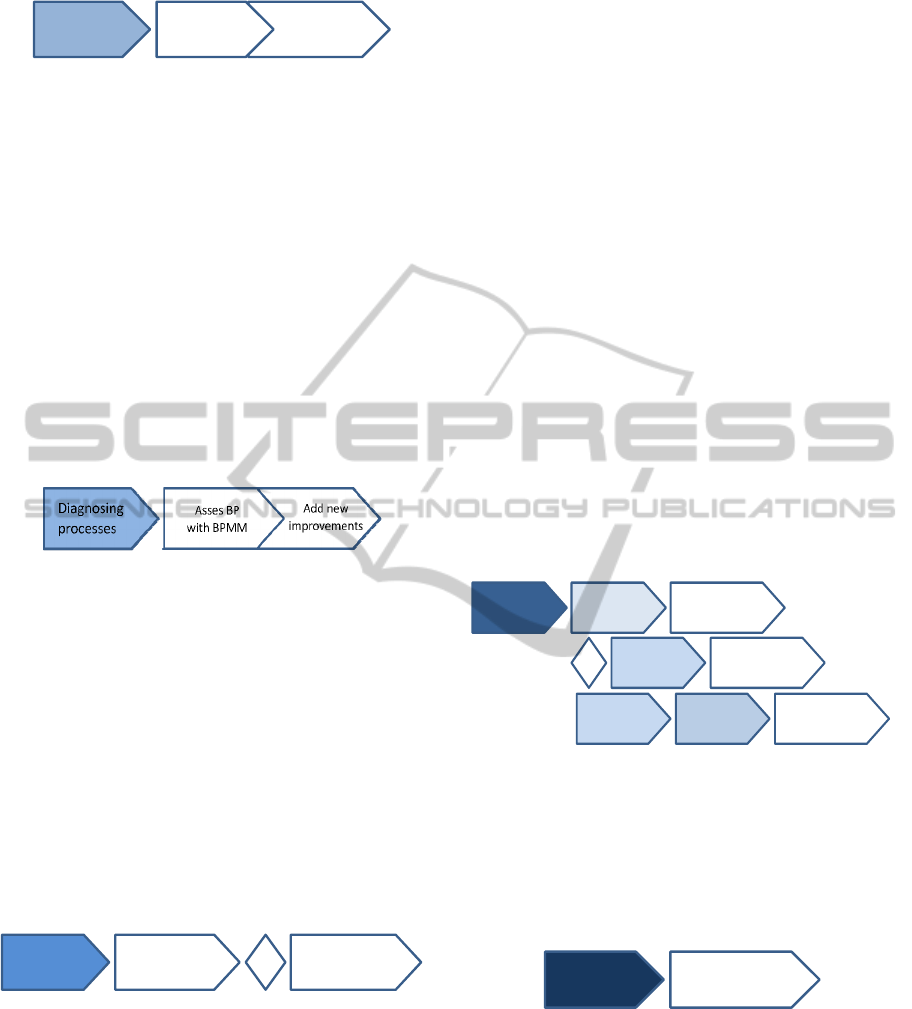
Figure 6: Main activities in Initiating the cycle.
2.1.6 Diagnosing Processes
In the Diagnosing processes phase other aspects of
the BP definition (i.e., management) can be assessed
using the OMG Business Process Maturity Model
(BPMM) (OMG, 2008c). This standard which
follows the format defined by the software maturity
models (CMM, CMMI) includes several Process
Areas and defined Key Activities that when
performed, allows the BP to gain maturity by
evolving through the model’s five maturity levels.
Based on this diagnosis new improvement
opportunities for the BP can be found, which can be
included in this iteration. For a description of the
BPMM and BP measuring activities we refer the
reader to (Sanchez González et al, 2009).
Figure 7: Main activities in Diagnosing processes.
2.1.7 Formulating Improvements
The Formulating improvements phase aims to define
how (by doing what) the selected improvements for
this iteration will be introduced. To do so, the
changes have to be defined specifically, i.e., if an
activity in a BP has been identified as a bottleneck
and its execution time should be improved, it could
be specified that for this activity several redesigns
must be evaluated to obtain better results. The same
applies if the problem detected involves the
execution of services which realizes the BP. In any
case, the improvement to be made will be set out in
detail in the associated improvement document.
Figure 8: Main activities in Formulating improvements.
2.1.8 Executing Improvements
In the Executing improvements phase the BP
lifecycle is re-entered exactly where the
improvements have to be made. If the improvement
refers to the BP model then the lifecycle is re-
entered in the Design & Analysis phase, where parts
of the BP model or its entirety will be redesigned to
introduce the improvements. Afterwards the whole
BP lifecycle will again be executed with the new
version of the BP. The existing traceability between
the BPMN BP models and its implementation with
services, will allow the identification of the impact
of the changes in related services and/or other
software artefacts in the Configuration phase.
On the other hand, improvement might only
refer to the implementation of the BP (i.e., the BP
model will not be changed but only the software
realizing the BP). In that case the BP lifecycle will
be re-entered in the Configuration phase, to
implement changes in the services. Once the BP
model and/or the services realizing it are modified,
along with the implementation of the execution
measures to be collected for the new version of the
BP, this new version of the BP is executed
registering the associated data in the specific
execution logs. Finally, the defined activities are
executed in the Evaluation phase, along with a
comparison between measurement results from the
new version of the BP and the previous version used
as the basis for improvements. This comparison will
also allow assessing if the goals set out for the
improvement that has been brought in have been
achieved.
Figure 9: Main activities in Executing improvements.
2.1.9 Revising the Cycle
In the Revising the cycle phase the data registered
about the execution of the continuous improvement
process itself is analyzed, to identify improvement
opportunities in the improvement process also.
Figure 10: Main activities in Revising the cycle.
3 BP EXECUTION
MEASUREMENT MODEL
Measurement of BP execution to analyze the
achievement of business goals as well as to detect
improvement opportunities is a key aspect in
Reviewexecution
measures
selection
Define
improvements
forthecycle
Initiating
thecycle
Formulating
improvements
Modifypart
ofthemodel(orall)
Modifypart
oftheservice(orall)
Executing
improvements
Redesignpartofthe
model(orall)
Design&
Analysis
Configuration
Reimplementpartof
theservice(orall)
Compareexecution
ofnewversionwith
previousversion
EvaluationEnactment
Revising
thecycle
Assesdevelopment of
improvementcycle
EXECUTION MEASUREMENT-DRIVEN CONTINUOUS IMPROVEMENT OF BUSINESS PROCESSES
IMPLEMENTED BY SERVICES
51
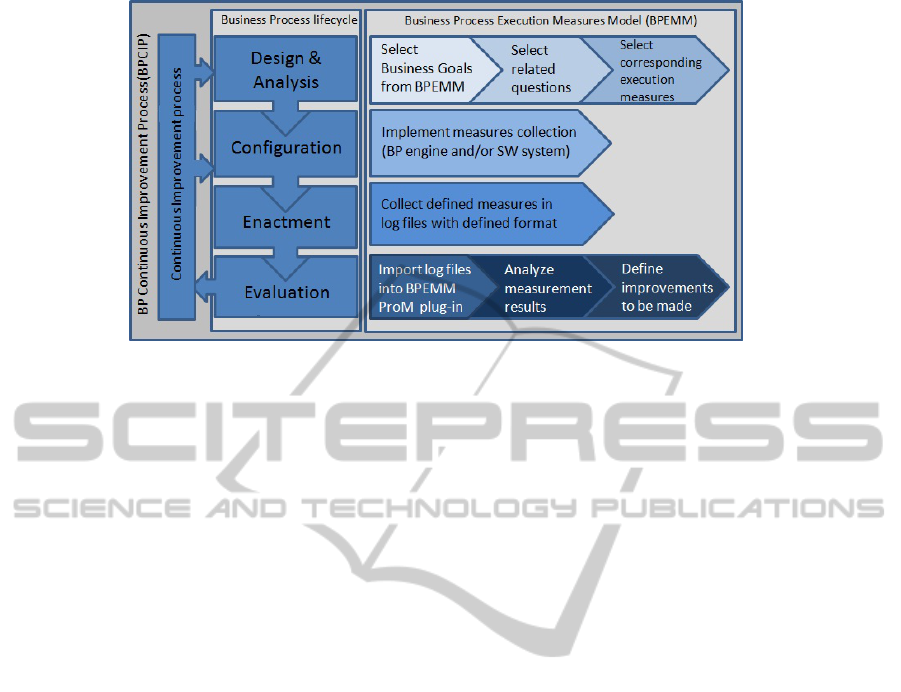
Figure 11: Detailed measurement activities from BPEMM and its use in the BPCIP context.
MINERVA framework. Although the execution
measurement activities are not new, it is the
BPEMM model proposal. Its goal is to define a set
of pre-defined measures for BP execution based on
services, to support the improvement effort, relating
business goals for the BP to its real execution, and
helping in finding improvement opportunities. In
Figure 11 the relation between BPCIP and BPEMM
is shown, along with the BPEMM activities.
3.1 BPEMM Definition
BPEMM aims to help in relating business strategy
and goals to business process implementation and
execution, thus facilitating the selection of
predefined execution measures for each business
goal. BPEMM definition focuses on organizations
which implement their BPs with services, proposing
a set of execution measures from three defined
views: generic BP execution (i.e., generic and
domain specific measures for domains such as
medical, software, production), focus on lean
philosophy (e.g., eliminating waste and encouraging
optimization), and services execution (i.e., for
execution of services realizing the BP). These views
were defined to cover as much information as
possible to be able to get accurate knowledge from
the execution logs of the BP, and then focus BP
improvements on the specific parts of the BP. In
addition to the views the dimensions defined by the
“Devil’s quadrant” (Brand&Van der Kolk, 1995)
(Reijers; 2003): time, cost, flexibility and quality,
were taken into account. These dimensions refer to
the trade-off that has to be taken into account when
designing or redesigning a BP. For example, adding
activities to improve the quality of the BP can have a
negative impact on its performance. It is therefore
important to collect information on the BP execution
for each dimension, to analyze the improvements.
For the definition of the execution measures of
the model, we used the Goal, Question, Metrics
(GQM) paradigm (Basili, 1992) which is based on
the idea that an organization must first specify its
goals if it is to measure in a meaningful way what
the organization does. It provides a systematic
approach to establish and asses a set of operational
goals based on measurement. It integrates goals with
process models, products, resources and different
perspectives, depending on the needs of the
organization and project. Initially defined to evaluate
defects in software projects, its use has been
expanded to improvement efforts in software
organizations. As our proposal includes a continuous
improvement process that also comes from the
software area, the use of GQM to define BPEMM is
set in the same direction. BPEMM measures are then
defined by three main elements:
• Goal: it is defined for the organization, section,
project or process, from various points of view with
respect to different models.
• Question: it is used to describe how each goal
will be evaluated from the point of view of a quality
characteristic.
• Metric: a set of data associated with each
question to be answered quantitatively. Measures
can be objective or subjective.
For the specification of BPEMM execution
measures we use the Software Measurement
Ontology (SMO) (García et al, 2005). The SMO
defines, among other concepts, different types of
measures: base and derived measures and indicators,
which are calculated by a measurement approach. In
addition to the specification of GQM elements for
each view and dimension in natural language, we
ENASE 2011 - 6th International Conference on Evaluation of Novel Software Approaches to Software Engineering
52

model the execution measures and associated
concepts in a graphical way. To do that, we use the
SMTool (Mora et al, 2008) which implements SMO.
It provides a quick overview of the measures set out
to satisfy the information needs of the organization,
helping in the communication with stakeholders.
3.1.1 Views, Dimensions and Measures
The execution measures views defined in BPEMM
allow the measures to be organized according to
three relevant perspectives. In the first view defined,
i.e., generic BP execution, the measures are related
to BP characteristics that are common to all
processes regardless of the associated domain, such
as their duration or the duration of their activities,
the associated cost, the roles involved, etc. However,
some of these generic measures have to be
instantiated for the BP domain, for example when
they involve label definitions such as “successful
branch”, where activities comprising the branch
have to be identified for each BP. Generally, these
kinds of measures are specified as Key Performance
Indicators (KPIs) by the business management area.
The “Devils quadrant” dimensions are used to
group these measures. The definition of measures
for a BP is also defined in a three-level hierarchy. At
the third level measures for the execution of each
activity are registered. At the second level these
measures are combined to calculate the BP case
measures. Finally, in the first level case measures
are combined to calculate the measures for the BP
definition (e.g., averages, percentages, etc.).
We present as an example of this view of BPEMM,
some execution measures defined in the Time
dimension related to the BP performance, i.e., its
Throughput Time (TT) or Cycle Time. This is
defined, for a BP case (instance) as the total time
incurred from the moment in which the case is
initiated until it is completed (Reijers, 2003; Laguna
et al, 2005). Several different times are defined to
calculate time measures such as: enable, start,
change, suspension, queue, processing (or working),
service, setup, waiting and completion time, for
activities and cases (Reijers, 2003) (zur Muehlen,
2004) (Laguna et al, 2005) (Netjes, 2010). From
these we used as base measures for an activity, the
enabled time (i.e., when an activity becomes
available for execution), start time (i.e., when it
actually starts its execution) and completion time
(i.e., when an activity completes its execution).
Based on these the derived measures and indicators
are calculated as shown in Table 1. The explanation
of the basic concepts about time measures defined
for an activity and a BP case is shown in Figure 12.
In addition to throughput time (TT), the generic
execution measures view defines other measures for
this and the rest of the dimensions of the Devil’s
quadrangle, which are not presented here.
As can be seen in Table 1 measures have been
defined for the Goal “Minimize the TT of the BP” at
three different levels: activity, BP case and set of all
BP cases. By analyzing the measurement
Table 1: Generic BP execution view, time dimension measures sub-set.
Goal Purpose
Issue
Object
Minimize
the throughput time (TT) of
the BP
Question Q1 which is the actual throughput time of the BP
Metrics M1 (base)
M2 (base)
M3 (base)
M4 (derived)
M5 (derived)
M6 (derived)
M7 (derived)
M8 (derived)
M9 (indicator)
M10 (indicator)
M11 (indicator)
M12 (indicator)
M13 (indicator)
M14 (indicator)
M15 (indicator)
Enabled time of an Activity (ET)
Start time of an Activity (ST)
Completion time of an Activity (CT)
Working time of an Activity (AWoT = CT – ST)
Waiting time of an Activity (AWaT = ST – ET)
Total Working time of a BP case (TWoT = ∑ (AWoT))
Total Waiting time of a BP case (TWaT = ∑ (AWaT)
Throughput Time of a BP case (BPTT = TWoT + TWaT)
Activity Working time vs. Activity Waiting time index (ATI = AWaT/AWoT)
Decision criteria = Index DC: R1: 0 <= TTI <= L1 = "LOW" Æ GREEN;
R2: L1 <= TTI < L2= "MEDIUM" Æ YELLOW; R3: L2 <= TTI = "HIGH" Æ RED
Total BP Working time vs. Total BP Waiting time index (TTI =TWaT/TWoT)
Decision criteria = Index DC.
Percentage of total BP Working time in total BP TT (PWoT = TWoT*100/BPTT)
Decision criteria = Percentage DC: R1: 0 <= TTI <L1 = "LOW" Æ RED;
R2:L1<=TTI< L2="MEDIUM"ÆYELLOW; R3:L2 <= TTI<=100="HIGH"ÆGREEN
Percentage of Total BP Waiting time in Total BP TT (PWaT = TWaT*100/BPTT)
Decision criteria = Inverse Percentage DC (GREEN, YELLOW, RED)
Average BP Throughput Time for all BP cases (ABPTT = ∑ BPTT / Total BP cases)
Decision criteria = Inverse Percentage DC (GREEN, YELLOW, RED)
Average BP total Working time for all BP cases (ABPTWoT = ∑TWoT/Total BP cases)
Decision criteria = Percentage DC
Average BP total Waiting time for all BP cases (ABPTWaT = ∑ TWaT /Total BP cases)
Decision criteria = Inverse Percentage DC (GREEN, YELLOW, RED)
EXECUTION MEASUREMENT-DRIVEN CONTINUOUS IMPROVEMENT OF BUSINESS PROCESSES
IMPLEMENTED BY SERVICES
53
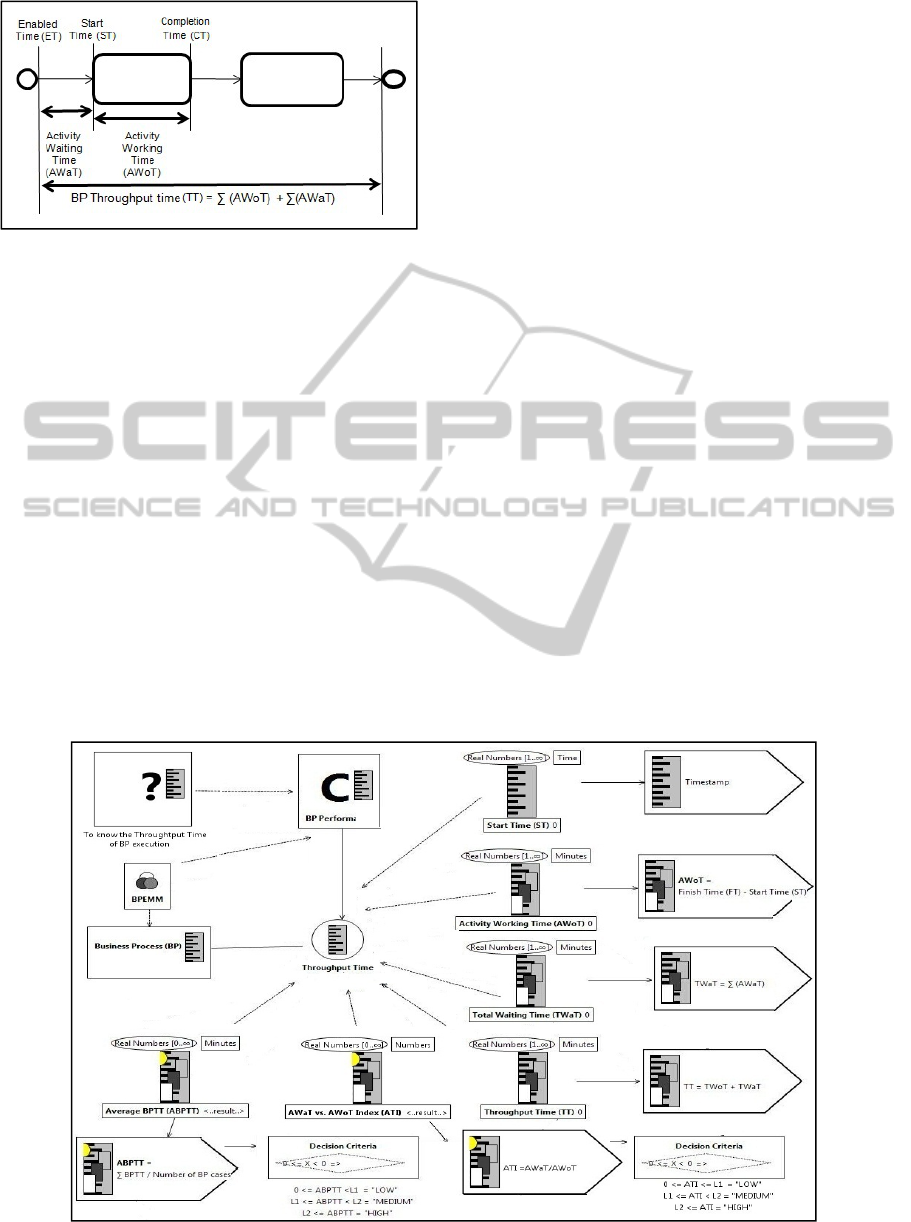
Figure 12: Time concepts definition for BP execution.
results for each level, improvement opportunities
can be detected from global BP execution measures
(i.e., average, percentage) to the corresponding
activities or BP parts that have to be changed to
improve the TT of the BP. For indicators decision
criteria have to be defined, i.e., the different ranks to
which the measurement result can belong. To define
the ranks we use labels that have to be changed to
actual numbers for each BP and organization when
selecting the execution measures (e.g. 0 <=
Measurement result <= L1). This allows the ranks to
be flexible enough to be used in different contexts
using different numbers instead of the labels.
Associated with the meaning of the ranks
defined, we also use semaphores as supported in
ProM. The semaphores show the meaning of the
ranks by means of colors, where Green means
“OK”, Yellow means “Warning” and Red means
“Problems”. In Figure 13 some of the measures
presented in Table 1 are shown graphically using the
SMTool, which provides special icons for each
concept defined in the SMO, its attributes,
associations and restrictions defined between the
ontology elements (i.e., rule for base measure, rule
with figures for derived measures, rule with figures
and lamp for indicators, among others).
Other goals defined in the Generic BP execution
view are, among others: “Minimize the cost of the
BP” and “Minimize the use of resources for the BP”
both of which correspond to the cost dimension,
“Maximize the BP cases ending normally” (i.e.,
normal completion of the instance, successful or
unsuccessful, with no abortion due to errors or user
cancellation) corresponding to the quality
dimension, and “Maximize the BP cases ending
successfully” (i.e., executing the successful branch
of the BP involving the execution of defined
activities, such as making and paying for the
reservation of flight, room and others in a travel
agency BP) corresponding to a domain specific
execution measure. Table 2 shows an example of
execution measures to be instantiated for domains.
The second BP execution view defined focuses
on the Lean thinking philosophy, aiming to find
elements in the BP that could be unnecessary or
replaceable, or parts of the BP that if made as
efficient as possible can lead to an optimization and
improvement of the complete BP definition (Laguna
et. al, 2005). Lean thinking was first introduced in
the Toyota Production System (TPS) and
Figure 13: Some measures from Table 1 shown graphically in the SMTool (Mora et. al, 2008).
ENASE 2011 - 6th International Conference on Evaluation of Novel Software Approaches to Software Engineering
54

Table 2: Generic BP execution view, domain specific measures sub-set.
Goal Purpose
Issue
Object
Maximize
the BP cases ending successfully (executing the successful branch of BP) of
the BP
Question Q1 which is the actual number of BP cases ending successfully
Metrics M1 (base)
M2 (base)
M3 (derived)
M4 (derived)
M5 (indicator)
Successful branch execution of a BP case (SB = branch with execution of activity X)
Unsuccessful branch execution of a BP case (USB = branch with execution of activity Y)
Number of BP cases ending successfully (BPSB = count of SB)
Number of BP cases ending unsuccessfully (BPUSB = count of USB)
Percentage of BP ending successfully in total BP cases (PBPSB = BPSB*100/TCBP)
Decision criteria = Percentage DC: R1: 0 <= TTI <L1 = "LOW" Æ RED;
R2:L1<=TTI< L2="MEDIUM"ÆYELLOW; R3:L2 <= TTI<=100="HIGH"ÆGREEN
Table 3: Lean BP execution view measures sub-set.
Goal Purpose
Issue
Object
Minimize
the rework in loops of
the BP
Question Q1 which is the actual quantity of rework due to BP loops
Metrics M1 (derived)
M2 (derived)
M3 (derived)
M4 (derived)
M5 (indicator)
Activity rework in a loop (ARL = counts the time each activity is executed in a loop)
Activity Working time for the rework in a loop (AWoTRL = ∑ (AWoTe
i
) being e
i
each execution of
the activity in the loop)
Total Working time for the rework in a loop of the BP (TWoTRL = ∑ (AWoTRLa
i
) where a
i
represents an activity in the loop)
Total Working time for rework in all loops of BP case (BPTWoTRL = ∑ (TWoTRLl
i
) where l
i
represents a loop in the BP)
Percentage of rework time in BP case due to loops in the total BP TT (PBPTWoTRL =
BPTWoTRL*100/BPTT)
Decision criteria = Percentage DC: R1: 0 <= TTI <L1 = "LOW" Æ GREEN;
R2:L1<=TTI< L2="MEDIUM"ÆYELLOW; R3:L2 <= TTI<=100="HIGH"ÆRED
is based mainly on the identification and elimination
of waste. It defines as key principles the
specification of value from the customer viewpoint,
the removal of waste, making valuable flow,
delivering what the customer wants when it is
wanted and pursuing perfection. There are seven
types of waste defined: overproduction, waiting,
transport, extra processing, inventory, motion and
defects. These principles and waste types have been
adapted to several areas other than the
manufacturing sphere, such as lean software
development (Poppendieck, 2002), lean information
management (Hicks, 2007) and healthcare
(Jimmerson et al, 2005), among other realms, thus
making lean thinking usable in several BP domains.
As an example the GQM for the goal “Minimize the
rework in loops of the BP” is shown in Table 3,
which focuses on the detection of defects on the
products or services delivered by the BP.
Finally, the third view corresponding to
theServices execution, aims to define measures to
assess the execution of services realizing the BP.
Several issues have to be taken into account to
identify the most important features as regards
Quality of Services (QoS) requirements specified in
Services Level Agreement (SLA) (Wetzstein et al,
2008) (Cardoso et. al, 2002). To define these
measures we used the Quality Attributes (QA)
concepts for non-functional requirements and the
taxonomies from (O’Brien et. al, 2005) (Clements
et. al, 2001) (Bass et. al., 2003) (Barbacci et. al,
1995). Services measures then include quality
attributes such as: performance (i.e., response time
including processing time and latency, throughput,
capacity), dependability (i.e.,availability, reliability),
security (i.e., confidentiality, availability). Services
execution measures defined for performance are
related to the Generic execution measures for BP
performance. They focus, however, on the automatic
activities (i.e., tasks, sub-process, process) that are
implemented by services, adding information about
the execution of the specific software infrastructure.
Table 4 presents the GQM for the Goal “Guarantee
response time to L1 (i.e., label to be changed)
seconds for the service”, as an example of this.
3.2 Example of BPEMM Use
To give an example of the use of the BPEMM in the
context of the BPCIP from the MINERVA
framework we present the “Patient Admission and
Registration for Major Ambulatory Surgery (MAS)”
business process in Figure 14. In the following we
describe the possible execution of the improvement
cycle based on defined measures. The organization
is the “Hospital” whose business management area
EXECUTION MEASUREMENT-DRIVEN CONTINUOUS IMPROVEMENT OF BUSINESS PROCESSES
IMPLEMENTED BY SERVICES
55
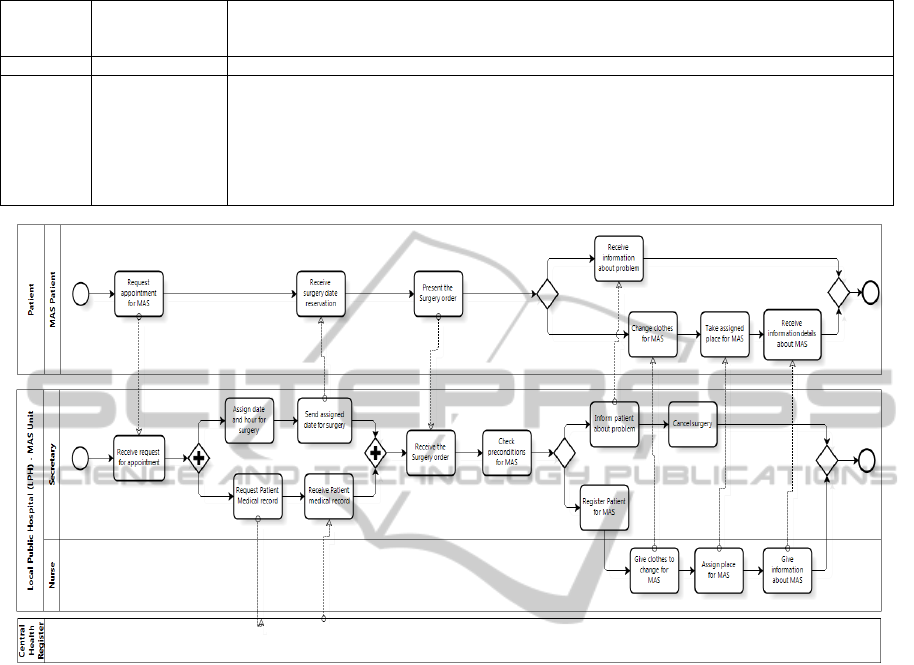
Table 4: Services execution view measures sub-set.
Goal Purpose
Issue
Object
Guarantee
response time to L1 seconds (label to be changed) (on peak load/normal operation) for
the service (implementing an activity/sub-process/process)
Question Q1 which is the actual response time of the service
Metrics M1 (derived)
M2 (derived)
M3 (derived)
M4 (indicator)
Processing time of a service (SPoT = CT–ST) (idem AWoT but for the defined service)
Latency time of a service (SLaT = ST – ET) (idem AWaT but for the defined service)
Response Time of a service in a BP case (SRpT = SPoT + SLaT)
Average service Response Time in all BP cases (ASRpT = ∑ SRpT/ Total services execution in all
BP cases)
Decision criteria = Average DC: R1: 0 <= TTI <L1 = "LOW" Æ GREEN;
R2:L1<=TTI< L2="MEDIUM"ÆYELLOW; R3:L2 <= TTI<=100="HIGH"ÆRED
Figure 14: “Patient Admission and Registration for MAS” business process specified using BPMN.
we assumed has chosen, in the Design & Analysis
phase, the set of execution measures of the Generic
execution view for the time dimension and services
execution measures (cf. Table 1, Table 4). Further
assume that guided by the BPSOM methodology
services to realize the BP have been implemented
which will be externally invoked by other
participants, and services have been defined to be
invoked by the Hospital from other parties.
In the Configuration phase assume the collection
of chosen measures is implemented in the software
for BP execution, and then the defined execution
information is registered in the execution logs.
Based on the measures defined for calculating BP
Throughput Time (TT) in BPEMM, times
corresponding to base measures for BP activities
have to be logged: enabled, start and finish time.
Table 5 shows an example of some events related to
the execution of activities simulating two BP cases.
It can be seen that as defined, the specified times are
registered for each activity, indicating to which
event the timestamp corresponds (enabled, start,
finish). Based on this information the execution
measures for the BP Throughput Time (TT) are then
calculated. Other information that can be registered
corresponding to other execution measures defined
such as the role or person/system performing the
activity is not shown in the table.
In the Evaluation phase based on the information
registered in the execution logs, the defined
execution measures can be calculated. Some of the
measurement results can be as follows:
• Average TT (ABPTT) = 8640 minutes (6 days)
• Case max.TT(BPTT) =21600 minutes (15 days)
• Case min. TT (BPTT) = 2880 minutes (2 days)
The Average TT for all BP case executions is 6
days instead of 4 days as defined by the business
area for performing the BP. The maximum value of
15 days shows that there are cases which take
significantly longer than 4 days. As these values are
not the expected ones, other measurement results
can be evaluated for BP case executions and for key
activities of the BP. The M14 indicator of Average
ENASE 2011 - 6th International Conference on Evaluation of Novel Software Approaches to Software Engineering
56
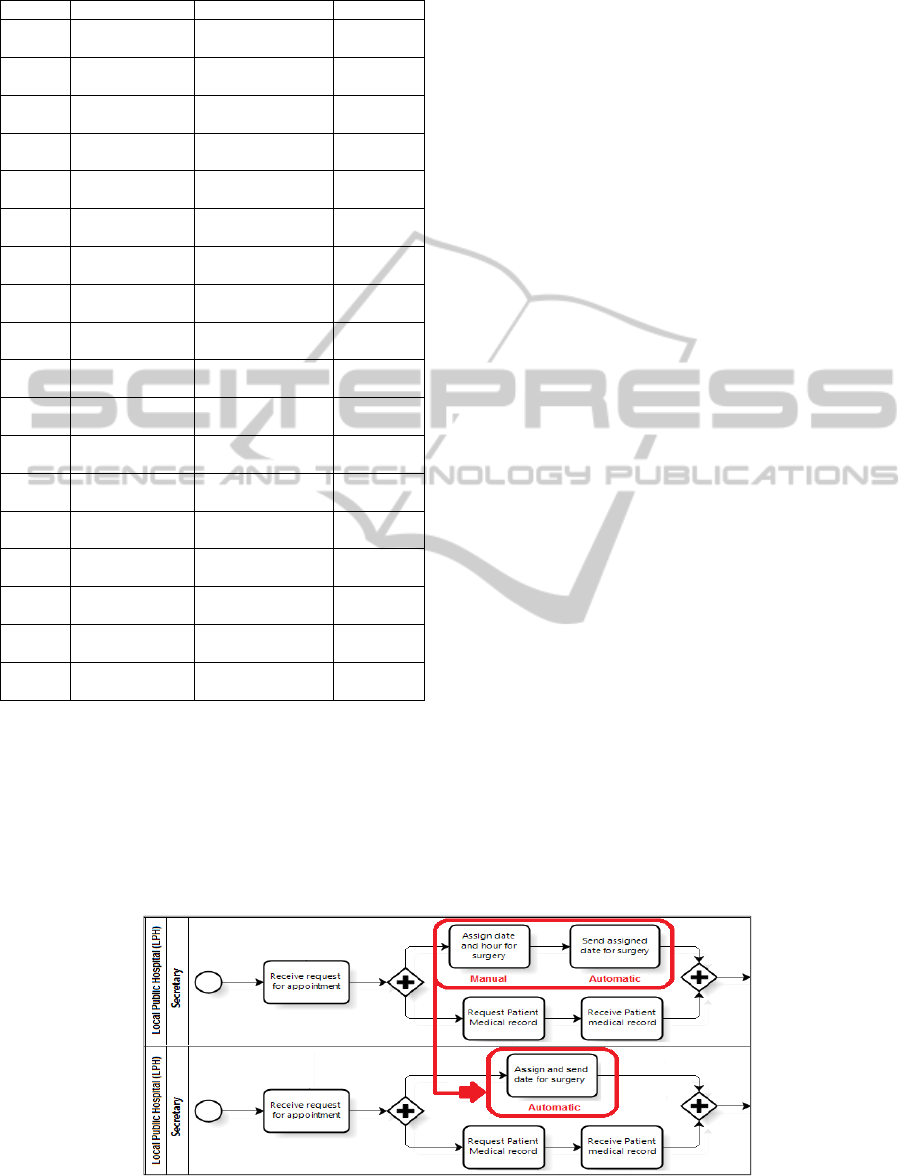
Table 5: Example of execution logs information.
Case Activity Timestamp Event
Case 1 Receive request
MAS
10-01-2010:
09:30
Enabled
Case 1 Receive request
MAS
10-01-2010:
09:30
Start
Case 1 Receive request
MAS
10-01-2010:
10:00
Completed
Case 2 Receive request
MAS
10-01-2010:
09:30
Enabled
Case 2 Receive request
MAS
10-01-2010:
09:35
Start
Case 2 Receive request
MAS
10-01-2010:
10:15
Completed
Case 1 Assign date
for MAS
10-01-2010:
10:00
Enabled
Case 2 Assign date
for MAS
11-01-2010:
10:15
Enabled
Case 2 Assign date
for MAS
13-01-2010:
12:15
Start
Case 2 Assign date
for MAS
13-01-2010:
12:45
Completed
Case 1 Assign date
for MAS
13-01-2010:
12:45
Start
Case 1 Assign date
for MAS
13-01-2010:
13:00
Completed
Case 1 Send assigned
date for MAS
13-01-2010:
13:00
Enabled
Case 1 Send assigned
date for MAS
13-01-2010:
13:02
Start
Case 1 Send assigned
date for MAS
13-01-2010:
13:05
Completed
Case 2 Send assigned
date for MAS
13-01-2010:
12:45
Enabled
Case 2 Send assigned
date for MAS
13-01-2010:
12:46
Start
Case 2 Send assigned
date for MAS
13-01-2010:
12:50
Completed
BP Working time (ABPTWoT) as well as the
M10 indicator of the Index (TTI) between BP Total
Working time vs. Total Waiting time, which are not
shown due to space reasons, show that the TT of the
BP is increased by waiting times in the execution of
some activities. After analyzing the values for
several BP cases, the M9 indicator of the index
(ATI) between Working time and Waiting time of
the activity “Assign date and hour for the surgery” is
found to be in the rank “High” in 90%, i.e., the
activity’s waiting time is unreasonably high
compared to its working time. Then, the origin of the
BP execution problem is located in the activity
mentioned, so an improvement effort with focus on
this activity is initiated, to redesign the BP model.
The activities defined in the improvement
process have to be performed then, to specify the
improvements to be integrated in the cycle, how to
integrate them into the BP, and finally to execute the
particular improvements re-entering the BP lifecycle
again. In this case, re-entry is in the Design &
Analysis phase as the BP model has to be
redesigned. To do so, there are approaches that
propose different options (Reijers, 2003) (Maruster,
2009) (Netjes, 2010). In the example, one option
could be to combine the activity with the one called
“Send assigned date for surgery” in an activity of
higher granularity, which performs both tasks
automatically, thus eliminating the manual
intervention in the first one. Figure 15 shows the two
BP versions before and after the improvement.
Redesign options can be evaluated by means of
analytical or simulation techniques. After selecting a
redesign, a new version of the BP is generated
continuing with it execution up to the calculation of
the associated execution measures. Finally, the
measures results for the new BP version executed
are compared to the ones from the previous BP
version, to assess whether the defined goals have
been achieved with the introduced improvement. In
the example the goal is to reduce the BP Average
Throughput Time (TT) from 6 to 4 days.
4 RELATED WORK
Regarding BP execution measurement our
definitions are based on the works on (Reijers, 2003)
Figure 15: Versions Comparison for “Patient Admission and Registration for MAS”.
EXECUTION MEASUREMENT-DRIVEN CONTINUOUS IMPROVEMENT OF BUSINESS PROCESSES
IMPLEMENTED BY SERVICES
57

(Laguna et. al, 2005) (zur Muehlen, 2004) (van der
Aalst et. al, 2007) where several concepts and
measures, are presented and analyzed. Process
Mining (van der Aalst, 2007) uses execution logs
information to help finding BP models from BP
execution, checking conformance between BP
models and its execution, and extending BP models
with execution information. Analytical techniques
are used in (Reijers, 2003) (Laguna et. al, 2005) to
analyze and predict BP performance and other BP
characteristics, and simulation is also used in
(Laguna et. al., 2005) (Netjes, 2010). To redesign
BP models based on improvement opportunities
found several options are proposed in (Reijers,
2003) (Netjes, 2010). Using a data warehouse is
proposed in (zur Muehlen, 2004) to store, analyze
and evaluate BP execution. Design measures defined
in (Rolón et. al, 2006) (Mendling, 2008), (Sánchez
González et. al, 2010) are complementary to ours
and can be used to find improvements opportunities
in earlier stages of the BP lifecycle.
Several proposals exist from the business area
but they focus mostly on the definition of Key
Performance Indicators (KPIs) related to the flow
and domain of the BP, not taking explicitly into
account the infrastructure which realizes it. Some
tools from the software area such as ProM (ProM)
has a plug-in to make basic performance analysis
based on measures defined. ARIS (ARIS) has a
Process Performance Manager (PPM) which also
provides insight into performance and other BP
execution measures, which have to be defined. Other
techniques like Balance Scorecard (Kaplan et. al,
1992) are proposed and used by the business area to
align the BP with the strategic goals of the
organization and to define the associated measures, a
comparison with GQM can be seen in (Buglione et.
al, 2000). Several tools provide support to BSC.
5 CONCLUSIONS AND FUTURE
WORK
The MINERVA framework provides support for
continuous business process improvement based on
its lifecycle management and its implementation by
services and model driven development. It defines a
BPCIP improvement process integrating into the BP
lifecycle explicit measurement activities and a
process to introduce improvements in a systematic
way. A BP execution model (BPEMM) made up of
several BP execution measures is also defined to be
used in the BPCIP improvement process. BPEMM
provides several execution measures related with the
defined business strategy and goals, allowing the
selection and implementation of execution measures
regarding the needs of the organization.
BPEMM execution measures are defined using
the GQM paradigm, to provide traceability from
business goals to execution measures taking into
account existing and broadly used measures and
proposing new ones. Execution measures are
defined for: time, cost, quality and flexibility
dimensions of generic BP execution, domain
specific execution, lean focus execution and services
execution. For each specific GQM we also provide a
graphical representation in the SMTool, which
allows bringing a global vision of the measures
defined. The major contribution of the BPCIP and
BPEMM we have described lies in the integration of
all the different methods presented, the existing
execution measures and the new ones defined, to
support the continuous improvement of BP
implemented by services with traceability from
business goals to software implementation.
As current and future work we are implementing
the BPEMM as a ProM plug-in so as to import
execution logs, calculate the execution measures
defined and show the results to be analyzed by the
business management area, thus providing support in
finding improvement opportunities with respect to
the achievement of the specified business goals.
ACKNOWLEDGEMENTS
This work has been partially funded by the Agencia
Nacional de Investigación e Innovación
(ANII,Uruguay), ALTAMIRA project (Junta de
Comunidades de Castilla-La Mancha, Spain, F. Soc.
Europeo, PII2I09-0106-2463), PEGASO/MAGO
project (Ministerio Ciencia e Innovacion MICINN,
Spain, FEDER, TIN2009-13718-C02-01) and
INGENIOSO project (Junta de Comunidades de
Castilla-La Mancha, Spain, PEII11-0025-9533)
REFERENCES
ARIS, IDS Scheer, Software AG, Germany
Barbacci, M., Klein, M., Longstaff, T., Weinstock, C.,
1995, Quality Atributtes, CMU/SEI-95-TR-021, SEI.
Basili, V.R., 1992,Software Modeling and Measurement:
The GQM Paradigm,CS-TR-2956,University of
Maryland
Bass, L., Clements, P., Kazman, R., 2003, Software
Architecture in Practice, Addison Wesley
Buglione, L., Abran, A., 2000: Balance Scorecards and
GQM: what are the differences?, FESMA-AEMES
ENASE 2011 - 6th International Conference on Evaluation of Novel Software Approaches to Software Engineering
58

Software Measurement Conference
Brand, N., Van der Kolk, H., Workflow Analysis and
Design, 1995.
Cardoso J., Sheth, A., Miller, J., 2002: Workflow quality
of service, In Int. Conf. on Enterprise Integ. and Mod.
Tech.,Int. Enterprise Mod. Conf.(ICEIMT/IEM’02)
Cardoso, J., 2006: Process control-flow complexity
metric: An empirical validation, In IEEE International
Conference on Services Computing (SCC '06)
Clements, P., Kazman, R., Klein, M., 2001, Evaluating
SW Archs:Methods and Case Studies,Addison Wesley
Delgado A., Ruiz F., García-Rodríguez de Guzmán
I.,Piattini M., 2009a: Towards a Service-Oriented and
Model-Driven framework with business processes as
first-class citizens, In: 2nd IC on Business Process and
Services Computing (BPSC’09).
Delgado A., Ruiz F., García-Rodríguez de Guzmán I.,
Piattini M., 2009b: MINERVA: Model drIveN and
sErvice oRiented framework for the continuous
business processes improVement & relAted tools, In
5th Int. Work. on Engineering Service-Oriented
Applications (WESOA’09), LNCS
Delgado A., Ruiz F., García-Rodríguez de Guzmán I.,
Piattini M., 2010a: Towards an ontology for service
oriented modeling supporting business processes, In
4th.IC Research Challenges Inf. Sci. (RCIS’10), IEEE
Delgado, A., García - Rodríguez de Guzmán, I., Ruiz, F.,
Piattini, M., 2010b: Tool support for Service Oriented
development from Business Processes, In 2nd Int.
Work. Model-Driven Service Engineering (MOSE’10)
Delgado A., Ruiz F., García-Rodríguez de Guzmán I.,
Piattini M., 2010c: A Model-driven and Service-
oriented framework for BP improvement, Journal of
Systems Integration (JSI), Vol.1, No.3
Delgado, A., García - Rodríguez de Guzmán, I., Ruiz, F.,
Piattini, M.,2010d: From BPMN BP models to SoaML
service models: a transformation-driven approach. In:
2nd Int. Conf. on Sw Tech. Engineering (ICSTE’10)
García, F., et al., 2005: Towards a Consistent Terminology
for Software Measurement, Inf. and SW Tech., 48
Hicks, B.J., 2007: Lean information management:
Understanding and eliminating waste, Int. Journal of
Information Management, Elsevier
Jimmerson, C., Weber, D., Sobek, D., 2005: Reducing
waste and errors: Piloting Lean Principles at
Intermountain Healthcare, Journal Quality&Patient
Safety
Kaplan, R. S., Norton, D. P., 1992: The balanced
Scorecard
Measures that drive performance, Harvard Business
Review, Vol. 10, No. 1
Laguna, M., Marklund, J., 2005: BP Modeling, Simulation
and Design, Prentice Hall
Maruster, L., van Beest, N., 2009: Redesigning business
processes: a methodology based on simulation and
process mining techniques, Knowl. Inf. Syst. Journal
Mellor, S., Clark, A., Futagami, T., 2003: Model Driven
Development-Guest eds.int., IEEE Computer Society
Mendling, J., 2008: Metrics for Process Models: Empirical
Foundations of Verification, Error Prediction, and
Guidelines for Correctness, Springer
Mora, B., García, F., Ruiz, F., Piattini, M., 2008:
SMML: Software Measurement Modeling Language,
8th Int.Work.Domain-Specific Modeling,
(OOPSLA’08)
Netjes, M., 2010: Process Improvement: The creation and
Evaluation of Process Alternatives, Eindhoven UT.
O’Brien, L., Bass, L., Merson, P., 2005:Quality Attributes
and SOA, CMU/SEI-20055-TN-014, SEI.
OMG, 2008a, BP Modeling Notation(BPMN), v.1.2
OMG, 2008b, Query/Views/Transformations(QVT), v.1.0
OMG, 2008c, BP Maturity Model (BPMM), v.1.0
OMG, 2009, Soa Modeling Language (SoaML), beta 2
Papazoglou, M.; Traverso, P.; Dustdar, S., Leymann, F.,
2007: Service-Oriented Computing: State of the Art
and Research Challenge, IEEE Computer Society
Pino, F., Hurtado, J., Vidal, J., García, F., Piattini,
M.,2009: A Process for Driving Process Improvement
in VSEs, Int. Conf. on Software Process (ICSP'09)
Poppendieck, M., 2002: Principles of Lean Thinking,
Poppendieck.LLC.
ProM, Process Mining Group, Eindhoven University of
Technology, The Netherlands
Reijers, H., 2003: Design and Control of Workflow
Processes: BPM for the Service Industry, LNCS
Rolón, E., F. García, et al., 2006: Evaluation Measures for
Business Process Models, In 21st Symposium on
Applied Computing (SAC’06)
Sánchez, González L., Delgado, A., Ruiz, F., García, F.,
Piattini, M., 2009: Measurement and Maturity of BP.
Eds.: Cardoso, J., van der Aalst, W.,Handbook of
Research on BP Modeling, Inf. Science Ref.,IGI
Global
Sánchez González, L., F. García, et al., 2010: Assessment
and Prediction of Business Process Model Quality, In
18th Int. Conf. Cooperative Inf. Systems (CoopIS’10)
Smith,H.,Fingar,P., 2003: Business Process Management:
The third wave, Meghan-Kieffer
van der Aalst, W. M. P., ter Hofstede, A., Weske,
M.,2003: Business Process Management: A Survey, In
Int. Conf. on Business Process Management (BPM’03)
van der Aalst, W.M.P., Reijers, H. A., Medeiros, A., 2007,
Business Process Mining: an Industrial Application,
Information Systems Vol.32 Issue 5
Weske, M., 2007: BPM Concepts, Languages,
Architectures, Springer
Wetzstein, B., Karastoyanova, D., Leyman, F., 2008:
Towards Management of SLA-Aware BP Based on
Key Performance Indicators, In 9th Work. BP
Modeling,Development and Support (BPMDS’08)
zur Muehlen, M., 2004: Workflow-based Process
Controlling, Foundation, Design, and Application of
Workflow-driven Process IS, Logos Verlag
EXECUTION MEASUREMENT-DRIVEN CONTINUOUS IMPROVEMENT OF BUSINESS PROCESSES
IMPLEMENTED BY SERVICES
59
