
NEURAL CLASSIFIER FOR DETECTION
AND CLASSIFICATION OF SPIKES AND SHARP WAVES
Geovani Rodrigo Scolaro, Fernando Mendes de Azevedo and Christine Fredel Boos
Biomedical Engineering Institute, University Federal of Santa Catarina, Florianópolis, SC, Brazil
Keywords: Spikes, Sharp waves, Wavelet, Artificial neural networks, Neural classifier.
Abstract: In this article is discussed the application of a hybrid approach that uses the Wavelet Transform and
Artificial Neural Networks in detection and recognition of epileptiform events in EEG signals. It is
presented the methodology used to develop a Neural Classifier as well as the experiments and its results
through the Neural Networks and Wavelet Transform. The developed Neural Classifier showed good results
in the classification of Epileptiform events with and without pre-processing achieving sensitive of 97.14%,
specificity of 94.55% and accuracy of 96.14%, suggesting the high sample rate of the EEG signals
contributed to achieve these values.
1 INTRODUCTION
Epilepsy is a chronic condition or a group of
diseases with high prevalence, however, still poorly
explained by science. Epileptic seizures are crises
that reflect a temporary dysfunction of a small part
of the brain (focal seizures) or a more extensive area
involving the two hemispheres (generalized
seizures).
The electrographical elements frequently found
in EEG records of epileptic patients are the Spikes
(20-70 ms) and Sharp Waves (70-200 ms). These
events are significative for the epilepsy diagnosis,
which are known as Epileptiform events (Argoud et
al., 2006), (Sörnmo and Laguna, 2005), (Pillai and
Sperling, 2006). In neurological practice spikes
found in the records of electroencephalography
(EEG) are used to confirm a diagnosis of epilepsy
(Pillai and Sperling, 2006) and help identify the type
of syndrome that affects the patient (Niedermeyer
and Silva, 2004).
Automatic detection of Epileptiform events is an
important aspect of long-term epilepsy monitoring
and it is important highlights that the visual analysis
is a slow and exhaustive process being extensively
used as support for the diagnosis of epilepsy (Pillai
and Sperling, 2006). Experts verify screens of signal
composed by 24 or 32 channels in continuous EEG
records with durations up to 15s (Argoud et al.,
2006).
Wilson and Emerson (2002) conducted a study
where algorithms to detect Epileptiform events are
compared. It can be observed that few systems have
practical application, because many of these don’t
prove to have reached an acceptable rate of false
positives per minute (fp/min), resulting in little or
none effective saving of time.
This work contributed to the automating process
of the epilepsy diagnosis, checking the feasibility of
using the Wavelet Transform as a way to processing
the EEG signals as well as the capability of Neural
Network works as a Neural Classifier in the
classification of Epileptiform and Non-Epileptiform
events. It was used this sampling rate of 512 Hz in
attempt to obtain better results in the process of
classification of events in relation to other studies
using lower sampling rate between 100 and 256 Hz
(Argoud et al., 2006), (Sovierzoski, 2008), (Khan
and Gotman, 2003), (Pillai and Sperling, 2006)
(Indiradevi et al., 2008), (Adeli et al., 2002) (Pang et
al. 2003), (Xu et al. 2007).
The results were evaluated using performance
indicators applied to the diagnostic tests. The
algorithms were implemented in C++ Builder 6.
2 MATERIAL AND METHODS
2.1 Bank of EEG Signals
The bank of EEG signals is composed by records of
11 patients truly epileptic. The used signals present
504
Mendes de Azevedo F., Scolaro G. and Fredel Boos C..
NEURAL CLASSIFIER FOR DETECTION AND CLASSIFICATION OF SPIKES AND SHARP WAVES .
DOI: 10.5220/0003170405040509
In Proceedings of the International Conference on Bio-inspired Systems and Signal Processing (BIOSIGNALS-2011), pages 504-509
ISBN: 978-989-8425-35-5
Copyright
c
2011 SCITEPRESS (Science and Technology Publications, Lda.)
the following settings: referential montage, 32
channels, 512 Hz of sample rate, band limited 0.5-
40 Hz and notch filter of 60 Hz to eliminate
interference caused by the power line. They were
selected 685 events between spikes, sharp waves,
blinking, background activity and noise.
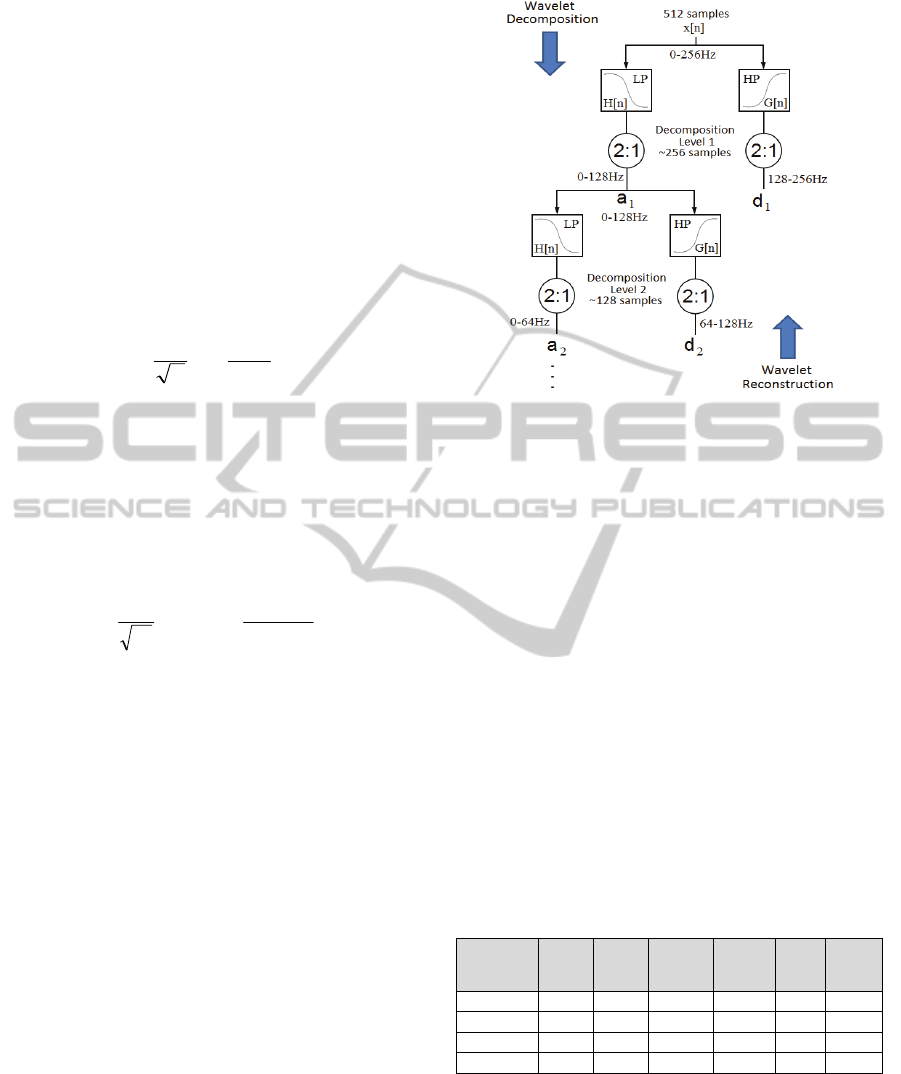
2.2 Wavelet Multiresolution Analysis
The analysis in time-frequency domain by Wavelet
Transform is performed by taking a Wavelet
prototype function called mother-wavelet. This
mother-wavelet suffers escalations and translations,
forming the daughter-wavelets (1) (Mallat, 1999).
a
bt
a
t
ba
1
,
(1)
where ψ(t) is the mother-wavelet and ψ
a,b
is the
daughter-wavelet, a
-1/2
is the constant of energy
normalization, b is the translation factor and a is the
dilation factor.
The Continuous Wavelet Transform uses
parameters of time and scales continuous. Using
discrete parameters to a and b (a≥1, b≥1) determines
the Discrete Wavelet Transform (2).
dt
a
akbt
tx
a
baDWT
i
i
i
1
,
0
00
*
0
(2)
where k and i are integers, b
0
and a
0
are the
parameters of translation and dilation, respectively.
The Wavelet Multiresolution Analysis is based in
the computational implementation of the Discrete
Wavelet Transform. The algorithm decomposes a
discrete signal using filter banks (Argoud et al.,
2006), (Mallat, 1999), (Indiradevi et al., 2008).
The set of filters H[n] extract the average
characteristics, defined as approximations of the
signal x and added to a set of filters G[n] extract the
features of high-frequency defined as details of the
signal x (Figure 1).
The idea to use the Wavelet Transform is extract
the signal features that somehow can be used as way
of separation between the classes of events before a
selected epoch of signal be analyzed by the neural
classifier.
In this work it was used Wavelet Function
Coiflet1 because this function showed better results
at the detection of Epileptiform Events as seen in
studies conducted by Argoud et al. (1999), Argoud
et al. (2006) and only the details of the
decomposition levels were used to process the
signals.
Figure 1: Representation of the Wavelet Multiresolution
analysis.
2.3 Neural Networks
A Neural Network Multilayer Perceptron has
multiple layers of neurons fully connected (Eberhart
and Dobbins, 1990). The first layer or input layer
receive the patterns, intermediate layers perform the
processing and feature extraction and the output
layer presents the final result. In the last layer the
neurons can have an output function in order to
discretize the results transforming the Neural
Network in a classifier (Haykin, 2001), (Eberhart
and Dobbins, 1990).
If there is only one output neuron the network
becomes a binary neural classifier, as implemented
in this work.
Some events were selected to generated three
sets of patterns: training, validation and test showed
in the Table 1.
Table 1: Description of the pattern sets.
Pattern Set
Spikes
Sharp
Waves
Blinking
Normal
Activity
Noise
Total
of
Events
Training 29 71 31 40 29
200
Validation 13 87 41 49 10
200
Test 28 148 36 56 17
285
Total
70 306 108 145 56
685
2.4 Indexes of Sensitivity
and Specificity
In the evaluation of the neural classifier the result of
classification and appointment of the expert are
compared. This comparison is also known as
NEURAL CLASSIFIER FOR DETECTION AND CLASSIFICATION OF SPIKES AND SHARP WAVES
505
diagnostic test widely used in medical sciences. The
indicators True Positive (TP) and True Negative
(TN) represent the agreement in the classification of
the correct decisions. The False Positive (FP) and
False Negative (FN) rates represent the
disagreement in the classification (Jekel, 2001).
Totaling the indicators described above can be
calculated the sensitivity, specificity and accuracy.
Sensitivity (3) is the ability of the classifier to
identify the positive events among the truly positive.
FN
T
P
TP
ysensibilit
(3)
Specificity (4) is the ability of the classifier to
identify the negative between the truly negative and
both indexes are used in the ROC Analysis.
FP
T
N
TN
yspecificit
(4)
Accuracy (5) is the global concordance of the true
positive and negative results in subjects with and
without the sickness (Jekel, 2001).
T
N
FN
FP
T
P
TNTP
accuracy
(5)
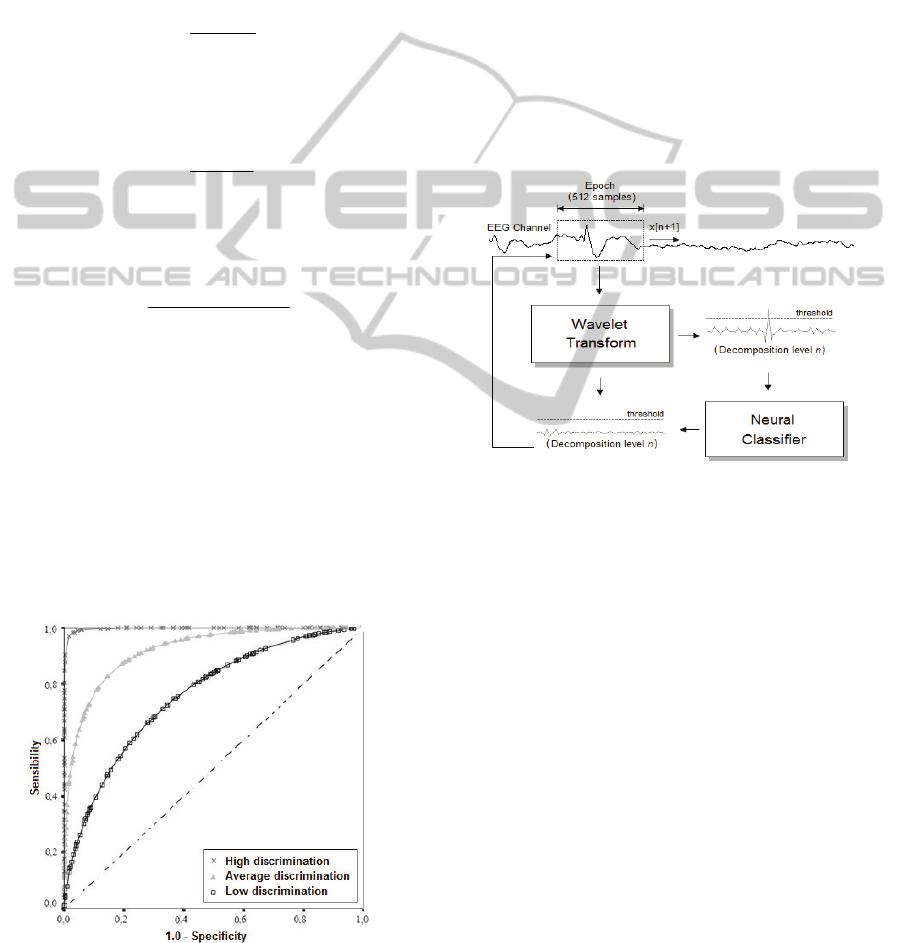
2.5 ROC Analysis
The use of ROC curve (Figure 2) as a performance
measure for classifier systems and diagnostic
systems regardless of their application and it is
employed in expert systems and Artificial Neural
Networks. To measure the performance of the ROC
curve is used the AUC (Area Under the ROC Curve)
index, which present values between 0.5 (no
discrimination) and 1.0 (total discrimination)
(Sovierzoski, 2008), (Jekell, 2001), (Braga, 2000).
Figure 2: ROC Curves.
3 METHODOLOGY
From each EEG channel the selected epochs of
signal has 512 samples. This epoch is submitted to
the Coiflet1 function where is decomposed in 10
detail levels. Each decomposed level presents a
particular signal with some extracted features about
the selected epoch, which highlight the high
frequencies of the signal. These decomposed signals
are compared with a threshold composed by the
mean in addition with the standard deviation of the
EEG signal. If the decomposed signal exceeds the
threshold the analyzed epoch is characterized as an
Epileptiform Event and then presented to the Neural
Network inputs. The neural classifier will classify
this epoch as Epileptiform Event or not. All this
process is showed in the Figure 3.
Figure 3: Overview of the work.
Some experiments were performed extracting
features of the EEG signals with the objective to
identify the better decomposition level to implement
the neural classifier. It was plotted one chart for each
detail level of decomposition with the dispersion of
all the 685 selected events. In the process of
decomposition each detail level presents a signal
with positive and negative amplitudes (Figure 3),
which characterize the high frequencies of the
original signal. It was calculated the absolute value
of the decomposed signal for each detail level to
represent the high frequencies only in one domain.
The absolute values were plotted in the charts. It
was verified that the 5
th
and 6
th
levels of
decomposition (Figure 4) were the levels that more
highlighted Spikes and Sharp Waves. Other events
are also highlighted with lower amplitudes. Some of
them showed amplitudes next to the amplitudes of
the Spikes and Sharp Waves.
BIOSIGNALS 2011 - International Conference on Bio-inspired Systems and Signal Processing
506
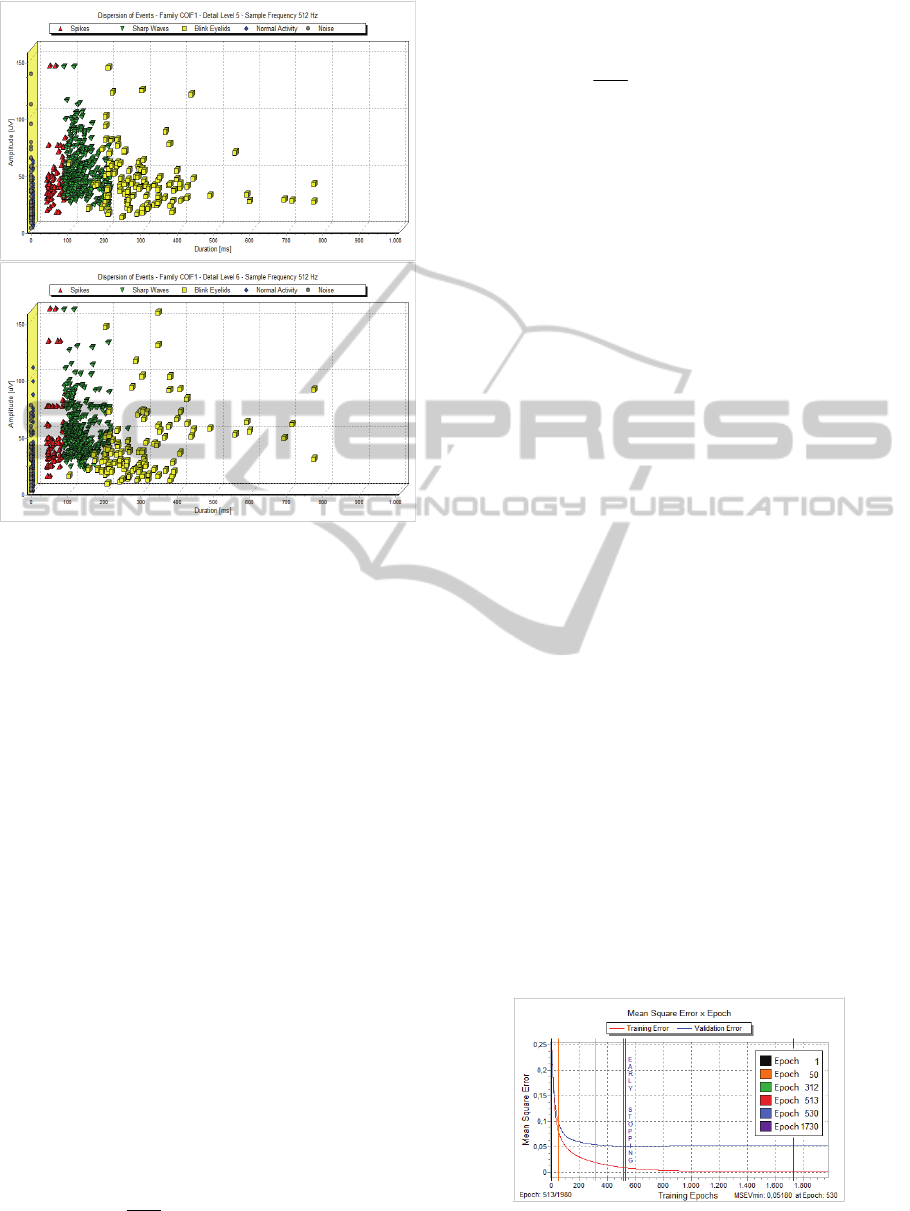
Figure 4: Groups of Spikes and Sharp Waves at the 5
th
and
6
th
levels of decomposition.
For this reason other experiments were
performed only using the Neural Networks just to
check its performance with signals without
processing.
The topology used to implement the Neural
Network was a Feedforward three-layer, with 512
neurons in the input layer, 10 neurons in the inner
layer and 1 neuron to the output layer, and for all
neurons was used the logistic activation function.
The convention used was the high output (1)
represents the Epileptiform events and the low
output (0) represents the Non-Epileptiform events.
In supervised training procedure of Neural Network
was used the Backpropagation.
For the training it was used the following
settings: random initialization of synaptic weights
with values between ± 0.01, learning rate of 0.002
and momentum of 0.7. The evaluation of the Neural
Network training was performed using the method
of Cross-validation with Early Stopping. In this
method the evaluation of the training and validation
errors are calculated when all the patterns of the
training set and validation set are presented to the
network. The mean square error of training is
calculated from the equation (6).
Nt
n
tt
t
T
nynd
N
n
1
2
))()((
2
1
)(
(6)
Similarly, the validation error of the network is
calculated by (7).
Nv
n
vv
v
V
nynd
N
n
1
2
))()((
2
1
)(
(7)
In the process of performance evaluation of the
neural classifier was used the AUC index. The
evaluation of the classifier starts when the set of
validation patterns is presented to the network,
where the indicators (TP, TN, FP, FN) were
totalized. From these indicators the sensitivity and
specificity curves are calculated as well as the ROC
curve for each epoch of training allowing identifying
epochs that presented the highest AUC.
4 RESULTS
4.1 Wavelet Transform
It was verified that the 5
th
and 6
th
levels of
decomposition (
Figure 4) were the levels that more
highlighted Spikes and Sharp Waves. Other events
are also highlighted with lower amplitudes. Some of
them showed amplitudes next to the amplitudes of
the Spikes and Sharp Waves. In a practical
application would not be possible to define a
threshold decision to perform the separation of these
events using only the amplitudes of the decomposed
signals.
4.2 Neural Classifier
During the training process (Figure 5) can be
observed that the mean square error of the training
curve showed a continuous decay, indicating the
training convergence. The validation curve shows a
decay of the mean square error up to the epoch 530,
reaching the minimum value (MSE
Vmín
=0.05180),
characterizing the early stopping. From the epoch
531 there was an increasing in the error, indicating
the specialization of the training.
Figure 5: Curves of the mean square error of training and
validation for different epochs of training.
NEURAL CLASSIFIER FOR DETECTION AND CLASSIFICATION OF SPIKES AND SHARP WAVES
507
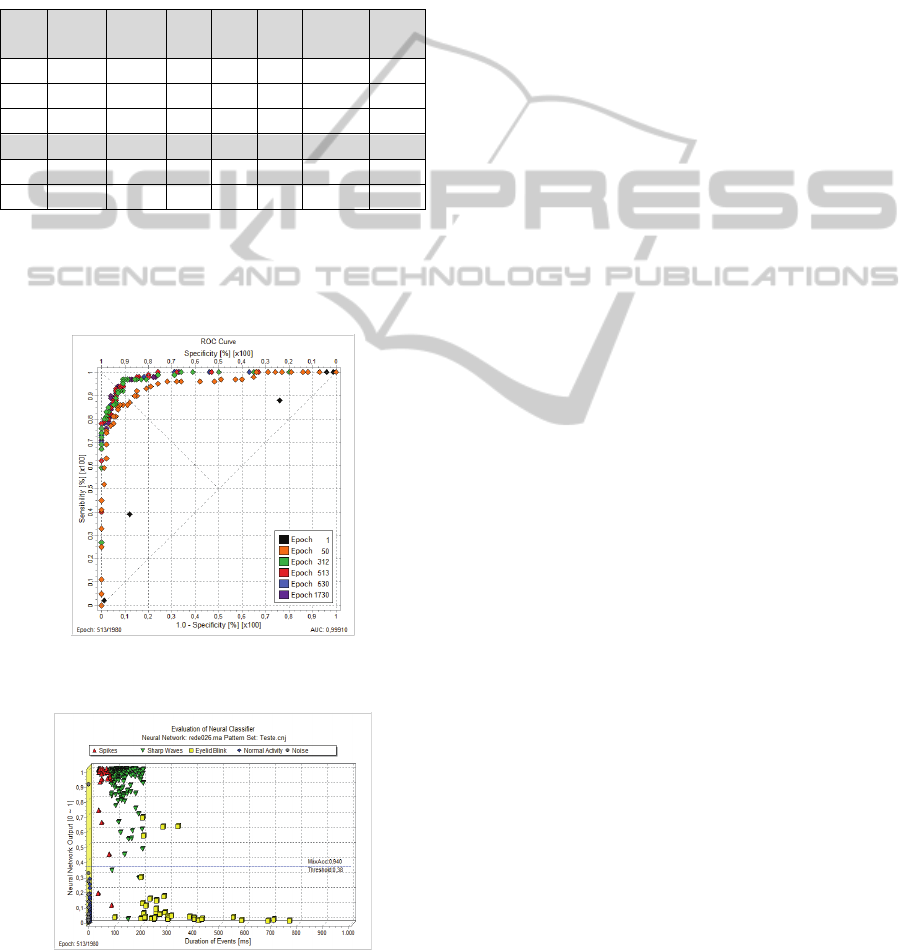
Table 2 shows the performance indexes obtained
with the neural classifier and the Figure 6 shows the
ROC curves of different epochs of training.
The epoch 513 had the highest value for
sensitivity and specificity, therefore, also showed the
highest rates of performance demonstrating that the
best results are obtained next to the epoch 530,
which was the occurrence point of early stopping.
Table 2: Obtained results between the epochs of training.
Epoch MSE
train
MSE
vald
Sens.
[%]
Spec.
[%]
Acc.
[%]
Threshold
AUC
Máx.
1 0,24992 0,24581 81,08 45,02 54,39 0,54 0,62150
50 0,08106 0,09933 91,76 82,61 88,07 0,56 0,99500
312 0,02028 0,05528 96,02 93,58 95,09 0,34 0,99790
513 0,00973 0,05180 97,14 94,55 96,14 0,38 0,99910
530 0,00918 0,05180 97,14 94,55 96,14 0,38 0,99850
1730 0,00123 0,05324 96,05 94,44 95,44 0,24 0,99630
After the evaluation of the neural classifier a
final test was performed by selecting the epoch 513,
which represents the highest AUC (AUC
Máx
=
0.99910).
Figure 6: ROC curves for some epochs of training. It can
be observed the epoch 513 had the higher AUC index.
Figure 7: Representation of the classification performed
with the test pattern set selecting the epoch 513 (Highest
AUC Index).
It was used a set of test with 285 events. Figure 7
shows the classification made by the neural
classifier, based in the epoch 513 of training
reaching values of sensitivity of 97.14%, specificity
of 94.55% and accuracy of 96.14%
5 CONCLUSIONS
In the obtained results using the Wavelet Transform
was observed that only the amplitude of decomposed
signals cannot separate Epileptiform and Non-
Epileptiform events reaching values of sensitivity of
96.43%, specificity of 88.03% and accuracy of
92.98%. Further studies are being made with the
Wavelet Multiresolution Analysis to signals with
512 Hz of sample rate.
The neural classifier evaluation was performed
using the performance indexes (AUC index and
accuracy index). These indexes could be an efficient
way to verify the performance of the classifier. The
best results of the classifier training were at the
epochs that the indexes obtained are located near to
the epoch indicated by the early stopping. The
experiments with the neural classifier using signals
without processing reached better results than
signals processed by the Wavelet Transform:
sensitivity of 97.14%, specificity of 94.55% and
accuracy of 96.14%.
It can be concluded that the high sample rate of
the EEG signals influence directly in the recognition
process. With a high sample rate more pattern details
are passed to the Neural Network inputs, improving
distinction between the events, which allowed
achieve better results without the need to pre-process
the EEG signals. However, the high sample rate
means more details about the signal, and fast
variations present in the signal that characterized
high frequency are highlighted too. This implied in
an increase of false positives due to the fact that the
Wavelet Transform confuse fast variations with
spikes. This fact explains the difference between the
rates of sensitivity and specificity among the use or
not of the Wavelet Transform as pre-processing the
inputs of neural classifier.
REFERENCES
Wilson, S. B., Emerson R., 2002. Spike Detection: a
review and comparison of algorithms. Clinical
Neurophysiology. Vol. 113, pp. 1873-1881.
Niedermeyer, E., Silva, F. L., 2004.
Electroencephalography: Basic Principles, Clinical
BIOSIGNALS 2011 - International Conference on Bio-inspired Systems and Signal Processing
508

Applications, and Related Fields. Lippincott Williams
e Wilkins.
Sörnmo, L., Laguna, P., 2005. Bioelectrical Signal
Processing in Cardiac and Neurological Applications.
Elsevier Academic Press, USA.
Pillai, J., Sperling, M.R., 2006. Interictal EEG and the
Diagnosis of Epilepsy. Epilepsia. v. 47 (Suppl. 1): 14-
22, Blackwell Pub. ILAE.
Haykin, S., 2001. Redes Neurais: Princípios e Prática.
Bookman.
Mallat, S., 1999. A Wavelet Tour of Signal Processing.
Academic Press, USA.
Eberhart, R. C., Dobbins, R.W., 1990. Neural Networks
PC Tools. A Practical Guide. Academic Press.
Jekel, J. F., Katz, D. L., Elmore, Joann G., 2001.
Epidemiology, Biostatistics and Preventive Medicine.
2
nd
edition, W. B. Saunders Company p.108-109.
Argoud, F. I. M., De Azevedo, F. M., Marino Neto, J.,
Bittencourt, P. C. T., 1999. Development of an
automatic system of detection and classification of
epileptiform events in EEG. Medical & Biological
Engineering & Computing. v.37, p.490 – 491.
Argoud, F. I. M., Azevedo, F. M., Marino Neto, J. and
Grillo, E., 2006. An effective system for automated
detection of epileptiform events in long-term EEG
based on context information. Medical and Biological
Engineering and Computing. SpringerLink.
Sovierzoski, M. A., 2008. Evaluation of ANN Classifiers
During Supervised Training with ROC Analysis and
Cross Validation. International Conference on
Biomedical Engineering and Informatics. IEEE
Computer Society.
Khan, Y. U., Gotman, J., 2003. Wavelet based automatic
seizure detection in intracerebral
electroencephalogram. Clinical Neurophysiology.
Elsevier.
Braga, A. C. S., 2000. Curvas ROC: Aspectos Funcionais
e Aplicações. Doctorate Thesis, University of Minho,
Braga, Portugal.
Indiradevi, K. P., Elias, E., Sathidevi, P. S., Nayak, S. D.,
Radhakrishnan, K., 2008. A multi-level wavelet
approach for automatic detection of epileptic spikes in
the electroencephalogram. Computers in Biology and
Medicine. Elsevier.
Adeli, H. Zhou, Z. Dadmehr, N., 2002. Analysis of EEG
records in an epileptic patient using wavelet transform.
Journal of Neuroscience Methods. Elsevier.
Pang, C. C. C., Upton, A. R. M., Shine, G., Kamath, M.
V., 2003. A Comparison of Algorithms for Detection
of Spikes in the Electroencephalogram. IEEE
Transactions on Biomedical Engineering. Vol. 50, No.
4, April.
Xu, G., Wan, J., Zhan, Q., Zhan, S., Zhu, J., 2007. A spike
detection method in EEG based on improved
morphological filter. Computers in Biology and
Medicine. Elsevier.
NEURAL CLASSIFIER FOR DETECTION AND CLASSIFICATION OF SPIKES AND SHARP WAVES
509
