
FEATURE SELECTION FOR INTER-PATIENT SUPERVISED
HEART BEAT CLASSIFICATION
G. Doquire
1
, G. de Lannoy
1,2
, D. Franc¸ois
1
and M. Verleysen
1
1
ICTEAM Institute, Machine Learning Group, Universit
´
e catholique de Louvain
pl. du Levant 3, 1348 Louvain-la-Neuve, Belgium
2
Institute of Neuroscience, Universit
´
e catholique de Louvain, av. Hippocrate 54, 1200 Bruxelles, Belgium
Keywords:
Feature selection, Electrocardiogram signal, Heart beat classification, AAMI standards.
Abstract:
Supervised and inter-patient classification of heart beats is primordial in many applications requiring long-term
monitoring of the cardiac function. Several classification models able to cope with the strong class unbalance
and a large variety of ECG feature sets have been proposed for this task. In practice, over 200 features are
often considered and the features retained in the final model are either chosen using domain knowledge or an
exhaustive search in the feature sets without evaluating the relevance of each individual feature included in the
classifier. As a consequence, the results obtained by these models can be suboptimal and difficult to interpret.
In this work, feature selection techniques are considered to extract optimal feature subsets for state of the art
ECG classification models. The performances are evaluated on real ambulatory recordings and compared to
previously reported feature choices using the same models. Results indicate that a small number of individual
features actually serve the classification and that better performances can be achieved by removing useless
features.
1 INTRODUCTION
The diagnosis of cardiac pathologies requires moni-
toring the cardiac function by recording and process-
ing the electrocardiogram (ECG) signal. The diagno-
sis may rely on just a few transient factors of short
duration such as intermittent arrhythmia; long-term
ECG recordings are therefore usually required. The
manual analysis of such long-term ECG signals, con-
taining hundreds to thousands of heart beats to evalu-
ate proves tedious and error-prone.
Several computer-aided heart beat classification
algorithms have recently been proposed for this task.
These algorithms can be divided in two categories:
inter-patient or intra-patient classification systems
(De Lannoy et al., 2010). Intra-patient classification
requires labeled beats from the tested patient in the
training of the model. By contrast, inter-patient mod-
els classify the beats of a new tested patient accord-
ing to a reference database built from data coming
from previously diagnosed patients. In real situations,
labeled beats are usually not timely available for a
new patient which makes the intra-patient classifica-
tion not applicable. For this reason, this work focuses
on inter-patient classification.
The first study to establish a reliable inter-patient
classification methodology is (Chazal et al., 2004),
where a weighted linear discriminant analysis (LDA)
model is trained to classify the beats in the four
classes defined by the standards of the AAMI (As-
sociation for the Advancement of Medical Instru-
mentation, 1998). In (Park et al., 2008), hierarchi-
cal SVMs are considered and in (De Lannoy et al.,
2010), a support vector machine classifier optmizing
a weighted cost function is introduced. These studies
perform feature selection using either domain knowl-
edge (Park et al., 2008) or an exhaustive search at the
group level (De Lannoy et al., 2010; Chazal et al.,
2004) without evaluating the relevance of each indi-
vidual feature included in the classifier. Furthermore,
distinct features groups are considered in each study
which makes it difficult to assess their discriminative
power on a fair basis.
As a consequence, the results obtained by these
models can be suboptimal; indeed it has been shown
in many classification tasks that spurious features
can harm the classifier, especially in the presence of
unbalanced classes and a large number of features
(Franc¸ois, 2008; Nguyen et al., 2009). Moreover, fea-
ture selection serves the interpretability of the classi-
67
Doquire G., de Lannoy G., François D. and Verleysen M..
FEATURE SELECTION FOR INTER-PATIENT SUPERVISED HEART BEAT CLASSIFICATION.
DOI: 10.5220/0003163200670073
In Proceedings of the International Conference on Bio-inspired Systems and Signal Processing (BIOSIGNALS-2011), pages 67-73
ISBN: 978-989-8425-35-5
Copyright
c
2011 SCITEPRESS (Science and Technology Publications, Lda.)

fier, since discriminative features are identified. This
property is especially useful in medical applications
where the selected features may help to understand
the causes and the origin of the pathologies.
In this work, a large number of features previ-
ously proposed for heart beat classification are ex-
tracted and two feature selection methods are inves-
tigated to select optimal feature subsets: the wrapper
and the filter approaches. Experiments are conducted
on real ambulatory signals from the MIT arrhythmia
database. Section 2 provides a short overview of the
theoretical background on the methods used in this
work. Section 3 details the database used in the exper-
iments and the processing of the ECG signals. Section
4 details the experiments and presents the results.
2 THEORETICAL BACKGROUND
Let us define the ith p-dimensional observation x
i
=
{x
1
i
,x
2
i
,...,x
p
i
} and the associated class value y
i
for a
given heart beat i with i ranging from 1 to N, N being
the total number of heart beats in the dataset. Tra-
ditional classifiers optimizing the accuracy make the
hidden assumption that the classes are equally bal-
anced (Nguyen et al., 2009). However, in a heart
beat classification task, around 90% of beats are nor-
mal beats while all the pathological classes represent
the other 10%. For this reason, weights have to be
introduced in the classifier to handle that situation.
Two distinct models are considered in this work: the
weighted LDA model (Chazal et al., 2004) and the
weighted SVM model (De Lannoy et al., 2010).
2.1 Weighted LDA
Let us first define the mean class vectors µ
k
and the
covariance matrix Σ of the features as
µ
k
=
∑
i∈k
x
i
N
k
(1)
Σ =
∑
K
k=1
w
k
∑
i∈k
(x
i
− µ
k
)(x
i
− µ
k
)
T
∑
K
k=1
w
k
N
k
(2)
where N
k
is the number of elements in class k, the
sum over i ∈ k denotes the beats belonging to class k,
and the w
k
values are the weights introduced in the
covariance matrix to handle the class imbalance.
The weighted LDA is a linear classifier that clas-
sifies the beats according to the estimated posterior
probabilities P(y = k|x) using
P(y = k|x) =
exp( f
k
(x))
∑
K
k=1
exp( f
k
(x))
(3)
where K is the total number of classes and
f
k
(x) = −(1/2)µ
T
k
Σ
−1
µ
k
+ µ
T
k
Σ
−1
x. (4)
2.2 Weighted SVM
SVMs are linear machines that rely on a preprocess-
ing to represent the features in a high dimension, typ-
ically much higher than the one of the original fea-
ture space. With an appropriate non-linear mapping
ϕ(x) to a sufficiently high-dimensional space, finite
data from two categories can indeed always be sepa-
rated by a hyperplane. In SVMs, this hyperplane is
chosen as the one with the largest margin. The two-
class SVM model for unbalanced data is described in
this section; it can be extended to multi-class tasks
by using the one-against-one or one-against-all ap-
proaches.
Assume each observation x
i
has been transformed
to z
i
= ϕ(x
i
). The soft-margin formulation of the
SVM allows examples to be misclassified or to lie in-
side the margin by introducing slack variables ξ
i
in
the problem constraints:
min.
w,b,ξ
1
2
||w||
2
+C.
N
N+
∑
{i|y
i
=1}
ξ
i
+
N
N−
∑
{i|y
i
=−1}
ξ
i
!
(5)
s.t.
y
i
(
h
w,z
i
i
+ b) ≥ 1 − ξ
i
∀i = 1..N
ξ
i
≥ 0 ∀i = 1..N
(6)
where w and b are the parameters of the hyperplane,
N
+
and N
−
denote respectively the number of posi-
tive and negative examples and C is a hyper-parameter
to be tuned. In this SVM formulation, different penal-
ties are introduced for each class in the objective func-
tion so that a convex approximation of the Balanced
Classification Rate (BCR) is optimized rather than the
accuray as in the classical SVM formulation. In the
dual form, the explicit form of the mapping function
ϕ must not be known as long as the kernel function
K(x
i
,x
j
) = ϕ(x
i
)ϕ(x
j
) is defined.
2.3 Mutual Information
The mutual information (MI), introduced by Shannon
in 1948 (Shannon, 1948), has proven to be a very ef-
fective criteria in the context of feature selection as
it is able to detect non-linear relationships between
(groups of) features. The MI of a pair of random vari-
ables X,Y is a symmetric measure of the dependence
between these two variables and is defined as:
MI(X,Y ) = H(X) + H(Y ) − H(X,Y ) (7)
where H(X) is the entropy of X . The entropy is de-
fined for a continuous random variable as:
H(X) = −
Z
f
X
(ζ
X
)log f
X
(ζ
X
) dζ
X
(8)
BIOSIGNALS 2011 - International Conference on Bio-inspired Systems and Signal Processing
68

where f
X
is the probability density function (pdf) of
X. The mutual information can then be rewritten as
I(X ;Y ) =
Z Z
f
X,Y
(ζ
X
,ζ
Y
)log
f
X,Y
(ζ
X
,ζ
Y
)
f
X
(ζ
X
) f
Y
(ζ
Y
)
dζ
X
dζ
Y
(9)
Unfortunately in practice neither f
X
, f
Y
nor f
X,Y
are known. The MI cannot thus be directly computed;
it has to be estimated from the available samples.
Several methods have been proposed for this task,
including a histogram based estimator (Moddemei-
jer, 1989), a Parzen-window based estimator (Steuer
et al., 2002) and a k-NN based estimator (Gomez-
Verdejo et al., 2009).
3 METHODOLOGY
Previous work on inter-patient heart beat classifica-
tion use features extracted from the heart beat signal
using either a priori knowledge or by comparing sev-
eral combinations of feature sets. There is thus a lack
of assessment of the relevance of indivual features.
In this work, two feature selection techniques are in-
vestigated to select the individual features serving the
classification task. A large number of features are
considered and compared on a fair basis. This section
introduces the methodology followed in our experi-
ments.
3.1 ECG Data
The standard MIT-BIH arrhythmia database (Gold-
berger et al., 2000) is used in the experiments. It
contains 48 half-hour long ambulatory recordings ob-
tained from 48 patients, for a total of approximatively
110’000 heart beats manually labeled into 15 distinct
beat types. According to the AAMI standards, the
four recordings including paced beats are rejected for
a total of 44 experimental recordings (Association for
the Advancement of Medical Instrumentation, 1998).
For each recording, two signals from two distinct
leads are available. The sampled ECG signals are
first filtered using the same filtering procedure as in
(Chazal et al., 2004; Park et al., 2008; De Lannoy
et al., 2010) to remove unwanted artifacts such as
baseline wanderings due to respiration, powerline in-
terference and other high frequency artifacts.
The 44 available recordings are divided in two
independent datasets of 22 recordings each with ap-
proximatively the same ratio of heart beats classes
(Chazal et al., 2004). The first dataset is the train-
ing set, and is used to build the model. The second
dataset is the test set, and is used to obtain an inde-
pendent measure of the performances of the classifier.
The R spike annotations provided with the
database are used as a marker to separate and iden-
tify the beats. The MIT-BIH heart beat labeled types
are then grouped according to the AAMI recommen-
dations into four more clinically relevant heart beat
classes (see Tab. 1 for grouping details). Table 2
shows the number of beats in each class and their fre-
quencies in the two datasets.
3.2 Feature Extraction
The popular feature groups previously proposed for
heart beat classification are extracted from the heart
beat time series: R-R intervals (used in almost all
previous works), segmentation intervals (Christov
et al., 2006; Chazal et al., 2004), morphological fea-
tures (Chazal et al., 2004; Melgani and Bazi, 2008),
Hermite basis function expansion coefficients (HBF)
(Lagerholm et al., 2000; Osowski et al., 2004; Park
et al., 2008) and higher order statistics (Osowski and
Hoai, 2001; Park et al., 2008). The following of this
section describes the features included in each of the
groups.
1. Segmentation Intervals (24 Features). The
ECG characteristic points, corresponding to the
onset and offset of P, QRS and T waves, are an-
notated using the standard ecgpuwave
1
segmenta-
tion software provided with the MIT-BIH arrhyth-
mia database. A large variety of 24 features are
then computed from the annotated characteristic
waves:
(a) QRS wave: flag, area, maximum, minimum,
positive area, negative area, standard devia-
tion, skewness, kurtosis, length, QR length, RS
length;
(b) P wave: flag, area, maximum, minimum,
length;
(c) T wave: flag, area, maximum, minimum,
length, QT length, ST length.
When the characteristic points needed to compute
a feature failed to be detected in the heart beat an-
notation step, the feature value is set to the pa-
tient’s mean feature value.
2. R-R Intervals (8 Features). This group consists
of four features built from the original R spike an-
notations provided with the MIT-BIH database;
the previous R-R interval, the next R-R interval,
1
See http://www.physionet.org/physiotools/software-
index.shtml
FEATURE SELECTION FOR INTER-PATIENT SUPERVISED HEART BEAT CLASSIFICATION
69

Table 1: Grouping of the MIT-BIH labeled heart beat types according to the AAMI standards.
Normal beats (N) Supraventricular ectopic
beats (S)
Ventricular ectopic beats
(V)
Fusion beats (F)
Normal beats Atrial premature beat Premature ventricular
contraction
Fusion of ventricular and
normal beats
Left bundle branch block
beats
Aberrated atrial prema-
ture beat
Ventricular escape beats
Right bundle branch
block beats
Nodal (junctional) pre-
mature beats
Atrial escape beats Supraventricular prema-
ture beats
Nodal (junctional) es-
pace beats
Table 2: Distribution of heart beat classes in the two independent datasets.
N S V F Total
Training 45809 942 3784 413 50948
89.91% 1.85% 7.43% 0.81% 100%
Test 44099 1836 3219 388 49542
89.01% 3.71% 6.50% 0.78% 100%
the average R-R interval in a window of 10 sur-
rouding R spikes and the signal mean R-R inter-
val. The same four features are also computed us-
ing the R spikes detected by the annotation algo-
rithm.
3. Morphological Features (19 Features). Ten fea-
tures are derived by uniformly sampling the ECG
amplitude in a window defined by the onset and
offset of the QRS complex, and nine other fea-
tures in a window defined by the QRS offset and
the T-wave offset. As the ECG signals were al-
ready sampled, linear interpolation was used to
estimate the intermediate values of the ECG am-
plitude. Here again, when the onset or offset
points needed to compute a feature were not de-
tected, the feature value is set to the patient’s mean
feature value.
4. HBF Coefficients (20 Features). The parameters
for computing the HBF expansion coefficients as
defined in (Park et al., 2008) are used. The order
of the Hermite polynomial is set to 20, and the
width parameter σ is estimated so as to minimize
the reconstruction error for each beat.
5. Higher Order Statistics (30 Features). The 2nd,
3rd and 4th order cumulant functions are com-
puted. The parameters as defined in (Osowski
et al., 2004) are used: the lag parameters range
from -250 msec to 250 msec centered on the R
spike and 10 equally spaced sample points of each
cumulant function are used as features, for a total
of 30 features.
6. Normalized R-R Intervals (6 Features). These
features correspond to the same features as in the
R-R interval group except that they are normal-
ized by their mean value for each patient. These
features are thus independent from the mean nor-
mal behavior of the heart of patients, which can
naturally be very different between individuals,
possibly misleading the classifier.
7. Normalized Segmentation Intervals (21 Fea-
tures). This group contains the same features
as in the segmentation group, except that they
are normalized by their mean value for each pa-
tient. The normalization is obviously not applied
to boolean segmentation features. Here again,
the objective is to make each feature independent
from the mean behavior of the heart of a patient,
because it can naturally be very different between
individuals.
Several studies have shown that using the infor-
mation from both leads can increase the classification
performances (Chazal et al., 2004; Llamedo-Soria
and Martinez, 2007); all features are therefore com-
puted independently on both leads (except the four R-
R intervals and the three normalized reference R-R in-
tervals computed from original annotations which are
common to both leads), for a total of 249 individual
features.
BIOSIGNALS 2011 - International Conference on Bio-inspired Systems and Signal Processing
70

3.3 Feature Selection
Feature selection can be achieved either by wrap-
per or filter approaches. The exhaustive wrapper ap-
proach consists in feeding a model with the 2
N−1
pos-
sible feature subsets (N being the total number of fea-
tures) and to choose the one for which the model per-
forms the best. The exhaustive wrapper approach is
therefore the optimal feature selection technique for
a given model. However, such an exhaustive search
is untractable in practice since it would require the
training (including the time-consuming optimization
of potential hyper-parameters) of 2
N−1
different mod-
els.
When simple and fast (e.g. linear) models are con-
sidered, one can nevertheless circumvent this issue by
using an incremental wrapper approach. One of the
most common incremental search procedures is the
forward selection algorithm. Its principle is to select
at each step the feature whose addition to the current
subset leads to the highest increase in prediction per-
formances. More precisely, the procedure usually be-
gins with the empty set of features. The first selected
feature is then the one which individually maximises
the performances of the model. The second step con-
sists in finding the feature from the feature set which
leads to the best increase in performance when com-
bined to the previously selected feature. The proce-
dure is repeated until no feature can increase the per-
formance anymore.
Although this incremental search is not guaranted
to converge to the selection of the optimal subset of
features, it has been proven to be very efficient in
practice and reduces the required number of models
to train from 2
N−1
to O(N). Since the training of the
weighted LDA model does not require the estimation
of any hyper-parameter and has a closed-form solu-
tion, a wrapper algorithm based on a forward search
strategy can be used for the weighted LDA classifier.
Wrapper approaches, when affordable, are often pref-
ered to filter approaches because they are expected to
produce better results since they are designed for a
specific model.
On the other hand, when it is not affordable to
train tens or hundreds of prediction models, feature
selection should rather be achieved by the filter ap-
proach. Filter approaches are based on a criterion in-
dependent of the performances of the model. Those
methods are thus much faster than wrapper proce-
dures and are well suited in conjunction with more
sophisticated (i.e. non-linear) models. For example,
if the one-against-one approach is used for the multi-
class weighted SVM classifier, N ∗ (N −1)/2 models
must be trained for one choice of features and each
model itself requires the tuning of two hyper-
parameters by cross-validation. In such situations,
even an incremental wrapper approach would be in-
tractable and a filter strategy must therefore be con-
sidered.
Since MI is able to detect relationships between
random variables and is naturally suitable for multi-
class problems, it is a powerful criterion for filter pro-
cedures. However, MI can detect non-linear relation-
ships and a linear classifier using the given features
could possibly fail in grasping the required non-linear
dicriminative information. For this reason, only the
weighted SVM model with a non-linear kernel should
be tested on the variables selected by the MI ranking
procedure.
4 EXPERIMENTS AND RESULTS
For the reasons detailed in Section 3.3, two distinct
approaches to the feature selection problem are fol-
lowed, depending on the complexity of the classifica-
tion model employed: a wrapper procedure with the
weighted LDA model using a forward search strat-
egy and a ranking procedure with the weighted SVM
model using the MI criterion. As in heart beat clas-
sification problems around 90% of data points corre-
spond to normal beats, a trivial model always predict-
ing the normal class would reach an accuracy of 90%.
The accuracy itself is thus not well suited for this
problem and the balanced classification rate (BCR)
is rather considered in this work (De Lannoy et al.,
2010). According to preliminary experiments and ex-
pert opinions, the maximum number of allowed fea-
tures is arbitrarily set to 10.
For the weighted LDA model, the weights are set
to the same values as in (Chazal et al., 2004). The
forward selection is performed on the training set and
the BCR obtained at each step on both the test set and
the training set is shown in Fig. 1. Altough a BCR of
more than 80% can be reached on the training set, the
best performance achieved on the test set is a BCR of
73% with only two features.
As far as the weighted SVM model is considered,
the one-against-one approach is used for multi-class
classification and the polynomial kernel is used to
achieve non-linear predictions. The weights for the
class imbalance in the cost function are set to the same
values as in (De Lannoy et al., 2010). A leave-one-
patient-out cross-validation procedure is used on the
training set to find the best regularization and kernel
parameter values. The MI value between each feature
and the class labels is computed using a histogram-
based estimator (Moddemeijer, 1989) on the training
FEATURE SELECTION FOR INTER-PATIENT SUPERVISED HEART BEAT CLASSIFICATION
71
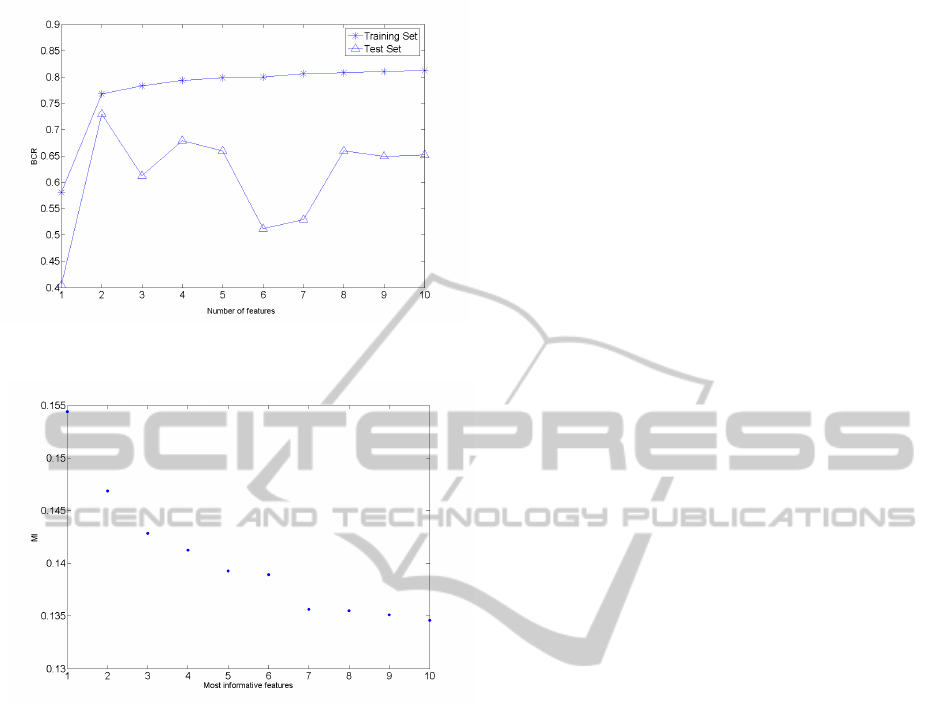
Figure 1: BCR obtained with the LDA and a forward wrap-
per feature selection procedure.
Figure 2: MI of the ten most informative features with the
class labels.
set to score the features.
It is important to note that unlike the correlation,
the MI is not bounded and the choice of the sig-
nificantly informative features is not straightforward
(Steuer et al., 2002). For this reason, and in order to
keep the computational time reasonable, the number
of features is chosen by looking at the sorted MI val-
ues for the 10 most informative features as shown in
Fig. 2. It can observed in Fig. 2 that a number of six
features seems to be a good choice.
Table 3 summarizes the performances achieved by
the two feature selection approaches together with the
performances obtained with previously reported fea-
ture choices for the same models. The classification
accuracy for each class is presented, together with the
BCR.
The results in Tab. 3 show that performing feature
selection is of great importance, since the weighted
SVM with only 6 features significantly outperforms
all other classification procedures with up to 50 fea-
tures. As far as linear classification is concerned, an
improvement of less than 1% of BCR can be achieved
by using 50 features instead of only the 2 features se-
lected by the wrapper method.
From the 6 features selected with the MI criterion,
the first one is the normalized previous R-R interval,
the second one is the normalized height of the T-wave
and the last four ones are high-order statistics. This is
in accordance with (De Lannoy et al., 2010), were the
best performances are obtained using R-R, normal-
ized R-R and HOS feature sets and the second best
performances with normalized interval features.
It is important to note that the performances re-
ported in Tab. 3 are different to the ones published in
(Chazal et al., 2004) and in (De Lannoy et al., 2010).
This can be explained by differences in methodolo-
gies. In (Chazal et al., 2004), the authors made a
tremendous work by manually correcting all the R
spike annotations. Since the R-R features are clearly
one of the most important features, this may explain
the differences in performances. However, manually
annotating all the signal is a time consuming pro-
cess which is not affordable in practice when thou-
sands of beats have to be evaluated. The difference
in performance with (De Lannoy et al., 2010) can
be explained by the fact that the authors select the
hyper-parameters of the SVM by measuring the per-
formances directly on the test set rather than a by us-
ing a cross-validation procedure on the training set
which is a less advantageous but more realistic situ-
ation.
5 CONCLUSIONS
The selection of discriminative features is of great im-
portance to help interpreting models and to increase
the performances by removing spurious features. In
this work, two feature selection strategies are evalu-
ated on real ambulatory recordings. The first one is
a incremental wrapper procedure and the second one
is a filter approach. The wrapper is expected to per-
form better than the filter for a given model but re-
quires a large number of trainings. As a consequence,
it can only be affordable for models where no hyper-
parameter has to be tuned by cross-validation or for
models having a closed form training solution.
For this reason, the wrapper method is used with a
weighted LDA model using a forward search strategy.
Results show that the best performances on the test
set are obtained with only two features. These results
are similar to the performances of the same model us-
ing previously reported feature selection, where up to
50 features where required to attain the same perfor-
mances.
The ranking approach is used in conjunction with
BIOSIGNALS 2011 - International Conference on Bio-inspired Systems and Signal Processing
72

Table 3: Classification performances of the two feature selection methods compared to previously reported feature choices.
Model Feature selection Features BCR N S V F
wLDA Wrapper wLDA 2 73.00% 81.88% 70.53% 70.77% 68.81%
wLDA (Chazal et al., 2004) 50 73.83% 88.63% 44.66% 80.58% 81.44%
wSVM Ranking MI 6 82.99% 75.88% 82.63% 85.06% 88.40%
wSVM (De Lannoy et al., 2010) 36 71.55% 77.54% 42.86% 79.19% 86.60%
the weighted SVM classifier and the MI criteria to
score the features. Six features are empirically se-
lected from the ranking results. Results with the
weighted SVM classifier using only these 6 features
are significantly higher than the performances with
the same model using previously reported feature
choices with up to 36 features. In particular, the accu-
racy for the S class is improved by almost 40%. The
six selected features are the normalized previous R-R
interval, the normalized height of the T-wave and four
high order statistics.
ACKNOWLEDGEMENTS
G. Doquire and G. de Lannoy are funded by a Belgian
F.R.I.A grant.
REFERENCES
Association for the Advancement of Medical Instrumenta-
tion (1998). Testing and reporting performance results
of cardiac rhythm and st segment measurement algo-
rithms. ANSI/AAMI EC38:1998.
Chazal, P. D., O’Dwyer, M., and Reilly, R. B. (2004). Auto-
matic classification of heartbeats using ecg morphol-
ogy and heartbeat interval features. Biomedical Engi-
neering, IEEE Transactions on, 51:1196–1206.
Christov, I., G
´
omez-Herrero, G., Krasteva, V., Jekova, I.,
Gotchev, A., and Egiazarian, K. (2006). Comparative
study of morphological and time-frequency ecg de-
scriptors for heartbeat classification. Med. Eng. Phys.,
28(9):876–887.
De Lannoy, G., Francois, D., Delbeke, J., and Verleysen, M.
(2010). Weighted svms and feature relevance assess-
ment in supervised heart beat classification. Commu-
nications in Computer and Information Science (Se-
lected and extended papers of the BIOSIGNALS2010
conference), TO APPEAR.
Franc¸ois, D. (2008). Feature selection. In Wang, J., ed-
itor, Encyclopedia of data mining and warehousing,
second edition, Information Science Reference. Idea
Group Publishing.
Goldberger, A., Amaral, L., Glass, L., Hausdorff, J., Ivanov,
P. C., Mark, R., Mietus, J., Moody, G., Peng, C.-K.,
and Stanley, H. (2000). PhysioBank, PhysioToolkit,
and PhysioNet: Components of a new research re-
source for complex physiologic signals. Circulation,
101(23):e215–e220.
Gomez-Verdejo, V., Verleysen, M., and Fleury, J. (2009).
Information-theoretic feature selection for functional
data classification. NEUROCOMPUTING, 72(16-18,
Sp. Iss. SI):3580–3589.
Lagerholm, M., Peterson, C., Braccini, G., Edenbrandt,
L., and Sornmo, L. (2000). Clustering ecg com-
plexes using hermite functions and self-organizing
maps. Biomedical Engineering, IEEE Transactions
on, 47(7):838–848.
Llamedo-Soria, M. and Martinez, J. (2007). An ecg classi-
fication model based on multilead wavelet transform
features”. In Computers in Cardiology, volume 35.
Melgani, F. and Bazi, Y. (2008). Classification of electro-
cardiogram signals with support vector machines and
particle swarm optimization. Information Technology
in Biomedicine, IEEE Transactions on, 12(5):667–
677.
Moddemeijer, R. (1989). On estimation of entropy and mu-
tual information of continuous distributions. Signal
Processing, 16(3):233–246.
Nguyen, G. H., Bouzerdoum, A., and L., P. S. (2009).
Learning Pattern Classification Tasks with Imbal-
anced Data Sets. INTECH.
Osowski, S. and Hoai, L. (2001). Ecg beat recognition us-
ing fuzzy hybrid neural network. Biomedical Engi-
neering, IEEE Transactions on, 48(11):1265–1271.
Osowski, S., Hoai, L., and Markiewicz, T. (2004). Sup-
port vector machine-based expert system for reliable
heartbeat recognition. Biomedical Engineering, IEEE
Transactions on, 51(4):582–589.
Park, K., Cho, B., Lee, D., Song, S., Lee, J., Chee, Y., Kim,
I., and Kim, S. (2008). Hierarchical support vector
machine based heartbeat classification using higher
order statistics and hermite basis function. In Com-
puters in Cardiology, pages 229–232.
Shannon, C. E. (1948). A mathematical theory of com-
munication. Bell Systems Technical Journal, 27:379–
423,623–656.
Steuer, R., Kurths, J., Daub, C. O., Weise, J., and Selbig, J.
(2002). The mutual information: Detecting and eval-
uating dependencies between variables. Bioinformat-
ics, 18(suppl 2):S231–240.
FEATURE SELECTION FOR INTER-PATIENT SUPERVISED HEART BEAT CLASSIFICATION
73
