
COLLECTIVE PERCEPTION IN A SWARM
OF AUTONOMOUS ROBOTS
Giuseppe Morlino, Vito Trianni and Elio Tuci
Institute of Cognitive Sciences and Technology, National Research Council
Via San Martino della Battaglia 44, 00185 Rome, Italy
Keywords:
Swarm robotics, Collective behaviour, Perceptual discrimination, Evolutionary algorithms, Artificial neural
networks.
Abstract:
We present a study that aims at understanding how perception can be the result of a collective, self-organising
process. A group of robots is placed in an environment characterized by black spots painted on the ground.
The density of the spots can vary from trial to trial, and robots have to collectively encode such density into a
coherent flashing activity. Overall, robots should prove capable of perceiving the global density by exploiting
only local information and robot-robot interactions. We show how we can synthesize individual controllers
that allow collective perception by exploiting evolutionary robotics techniques. This work is a first attempt to
study cognitive abilities such as perception, decision-making, or attention in a synthetic setup as result of a
collective, self-organising process.
1 INTRODUCTION
How can a distributed system collectively encode the
magnitude of a macroscopic variable? This ques-
tion holds over multiple domains, and at different
scales. First and foremost, in the context of cognitive
neuroscience, this question can be reformulated as:
what are the neural mechanisms underlying percep-
tion? This is a fundamental question, which must be
answered first in order to lay the foundations for fur-
ther investigations on other cognitive processes, such
as decision-making, attention or learning. For this
reason, the literature abounds of models about neural
coding of every sort of stimuli, from the basic ones—
e.g., vibro-tactile or visual stimuli (Romo and Sali-
nas, 2003; Loffler, 2008)—to more complex percep-
tual conditions—e.g., multi-stability, face recognition
or numbers (Leopold and Logothetis, 1996; Rubin,
2003; Grill-Spector, 2003; Dehaene, 2003).
The problem of suitably encoding environmental
stimuli, however, does not pertain exclusively indi-
vidual animals, but is of fundamental importance also
for collective systems, such as bird flocks and honey-
bee swarms. Similar systems are often considered as
super-organisms, due to their high cohesion and inte-
grated functioning (H¨olldobler and Wilson, 2008; De-
train and Deneubourg, 2006). It is therefore interest-
ing to look at how super-organisms can achieve a co-
herent perception of macroscopic features of the envi-
ronment they inhabit. For instance, while searching a
new nesting site, honeybees explore the environment
thanks to scouts that report their discoveries to the
nest. In there, a collective perception and a decision-
making process is carried on, which results in the
recognition and selection of the best site among the
discovered choices (Passino et al., 2008). In this pro-
cess, no single bee has the full picture. However, the
partial information of many bees is aggregated in the
nest and through a self-organising process decision-
making is successfully performed. (Passino et al.,
2008) recognise strong similarities between honey-
bees behaviour and the mechanisms that support per-
ception and decision-making in neural systems. In
particular, cross-inhibition within neural populations
is functionally similar to negative feedback between
bee workers committed to different nesting sites. The
parallel between cognitive systems and swarm be-
haviour goes beyond qualitative considerations. (Mar-
shall et al., 2009) compared the nest site selection
behaviour in ants and honeybees and the brain dy-
namics during decision making in a perceptual choice
task. They show that the swarm behaviour can be de-
scribed by the same model that was proposed for de-
cision making in (Ratcliff and Smith, 2004). As a
51
Morlino G., Trianni V. and Tuci E..
COLLECTIVE PERCEPTION IN A SWARM OF AUTONOMOUS ROBOTS.
DOI: 10.5220/0003075400510059
In Proceedings of the International Conference on Evolutionary Computation (ICEC-2010), pages 51-59
ISBN: 978-989-8425-31-7
Copyright
c
2010 SCITEPRESS (Science and Technology Publications, Lda.)

consequence, the two decision processes can be di-
rectly compared, and similarities can be drawn be-
tween cognition in the brain and in the swarm.
In this paper, we aim at studying collective per-
ception in a robotic swarm. The goal of this study is
understanding which are the self-organising processes
underlying the collective perception of a macroscopic
environmental feature, which is not accessible to the
individual robots due to their limited perceptual abil-
ities and due to the nature of their individual explo-
ration strategies. Therefore, multiple robots need to
interact in order to give a collective response that cor-
relates with the macroscopic variable. It is worth
noticing that the perceptual discrimination task em-
ployed could in principle be solved by a single robot,
given an effective exploration strategy and enough
time to accomplish it. The reason why we let a group
of robots to find a collective solution is because we
believe that the study of successful collective discrim-
ination strategies in this particular artificial scenario
may shed a light on the mechanisms of collective per-
ception in natural organisms.
In this robotic model, we synthesise the robot
neural controllers through evolutionary robotic tech-
niques, and we afterwards analyse the obtained results
in order to uncover the mechanisms that support the
collective perception process.
The usage of evolutionary techniques for collec-
tive and swarm robotics has been demonstrated in var-
ious recent studies. For instance, (Trianni and Nolfi,
2009) evolved self-organising synchronisation for a
group of robots that presented an individual periodic
behaviour, while (Sperati et al., 2010) showed how a
robotic swarm evolved through an evolutionary pro-
cess managed to collectively explore the environment
and forming a path to navigate between two target ar-
eas, which were too distant to be perceivedby a single
agent at the same time. (Hauert et al., 2009) exploited
artificial evolution to synthesise Swarming Micro Air
Vehicles (SAMVs) able to organise autonomously,re-
laying only on local informations, to estabilish a wire-
less communication network between users located
on the ground.
Our working hypothesis is that the evolutionary
process can produce optimal solutions to the given
task. Therefore, by analysing these solutions, we can
discover general mechanisms for collective percep-
tion, which are adapted to the experimental conditions
we have devised. This allows us to discuss the dis-
covered mechanisms with respect to known processes
performed by individuals and collectives.
2 EXPERIMENTAL SETUP
As mentioned above, in this paper we study how a
swarm of robots can collectively encode a macro-
scopic feature of the environment. We have set up
an experimental arena in which black circular spots
are painted on a grey background. The macroscopic
feature that must be encoded by the robotic swarm is
the density of black spots, which may vary from trial
to trial in the range d ∈ [0,1]. Robots can perceive the
colour of the ground only locally, through a noisy in-
frared sensor placed under their chassis. Robots can
emit flashing signals, which can be perceived by all
other robots. By combining the locally acquired infor-
mation through this kind of simple communication,
the group should encode the global density through
the frequency of the emitted signals: the higher the
density, the higher the frequency of the collective
flashing signal. In the following, we give the details
of the experimental setup and of the evolutionary al-
gorithm we used to synthesise the robot neural con-
trollers.
2.1 The robots and the Environment
Figure 1: Two snapshots of the simulated arena are shown.
The black disks spots are painted on a grey floor. The spots
are positioned on a grid of 40 × 40 cells. The density (i.e.
the probability to find a spot in a cell) varies in the range
[0,1] (left: d = 0.26, right: d = 0.66).
The experimental arena is square (side l = 2m) and
surrounded by walls. Circular black spots are painted
on the ground in order to probabilistically obtain a
desired global density. The spots are homogeneous in
colour and size (radius r = 2.5cm), and are aligned to
a square grid of 40 × 40 cells (see Fig. 1). The den-
sity d represents the probability that each cell of the
grid is filled with a black spot. Therefore, when the
density is 0, no spot is present and the arena ground
is completely grey; when the density is 1, the arena
is completely filled with black circular spots. In this
way, we can control the black spot density with a sin-
gle parameter, and we can create multiple instances
for the same macroscopic value.
ICEC 2010 - International Conference on Evolutionary Computation
52
Ten robots (radius 3.75cm) are randomly placed in
the environment. Each robot is equipped with two
wheels that provide a differential drive motion (maxi-
mum linear speed: v
max
= 8.2cm/s). Robots can per-
ceive walls and other obstacles by means of eight in-
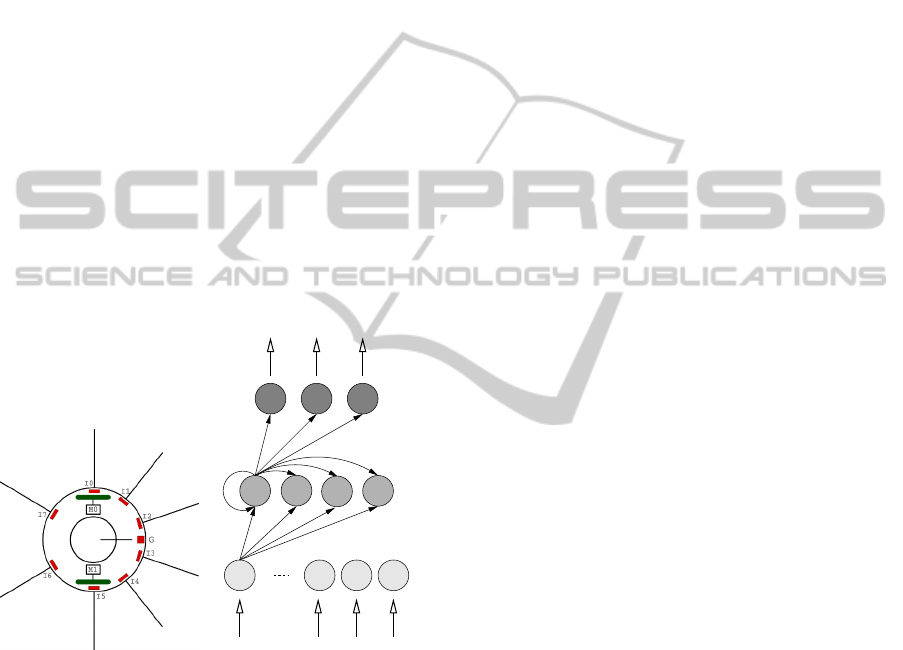
frared sensors placed around the turret (see Fig. 2).
The infrared sensors can be exploited for obstacle
avoidance. The ground colour is perceived through an
infrared sensor placed under the chassis of the robot,
in the front part (indicated by ‘G’ in Fig. 2). In the
absence of noise, the ground sensor returns 0 when is
over a black spot, and 0.5 when is over the grey back-
ground. Additionally, we make this sensor very unre-
liable by adding 30% white noise to the absolute sen-
sor reading. Finally, each robot r can emit a flashing
signal S
r
(t) switching on for a time-step (∆t = 0.1s)
the LEDs placed around its turret. This signal can be
perceived by all the other robots present in the envi-
ronment in a binary way: s(t) = 1 if there is at least
one robot r emitting a signal, otherwise s(t) = 0. A
robot can perceive the flashing signals through the
omni-directional camera, including the signals emit-
ted by the robot itself.
N
O,3
N
O,2
N
H,1
N
H,4
N
I,10
N
I,1
N
I,8
N
O,1
N
I,9
N
H,3
N
H,2
to actuators
from sensors
Figure 2: The robot and the neural controller. Left: a
schema of the simulated robot. Eight proximity sensors
(IR
0−7
) are positioned at 3.25cm from the ground pointing
horizontally. The sensors detect obstacles at a maximum
distance of ≈ 5cm. The floor colour is perceived through
an infrared sensor (G) positioned on the robots’ front and
pointing the floor. Right: the agents’ controller is a CTRNN
with 10 sensory neurons, 4 hidden and three motor units.
.
2.2 The Controller and the
Evolutionary Algorithm
Each robot is controlled by a continuous time recur-
rent neural network (CTRNN) (Beer, 1995). The
neural network has a multi-layer topology, as shown
in Fig. 2: neurons N
I,1
to N
I,10
take input from the
robot’s sensory apparatus, neurons N
O,1
to N
O,3
con-
trol the robot’s actuators, and neurons N
H,1
to N
H,4
form a fully recurrent continuous time hidden layer.
The input neurons are simple relay units, while the
output neurons are governed by the following equa-
tions:
o
j
= σ(O
j
+ β
j
), (1)
O
j
=
4
∑
i=1
W
O
ij
σ(H
i
+ β
i
), (2)
σ(z) = (1+ e
−z
)
−1
, (3)
where, using terms derived from an analogy with real
neurons, O
j
and H
i
are the cell potentials of respec-
tively output neuron j and hidden neuron i, β
j
and β
i
are bias terms,W
O
ij
is the strength of the synaptic con-
nection from hidden neuron i to output neuron j, and
o
j
and h
i
= σ(H
i
+ β
i
) are the firing rates. The hidden
units are governed by the following equation:
τ
j
˙
H
j
= −H
j
+
4
∑
i=1
W
H
ij
σ(H
i
+ β
i
) +
10
∑
i=1
W
I
ij
I
i
, (4)
where τ
j
is the decay constant, W
H
ij
is the strength
of the synaptic connection from hidden neuron i to
hidden neuron j, W
I
ij
is the strength of the connec-
tion from input neuron i to hidden neuron j, and I
i
is
the intensity of the sensory perturbation on neuron i.
The weights of the connection between neurons, the
bias terms and the decay constants are genetically en-
coded parameters. Cell potentials are set to 0 each
time a network is initialised or reset. State equations
are integrated using the forward Euler method with an
integration step-size of 0.1 seconds.
Eight input neurons—N
I,1
to N
I,8
—are set from
the infrared sensors. Input neuron N
I,9
is set from the
ground sensor. Finally, input neuron N
I,10
is a binary
input set by the perception of the flashing signal s(t).
The neurons N
O,1
and N
O,2
are used to set the speed of
the robot’s wheels. Neuron N
O,3
is used to switch on
the LEDs. In order to emit a flashing signal that lasts a
single time-step, the LEDs are switched on only when
the neuron activation surpasses the threshold 0.5:
S
r
(t) = 1 ⇐⇒ o
3
(t) ≥ 0.5∧ o
3
(t − 1) < 0.5. (5)
This means that in order to flash again, the activation
o
3
of neuron N
O,3
must go belowthe threshold, and up
again. The minimum period for oscillations is there-
fore 2 time-steps, that is, 0.2s.
The free parameters of the robot’s neural con-
troller are encoded in a binary genotype, using 8 bits
for each real number. Evolution works on a popu-
lation of 100 randomly generated genotypes. After
evaluation of the fitness, the 20 best genotypes sur-
vive in the next generation (elitism), and reproduce
COLLECTIVE PERCEPTION IN A SWARM OF AUTONOMOUS ROBOTS
53

by generating four copies of their genes with a 2%
mutation probability of flipping each bit. The evolu-
tionary process lasts 5000 generations. During evolu-
tion, genotype parameters are constrained to remain
within the range [0,1]. They are mapped to produce
CTRNN parameters with the following ranges: con-
nection weights W
ij
∈ [−4,4]; biases β ∈ [−4, 4]; con-
cerning decay constants, the genetically encoded pa-
rameters are firstly mapped onto the range [−1,2] and
then exponentially mapped onto τ ∈ [10
−1
,10
2
]. The
lower bound of τ corresponds to the integration step
size used to update the controller; the upper bound is
arbitrarily chosen.
2.3 The Fitness Function
A genotype is translated into N = 10 identical neu-
ral controllers which are downloaded onto N iden-
tical robots (i.e., the group is homogeneous). Each
group of robots is tested for 20 trials, which last either
1000 or 2000 time-steps (one time-step corresponds
to 0.1s). The density is varied systematically, mak-
ing the group experience 20 different values, equally
distributed in [0, 1]. The robots’ neural controllers
are not reset from trial to trial, therefore the order in
which trials are presented is relevant. At each fitness
evaluation, we randomly shuffle the sequence of en-
vironments experienced by the same group, in order
to remove regularities that could be exploited by spu-
rious behaviours. In order to evaluate the fitness of
s(t)
T T T
i+2i i+1
flashing event i flashing event i+1
Figure 3: Schematic representation of the collective flashing
signal, through which the group of robots encodes the black
spot density.
a genotype, we measure how well the corresponding
robotic group encodes the black spot density d. To
do so, we demand that robots as a group display a
periodic flashing activity with a frequency that corre-
lates with the black spot density. The group flashing
activity is measured on the global signal s(t) that re-
sults from the coupled activity of each robot. When
robots flash in subsequent time-steps, their signals are
perceived as a single flashing event (i.e., a sequence
of consecutive flashes is perceived as a square signal,
see Fig. 3). We measure the period T
i
as the time be-
tween the start of two subsequent events. In this way,
we obtain a series of inter-flash periods that we use to
compute the fitness. First of all, we compute through
an exponential moving average the average period
ˆ
T
and the average difference between two consecutive
periods ∆T:
ˆ
T = α
ˆ
T + (1− α)T
i
, (6)
∆T = α∆T + (1− α)|T
i
− T
i−1
|, (7)
where α = 0.9 is the time constant of the moving av-
erage. At the end of the trial θ,
ˆ
T should encode the
density. We measure the encoded density by linearly
scaling the average period:
d
enc
=
T
M
−
ˆ
T
T
M
− T
m
, (8)
where T
M
= 5s and T
m
= 1s are respectively the max-
imum and minimum periods, arbitrarily chosen. Fi-
nally, the two fitness components are computed: F
θ
d
rewards the group for suitably encoding the black spot
density:
F
θ
d
= Φ(1.0− |d − d
enc
|), (9)
where Φ(x) is a piecewise linear function that simply
constrains the fitness value in the interval [0,1]. This
component therefore rewards the group for minimis-
ing the difference between the black spot density and
the group encoded density. However, it does not as-
sure that the system converges towards a periodic sig-
nalling. For this purpose, a second fitness component
is computed, that minimises the difference between
consecutive periods:
F
θ
∆
= Φ(1.0−
∆T
∆T
M
), (10)
where ∆T
M
= 2s is the maximum difference allowed.
By minimising the difference among consecutive pe-
riods, the system is rewarded to produce periodic sig-
nals. Finally, the fitness of a genotype is the product
of the two fitness components, averaged over multiple
trials:
F =
20
∑
θ=1
F
θ
d
· F
θ
∆
. (11)
A trial is stopped and the fitness is zero when no flash-
ing event is detected within the last 10s, therefore pro-
moting a sustained flashing activity during the whole
trial. Similarly, a trial is stopped if any robot collides
with another robot or with a wall, and the fitness is
zero for that trial. This indirect selective pressure al-
lows to evolve obstacle avoidance.
3 RESULTS
We have performed 20 evolutionary runs for 5000
generations. For each evolutionary run, we selected
ICEC 2010 - International Conference on Evolutionary Computation
54
0 0.04 0.1 0.14 0.2 0.24 0.3 0.34 0.4 0.44 0.5 0.54 0.6 0.64 0.7 0.74 0.8 0.84 0.9 0.94
0.0 0.2 0.4 0.6 0.8 1.0
real density
performance / encoded density
Fitness
Comp1: Density
Comp2: Regularity
Encoded Density
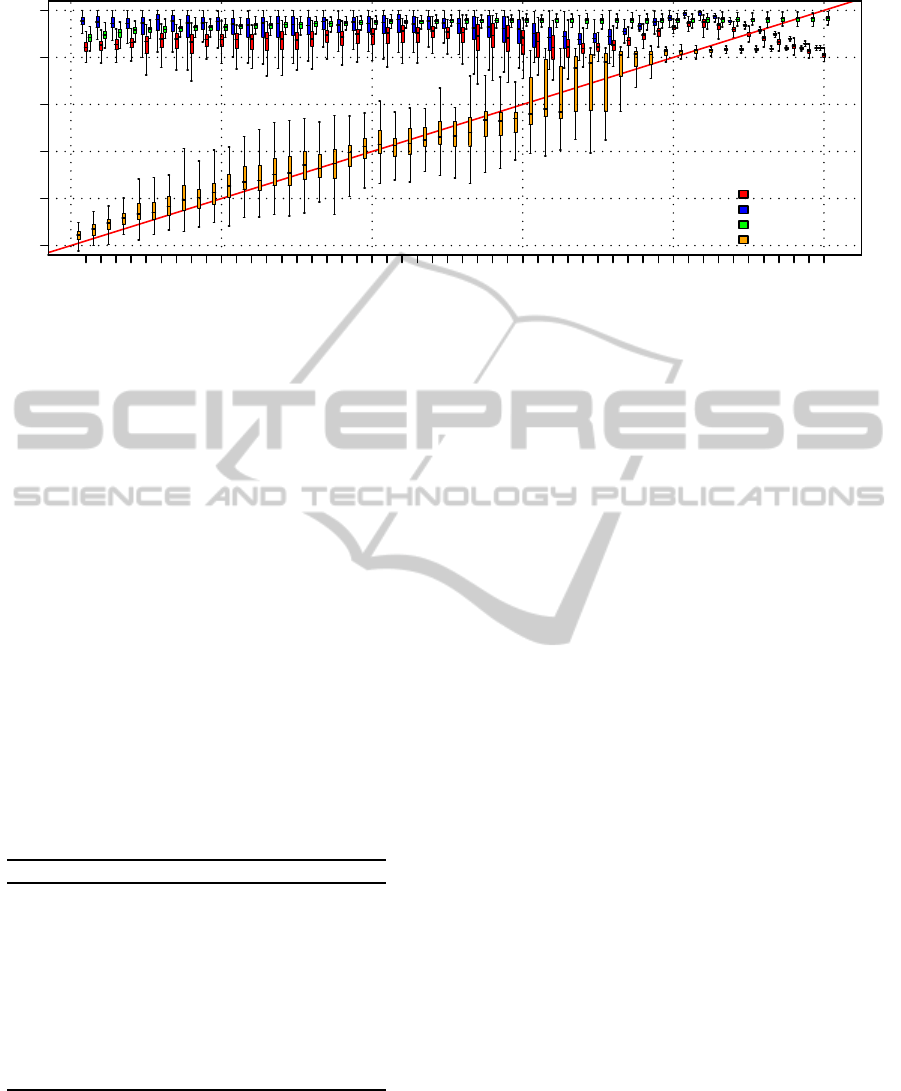
Figure 4: Generalisation test for the excitatory strategy. Boxes represent the inter-quartile range of the data, while the hori-
zontal lines inside the boxes mark the median values. The whiskers extend to the most extreme data points within 1.5 times
the inter-quartile range from the box. The empty circles mark the outliers.
a single genotype to be further analysed. To this
aim, we evaluated the performance of the 20 best
individuals of the last generation, measuring the fit-
ness over 100 trials for each of the 20 density val-
ues (2000 trials in total), and we selected the geno-
type with the highest mean performance to represent
the evolutionary run. Among the selected genotypes,
9 out of 20 resulted in a good collective behaviour
while the remaining ones resulted in sub-optimal so-
lutions, in which the group always converged to a
fixed signalling frequency, therefore failing to suit-
ably encode the black spot density. The performance
of the best genotypes is presented in Table 1. Despite
Table 1: Performance of the genotypes that result in a good
collective perception behaviour. Data are sorted in decreas-
ing order and, for each column, the mean and standard de-
viation are shown. The columns represent the fitness F and
the the two components F
d
and F
∆
.
run F F
d
F
∆
4 0.87±0.06 0.92±0.06 0.95±0.02
19 0.85±0.08 0.92±0.08 0.93±0.04
14 0.84±0.07 0.89±0.08 0.94±0.03
9 0.83±0.07 0.92±0.06 0.91±0.05
20 0.83±0.08 0.92±0.07 0.90±0.05
10 0.82±0.06 0.91±0.07 0.90±0.03
15 0.81±0.07 0.88±0.08 0.92±0.03
3 0.80±0.10 0.85±0.11 0.94±0.03
13 0.80±0.07 0.89±0.08 0.89±0.04
the variability in performance, the behaviours evolved
in different evolutionary runs are qualitatively simi-
lar: robots mainly rotate on the spot, in some cases
slightly moving away from the initial position. While
rotating on the spot, the ground sensor positioned on
the robot front gives a very local and noisy estimate
of the ground colour. The ground information is in-
tegrated over time, and modulates an internal oscil-
lator that allows to tune the frequency of a periodic
signalling. However, this frequency is related just to
the local density perceived by the robot, which may
be significantly different from the global density: in
fact, an individual robot rotating in one place can per-
ceive only a limited number of different ground pat-
terns, which do not represent well the global density,
above all for intermediate density values. Moreover,
the 30% white noise of the ground sensor makes it dif-
ficult to have even a good and stable local perception.
For these reasons, robots have to coordinate to bet-
ter estimate the global density, and to do so, they can
exploit the flashing signals. By analysing the com-
munication strategies evolved in the different evolu-
tionary runs, we found that they can be grouped into
two classes. In some cases, the flashing signals are
excitatory, that is, signal reception anticipates or pro-
vokes the signal production. This is the case for the
behaviour evolved in runs 4, 9, 10 and 15. In the
other cases—namely, runs 3, 13, 14, 19 and 20—
flashing signals are inhibitory, that is, signal reception
prevents or delays the signal production. In order to
understand the mechanisms behind these two strate-
gies, we analyse the best performing genotype of each
class, namely the one obtained in run 4 for the exci-
tatory strategy, and the one obtained in run 19 for the
inhibitory one.
3.1 Analysis of the Excitatory Strategy
To better understand the properties of the evolved be-
haviour, we first perform a generalisation test that
aims at revealing how well the system behaves with
varying densities. For this purpose, we have recorded
COLLECTIVE PERCEPTION IN A SWARM OF AUTONOMOUS ROBOTS
55
the performance of the system over 50 different black
spot densities uniformly distributed in the range [0,1]
(200 trials per density value). The results are dis-
played in Fig. 4. Here, we plot the fitness F and the
two components F
d
and F
∆
for each density. More-
over, we also plot the encoded density d
enc
. The fig-
ure reveals that the system shows a good behaviour
for almost all densities. In average, performance F
oscillates in the interval [0.8,1.0]. Moreover, it is pos-
sible to observe that the component F
∆
is very high,
especially for high densities. This indicates that the
group is able to converge to a very regular flashing
activity, while for smaller values the period is nois-
ier. However, for small density values the component
F
d
is higher, revealing that the system performs better
in this conditions. The actual abilities of the robotic
group can be discussed looking at the encoded den-
sity d
enc
, which is plotted against the ideal case y = x.
We note that for densities up to d = 0.6, the encoded
density nicely follows the real one. For larger values,
however, a sort of phase transition occurs, in which
the robots present a fast signalling behaviour that en-
codes a density around 0.84.
0
0.5
1
600 700 800
0
0.5
1
600 700 800
time-step (t)
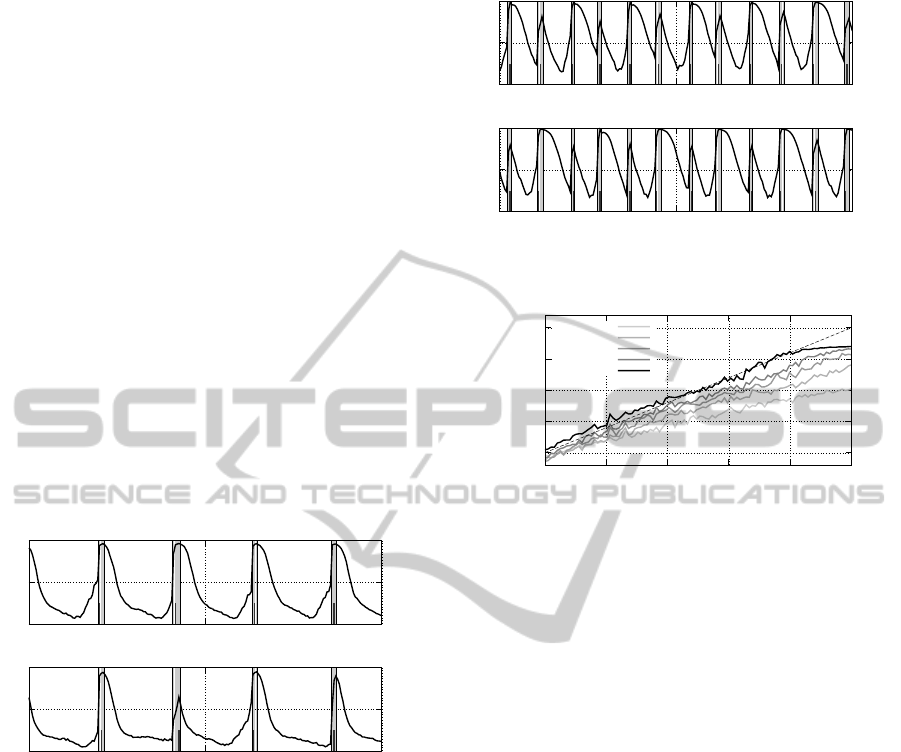
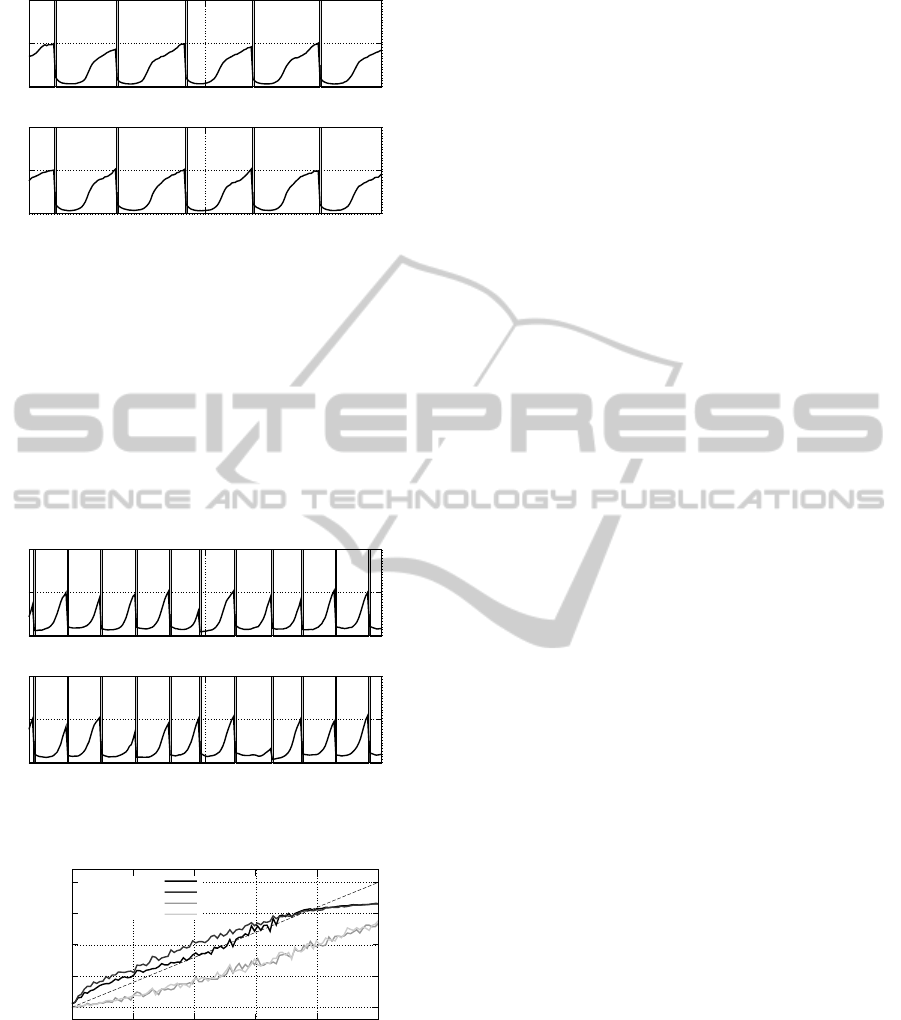
Figure 5: Excitatory strategy: neural activation and sig-
nalling status for two of the ten robots. The bold line in-
dicates the activation of the neuron N
O,3
, which controls the
flashing signal. The vertical grey bands indicate the per-
ceived signal s(t). The small dark vertical lines within the
grey band indicate the time-step in which the robot itself is
signalling. The plot refers to a density d = 0.2.
How can the robots produce such behaviour? We
answer this question by analysing the behavioural and
communication strategy. In this case, robots rotate on
the spot without changing position. By observing an
isolated robot, we noticed that the flashing activity is
regulated by the locally perceived density: the higher
the density, the higher the flashing frequency. How-
ever, the individual robot always underestimates the
real density, in average. Therefore a collective mech-
anism must be in place. As mentioned above, in the
excitatory strategy the reception of a signal provokes
the emission of a signal. The dynamics of the os-
0
0.5
1
600 700 800
0
0.5
1
600 700 800
time-step (t)
Figure 6: Excitatory strategy: neural activation for d = 0.8.
0
0.25
0.5
0.75
1
0 0.2 0.4 0.6 0.8 1
encoded density
density
1 robot
2 robots
3 robots
4 robots
10 robots
Figure 7: Encoded density for varying group size. Each
line represents the average of 100 trials, performed for 100
density values in [0, 1]. Data for 1, 2, 3, 4 and 10 robots are
shown.
cillation for a low density d = 0.2 can be observed
looking at Fig. 5. In correspondence of a perceived
signal, the activation o
3
of the neuron controlling the
signal output increases until it goes beyond the 0.5
threshold, making the robot itself signal. Upon the
sustained perception of a signal, the activation o
3
re-
mains high, therefore delaying the following flash.
For instance, in the first signalling event in Fig. 5, the
top robot flashes the earliest, and the persistence of
the signal afterwards delays the following flash. In-
stead, if more than one flash is required for o
3
to over-
come the signalling threshold, the following flash is
anticipated: the bottom plot reveals that in correspon-
dence of a very delayed flash—during the second sig-
nalling event—theactivation o
3
is just over the thresh-
old and goes immediately down afterwards, allowing
the robot to anticipate the following flash. The se-
quence of perceived flashes functions both as a pos-
itive and negative feedback mechanism: robots com-
pete in emitting the first flash, and consequentlymutu-
ally accelerate their rhythm. This acceleration is how-
ever limited by the presence of multiple signals that
slow the flashing frequency down. The same mech-
anism is in place for larger frequencies (see Fig. 6).
However, in this case the system converges into a dif-
ferent dynamic regime, in which robots differentiate
in two groups that alternately signal. This is evident in
the dynamics of the activation o
3
shown in Fig. 6: the
ICEC 2010 - International Conference on Evolutionary Computation
56
0 0.04 0.1 0.14 0.2 0.24 0.3 0.34 0.4 0.44 0.5 0.54 0.6 0.64 0.7 0.74 0.8 0.84 0.9 0.94
0.0 0.2 0.4 0.6 0.8 1.0
real density
performance / encoded density
Fitness
Comp1: Density
Comp2: Regularity
Encoded Density
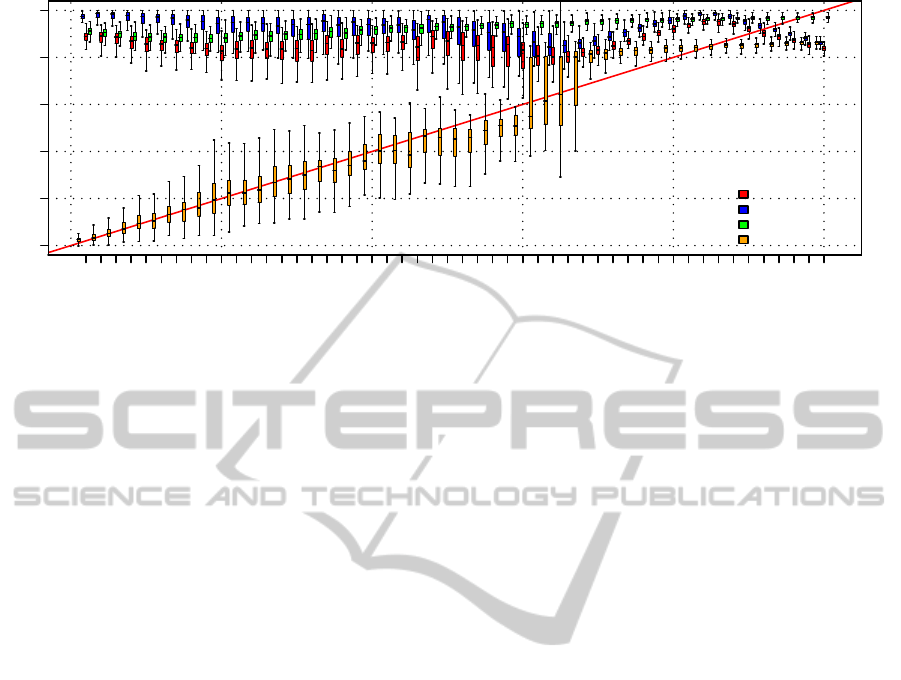
Figure 8: Generalisation test for the inhibitory strategy.
asymmetric oscillations indicate that robots engage in
a sort of turn-taking, achieving the maximum flashing
frequency. This also justifies the phase transition we
observed in Fig. 4: for high densities the probability
of converging into this fast flashing regime is higher.
In order to further test the hypothesis that robots com-
pete to emit the first signal, we run a series of experi-
ments varying the number of robots in the arena. The
results plotted in Fig. 7 show that the average encoded
density increases with the number of robots, thus sug-
gesting that robots are able to collectively accelerate
their flashing rhythm.
3.2 Analysis of the Inhibitory Strategy
In the case of the inhibitory strategy, we performed
similar analyses. The results of the generalisation test
are plotted in Fig. 8. It is possible to notice that the
system has a very similar performance with respect to
the excitatory case: the performance F
d
is very high
for each density, while F
∆
slightly increases for large
d. Therefore, also in this case the group converges
towards very regular and precise flashing activity, es-
pecially for high densities. Looking at d
enc
, it is pos-
sible to notice that the system presents a phase tran-
sition similar to the one discussed for the excitatory
strategy.
All these similarities, however, result from rad-
ically different mechanisms. As we already men-
tioned, in this case signals are inhibitory: when a
robot perceives a flash, the neural activity o
3
that con-
trols the flashing signal is reset, whatever its value
is. This means that there is normally only one robot
flashing at any time, that is, the one the reaches the
signalling threshold the earliest. This behaviour is ev-
ident looking at Fig. 9, in which the dynamics of the
neural activity of two different robots are plotted for a
density d = 0.2: the bottom plot reveals that the corre-
sponding robot flashes the earliest in the first four sig-
nalling events, preventing other robots to flash them-
selves. The situation is similar in the case of d = 0.8,
shown in Fig. 10, in which we observe that robots
compete in order to flash the earliest, similarly to what
happens for the excitatory strategy. However, in this
case the inhibitory signal does not allow a negative
feedback mechanism. In fact, if a robot flashes with
an individual frequency higher than the other robots
(e.g., the robot locally perceives a higher density), it
would impose its frequency to the group by inhibiting
all other robots. If this is the case, the group system-
atically overestimates the black spot density due to
those robots that locally perceive a high value. There-
fore there must exist another mechanism that serves
as negative feedback to control the frequency of the
group. By looking at the behaviour of the robots, we
notice that at the beginning of the trial robots slightly
move from their initial position while rotating on the
spot. This allows robots to explore the neighbour-
hood for a short time. In order to understand the
role of these movements, we tested the robotic system
fixing the motor outputs to constant values (o
1
= 1
and o
2
= 0), forcing the robots to turn on the spot
without changing position. The results are shown in
Fig. 11, for varying density and varying number of
robots. From these tests, we infer that the slight mo-
tion of the robots is an adaptive mechanisms, given
that the system without motion performs worse. As
predicted, when robots cannot search the neighbour-
hood of their initial position, they slightly overesti-
mate the density. We also observe that robots exploit
the information coming from other robots. In fact,
there is no difference between the performance of a
single robot when it can and when it cannot move.
This means that the motion alone does not allow a
single robot to better estimate the global density. We
therefore believe that the initial motion of the robots is
COLLECTIVE PERCEPTION IN A SWARM OF AUTONOMOUS ROBOTS
57
0
0.5
1
600 700 800
0
0.5
1
600 700 800
time-step (t)
Figure 9: Inhibitory strategy: neural activation for d = 0.2.
performed when there are discrepancies between the
locally perceived density and the global flashing ac-
tivity. In other words, a robot moves in search of a
local density that corresponds to the globally encoded
density. This is brought forth only for a short time
at the beginning of the trial. After this short time,
the robot stops in place, whatever the local density
is. With this mechanism, robots can average out the
global density.
0
0.5
1
600 700 800
0
0.5
1
600 700 800
time-step (t)
Figure 10: Inhibitory strategy: neural activation for d = 0.8.
0
0.25
0.5
0.75
1
0 0.2 0.4 0.6 0.8 1
encoded density
density
10 robots
10 robots NM
1 robot
1 robot NM
Figure 11: Encoded density for varying group size and for
blocked . Each line represents the average of 100 trials,
performed for 100 density values in [0,1]. Data for 1, 2, 3,
4 and 10 robots are shown.
4 DISCUSSIONS AND
CONCLUSION
In this paper, we have analysed how a group of robots
can collectively encode a macroscopic variable that is
not accessible to the single individuals in the group.
By evolving the collective perception behaviour, we
have found two possible strategies that use the com-
munication channel in a opposite way: signals are
either excitatory or inhibitory. In both cases, robots
compete in flashing the earliest. In doing so, they
share the information gathered locally, allowing to
collectively encode an average value close to the ac-
tual density.
It is important to remark the fact that, besides the
excitatory or inhibitory communicative interaction, a
second mechanism is necessary to regulate the ac-
tivities of the group. On the one hand, this mecha-
nism has been found in the length of the signalling
event, which limits robots in producing the first flash
for many times consecutively. On the other hand, we
observed that robots move from their initial position,
therefore exploring the neighbourhood. In both cases,
these regulatory mechanisms allow multiple robots to
participate in the collective perception in order to have
a better estimate of the macroscopic variable. It is
therefore possible to identify a general strategy that
supports the collective perception in our system: indi-
vidually, robots encode the local density in a flashing
frequency and compete in producing the first flash,
which is globally perceived and influences the whole
group. At the same time, robots try to hand on the
leader role and to listen to the other robots. The bal-
ancing of these two tendencies leads to the correct en-
coding of the global density.
The presence of two counteracting mechanisms
that regulate the activity of the group is common to
systems as diverse as brains and swarms. The positive
feedback loop allows to amplify small perturbations
and quickly spread information in a system, while
the negative feedback loop controls the competition
between different options and modulate the informa-
tion spreading. The relevance of the negative feed-
back is recognised in neural systems—in which it is
provided by specialised inhibitory inter-neurons and
mediated by glycine and gamma-aminobutyric acid
(GABA) transmitters (Jonas and Buzsaki, 2007)—
and in super-organisms—in which it may results
from specific stop signals issued by some individu-
als (Nieh, 2010). In our system, we have not pro-
vided a specific interaction modality different from
the flashing signals. Despite this limitation, evolu-
tion could synthesise other mechanisms that resulted
in regulatory processes.
ICEC 2010 - International Conference on Evolutionary Computation
58

In future work, we plan to continue the study
of cognitive abilities displayed by collective sys-
tems (Trianni and Tuci, 2009). The experimental
scenario we have presented here has been conceived
to investigate the collective perception and decision
making. We plan to study whether groups of robots
can select the most dense environment among two
or more possibilities presented sequentially or segre-
gated in space. By comparing the results obtained in
different artificial setups, we aim at discovering gen-
eral principles about collective perception and deci-
sion making that could be generalised also to the bio-
logical reality.
ACKNOWLEDGEMENTS
The authors thank the Institute of Cognitive Sci-
ences and Technology of the Italian National Re-
search Council for having funded the research work
presented in this paper. The authors also thank the
members of LARAL group for the constructive com-
ments during the early preparation of this research
work.
REFERENCES
Beer, R. D. (1995). A dynamical systems perspective on
agent-environment interaction. Art. Intell., 72:173–
215.
Dehaene, S. (2003). The neural basis of the weber-fechner
law: a logarithmic mental number line. Trends in Cog-
nitive Sciences, 7(4):145–147.
Detrain, C. and Deneubourg, J.-L. (2006). Self-organized
structures in a superorganism: do ants “behave” like
molecules? Physics of Life Reviews, 3:162–187.
Grill-Spector, K. (2003). The neural basis of object percep-
tion. Current Opinion in Neurobiology, 13(2):159–
166.
Hauert, S., Zufferey, J.-C., and Floreano, D. (2009).
Evolved swarming without positioning information:
an application in aerial communication relay. Au-
tonomous Robots, 26(1):21–32.
H¨olldobler, B. and Wilson, E. O. (2008). The Superorgan-
ism: The Beauty, Elegance, and Strangeness of Insect
Societies. W. W. Norton & Company, New York, NY.
Jonas, P. and Buzsaki, G. (2007). Neural inhibition. Schol-
arpedia, 2(9):3286.
Leopold, D. A. and Logothetis, N. K. (1996). Activity
changes in early visual cortex reflect monkeys per-
cept during binocular rivalry. Nature, 379:549–553.
Loffler, G. (2008). Perception of contours and shapes: Low
and intermediate stage mechanisms. Vision Research,
48:2106–2127.
Marshall, J. A. R., Bogacz, R., Dornhaus, A., Planqu´e, R.,
Kovacs, T., and Franks, N. R. (2009). On optimal
decision-making in brains and social insect colonies.
Journal of the Royal Society Interface, 6(40):1065–
1074.
Nieh, J. C. (2010). Negative feedback signal that is trig-
gered by peril curbs honey bee recruitment. Current
Biology, 20:310–315.
Passino, K., Seeley, T., and Visscher, P. (2008). Swarm
cognition in honey bees. Behavioral Ecology and So-
ciobiology, 62:401–414.
Ratcliff, R. and Smith, P. L. (2004). A comparison of
sequential sampling models for two-choice reaction
time. Psychological Review, 111:333–367.
Romo, R. and Salinas, E. (2003). Flutter discrimination:
neural codes, perception, memory and decision mak-
ing. Nature Reviews Neuroscience, 4:203–218.
Rubin, N. (2003). Binocular rivalry and perceptual multi-
stability. Trends in Neurosciences, 26(6):289–291.
Sperati, V., Trianni, V., and Nolfi, S. (2010). Evolution of
self-organised path formation in a swarm of robots.
In Proceedings of the 7th International Conference on
Swarm Intelligence (ANTS 2010). In press.
Trianni, V. and Nolfi, S. (2009). Self-organising sync in a
robotic swarm. a dynamical system view. IEEE Trans-
actions on Evolutionary Computation, Special Issue
on Swarm Intelligennce, 13(4):722–741.
Trianni, V. and Tuci, E. (2009). Swarm cognition and ar-
tificial life. In Advances in Artificial Life. Proceed-
ings of the 10th European Conference on Artificial
Life (ECAL 2009).
COLLECTIVE PERCEPTION IN A SWARM OF AUTONOMOUS ROBOTS
59
