
A METRIC FOR RANKING HIGH DIMENSIONAL SKYLINE
QUERIES
Marlene Goncalves
Simón Bolívar University, Computing Department, Caracas 1080-A, Venezuela
Graciela Perera
Youngstown State University, Computer Science and Information Systems Department, Youngstown OH. 44555, U.S.A.
Keywords: Database, Queries, Skyline, Skyline Frequency, Top-k, Metric.
Abstract: Skyline queries have been proposed to express user’s preferences. Since the size of Skyline set increases as
the number of criteria augments, it is necessary to rank high dimensional Skyline queries. In this work, we
propose a new metric to rank high dimensional Skylines which allows to identify the k most interesting
objects from the Skyline set (Top-k Skyline). We have empirically studied the variability and performance
of our metric. Our initial experimental results show that the metric is able to speed up the computation of
the Top-k Skyline in up to two orders of magnitude w.r.t. the state-of-the-art metric: Skyline Frequency.
1 INTRODUCTION
Currently, large amounts of data are made available
using novel technologies in databases and computer
networks such as Semantic Web, Grid, Semantic
Search, and Cloud and Peer-to-Peer computing. For
example, by the time this paper has been written at
least 24.07 billion pages are indexed by the Web (De
Kunder, 2010). The enormous growth in the size of
data has a direct impact on the performance of tasks
that process very large datasets and whose
complexity depends on the size of the input. Even a
very large subset from the input dataset may be
irrelevant for the answer.
Skyline queries enable user’s preferences to be
expressed naturally and may identify useful data
from datasets (Börzsönyi et al., 2001). Even though,
Skyline may be a good choice for huge data sets, its
cardinality may become very large as the number of
criteria or dimensions increases (Bentley et al.,
1978). Thus, the users have to be aware that a
possibly large subset of the Skyline can be irrelevant
and useless data must be manually discarded.
Nevertheless, the size of the answer for high
dimensional Skyline queries may be decreased.
Users could limit the number of dimensions but this
would require a domain knowledge expert. A better
solution is to efficiently identify which Skyline
tuples are the k most interesting. Thus, a function to
score the Skyline interestingness needs to be
applied. This function may be defined by the user as
a score function (Balke et al., 2004; Goncalves and
Vidal, 2005, 2009; Brando et al., 2007) or may be a
predefined ranking metric (Chan et al., 2006a; Chan
et al., 2006b; Lin et al., 2007).
We focus on ranking metrics based on subspaces,
such as Skyline Frequency metric (SFM) (Chan et
al., 2006a). In this work, we propose a less
expensive metric called Top-k Skyline Frequency
Metric (TKSFM). TKSFM can be very useful in
decision making applications that require a quick
and efficient ranking metric. With the help of
TKSFM, Skyline can be ranked according to
interestingness of the user’s criteria.
Finally, the remainder of this paper is organized
as follows. Section 2 introduces the basic
preliminary background information. Section 3
illustrates the SFM and the definition and
explanation of the TKSFM. In Section 4, we report
the results of our experimental study where the SFM
and TKSFM metrics are compared. Section 5 points
out conclusions and future work.
383
Goncalves M. and Perera G. (2010).
A METRIC FOR RANKING HIGH DIMENSIONAL SKYLINE QUERIES.
In Proceedings of the 12th International Conference on Enterprise Information Systems - Databases and Information Systems Integration, pages
383-386
DOI: 10.5220/0002904803830386
Copyright
c
SciTePress

2 PRELIMINARIES
In this section we present five formal definitions of
the basic concepts required to understand the
foundations of Skyline and Skyline metrics. For
these definitions we are assuming a space S on a set
of n dimensions {d
1
, …, d
n
}, a subspace S’ or non-
empty subset of the space S, and a dataset DS on S.
Also, we suppose a tuple t DS is represented as t =
(t
1
, …, t
n
) where t
i
is a real number on dimension d
i
.
For simplicity, we suppose all dimension will be
preferred if they have the highest values
(maximization).
Definition 1 (Dominance). A tuple t = (t
1
, …, t
n
)
DS dominates
another
tuple u = (u
1
, …, u
n
) DS if
(∀i | 1 i n : t
i
u
i
∧ (j | 1 j n : t
j
u
j
)).
Definition 2 (Skyline). The
Skyline
of a
space
S,
denoted as SKY
S
, is the set of the non-dominated
tuples on S.
Definition 3 (Skycube). The Skycube or lattice is the
set of the all Skylines for any subspace S’ of S, i.e.,
Skycube = {∪SKY
S’
| S’
⊆
S}
.
Definition 4 (Skyline Frequency). The Skyline
Frequency of a tuple t DS, denoted by sf(t), is the
number of subspaces S’ of S in which t is a Skyline
tuple, this is, sf(t) = (∑ S’ | S’ S
∧
t SKY
S’
: 1).
Since the Skyline can be huge (Chan et al.,
2006a), the Skyline needs to be ranked by a score
function to distinguish the top-k tuples in a set of
incomparable ones. A score function of a tuple t,
denoted as f(t), is a function that ranks the tuple t
inducing a totally ordered of the input dataset DS.
Definition 5 (Top-k Skyline). The Top-k Skyline
tuples of a space S, denoted by TKS
S
, are the k
Skyline tuples on S that no other Skyline tuple on S
may have higher score function value than them:
TKS
S
= {t | t SKY
S
∧ (
k-|SKYs|
u | u SKY
S
: f(u)
> f(t))}, where,
x
means that exists at most x
elements in the set.
The Skyline Frequency may be used as score
function to rank the Skyline. In (Chan et al., 2006a),
the Top-k Frequent Skyline tuples, denoted here by
TKFS, are defined as the k tuples in DS that no other
tuple in DS can have larger Skyline Frequency than
them: TKFS = {t | t SKY
S
∧ (
k-|SKYs|
u | u SKY
S
: sf(u) > sf(t))}.
3 SKYLINE METRICS
The three steps to compute the SFM metric are: 1)
The Skyline for each subspace of the multi-
dimensional criteria is computed; 2) The SFM of
each tuple t is calculated by summing up the
number of subspaces for which t is a Skyline tuple;
3) The Skyline is sorted by SFM values and the best
k tuples are returned.
Unfortunately, Skyline Frequency has two
disadvantages. On one hand, it may require to build
a lattice of skylines for each non-empty subset of a
multi-dimensional criteria, this is, 2d − 1 skylines
(Chan et al., 2006a). In this sense, several solutions
have been introduced to reduce cost of the lattice
computation. In (Chan et al., 2006a), the authors
proposed to estimate the Skyline Frequency values
with efficient approximated algorithms. (Yuan et al.,
2005; Pei et al., 2006) define algorithms to
efficiently calculate the Skycube or the lattice of
skylines by sharing computation of multiple related
Skyline subspaces.
On the other hand, Skyline Frequency benefits
those tuples that have the best value in at least one
dimension. Any tuple with this characteristic will
have a lower bound of 1+
1
1
1
d
d
i
i
when data
are not duplicated. According to Corollary 1 in
(Yuan et al, 2005), a tuple in a subspace s will be in
all subspaces for which subspace s is a subset. For
this reason, all of these tuples could have the same
Skyline Frequency value (little variability).
To introduce variability into SFM, we propose a
new metric called Top-k Skyline Frequency Metric
(TKSFM). The basis of the lattice for TKSFM is the
two-dimensional Skylines. Therefore, it does not
benefit those tuples with the best value in at least
one dimension as SFM does. Additionally, our
experimental study shows that our metric is less
expensive than SFM because it does not need to
build the whole Skyline for each subspace.
To exemplify the difference between TKSFM
and SFM, suppose a lattice for 4 dimensions: A, B,
C, and D, as shown in Figure 1. SFM value of a
tuple t is the number of times in which t is in a
subspace of the lattice. Since the Skyline for each
subspace must be calculated, the Skyline Frequency
computation is very costly (Chan et al., 2006a).
Instead of the skylines for each subspace of the
lattice, the lattice of the TKSFM is based on Top-k
Skyline subspaces. Thus, the evaluation cost of the
metric may be reduced because the Top-k Skyline is
computed instead of the whole Skyline set
(Goncalves and Vidal, 2009).
ICEIS 2010 - 12th International Conference on Enterprise Information Systems
384
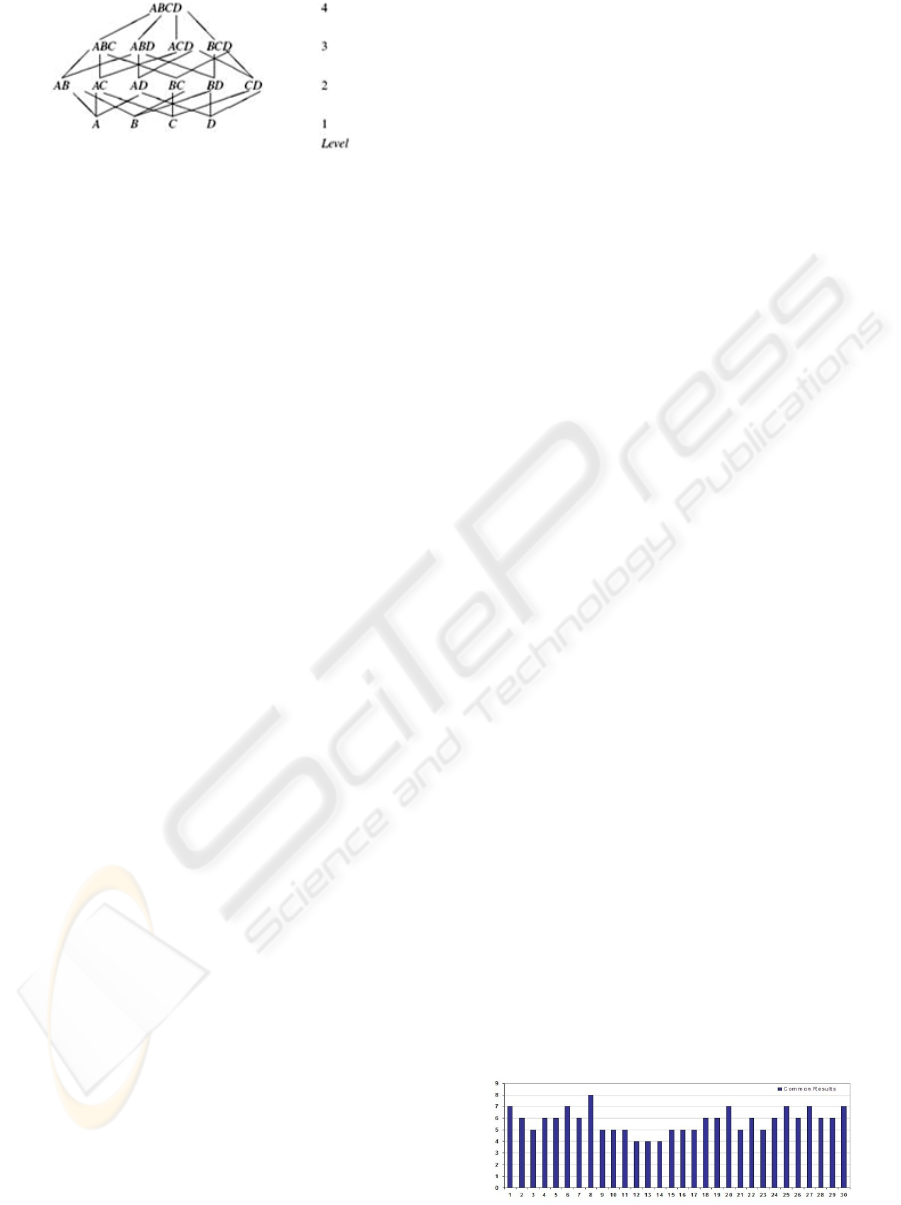
Figure 1: Lattice.
However, the Top-k Skyline subspaces require a
score function to rank the Skyline (Goncalves and
Vidal, 2009) in each subspace. We define this
function as the number of times in which a tuple
appears in any inferior subspace. Because the tuples
that have the best value in at least one dimension
could have the same Skyline Frequency value; we
decide that infimum of the lattice will be composed
of two-dimensional skylines to introduce variability
in our metric. Therefore, the basis of TKSFM is the
two-dimensional skylines at the lowest bound of the
lattice and Top-k Skyline for superior levels.
3.1 Formal Definition and
Computation
Given a space S defined by a set of n dimensions {d
1
,
…, d
n
},
we define the Top-k Skyline Frequency
Metric, denoted by TKSFM,
through the recurrence
given in the following definition.
Definition 6 (Top-k Skyline Frequency Metric).
(Base Case)
TKSFM
1
(t) =
(∑ S’ | S’ S
∧ |
S’
|
= 2
∧
t SKY
S’
: 1)
(
Inductive
Case)
TKSFM
i
(t) =
(∑ S’ | S’ S
∧ |
S’
|
= i+1
∧
t SKY
S’
∧
(
k-
|
SKYs’|
u | u SKY
S’
:
11
TKSFM (u) TKSFM (t)
11
mm
ii
mm
): 1)
where
2 i
n-1.
The three steps to compute the TKSFM metric
are: First, the Skyline for each two-dimensional
subspace is calculated (Base Case). Second, the Top-
k Skyline for each i-dimensional subspace is
calculated based on the frequency or the number of
times in which a tuple t appears in all m-dimensional
subspaces, where 0 < m < i, and 2 < i < n (Inductive
Case). Third, the best k tuples that have the highest
frequency will be returned.
4 EXPERIMENTAL STUDY
We conducted an experimental study to empirically
analyze the variability of the TKSFM with respect to
SFM, and we study performance of lattice
construction using each metric. The study was
performed on a table of 10,000 randomly generated
tuples. Each table contained an identifier and ten real
values ranged from 0.0 to 1.0. The attribute values
were generated following a uniform distribution.
We randomly generated 30 queries characterized
by the following properties: (a) only one table in the
FROM clause; (b) the attributes in the multi-
dimensional function were chosen randomly among
the attributes of the table; (c) the MAX directive was
selected; (d) the number of attributes of the multi-
dimensional function was between 7 and 10; (e) k
value was chose to be 10 and 50.
We show the number of tuples in common
between the two Top-k Skyline results obtained
from applying TSFM and SFM metrics (variability)
and time for constructing the lattice using both
metrics. Time was measured using the time Solaris
command.
The Bottom-Up Skycube (BUS) algorithm was
implemented in Java (64-bit JDK version 1.5.0 12).
BUS was proposed in (Yuan et al., 2005) to compute
Skyline Frequency values by building the Skycube.
We adapt BUS to calculate the TKSFM including
the recurrence given in Definition 5. On the other
hand, data were stored in relational tables using
Oracle 9i. The experiments were evaluated on a
SunFire V440 machine equipped with 2 processors
Sparcv9 of 1.281 MHZ, 16 GB of memory and 4
disks Ultra320 SCSI of 73 GB running on SunOS
5.10 (Solaris 10).
We studied the common results that are matched
by both metrics. Thus, we intersect the results sets
obtained from both metrics and are shown in Figure
2 and Figure 3. The graphics illustrated in the
figures show the number of common tuples retrieved
using both metrics for Top-10 Skyline and Top-50
Skyline queries, respectively. In general, the number
of common results using both metrics is between
40% and 80%. Thus, TKSFM introduces a
difference between 20% and 60% with respect to
SFM. This difference is because of SFM benefits
tuples characterized by the best value in at least one
dimension while the basis of TKSFM is two-
dimensional Skylines.
Figure 2: Number of Common Results for Top-10 Skyline
Queries.
A METRIC FOR RANKING HIGH DIMENSIONAL SKYLINE QUERIES
385
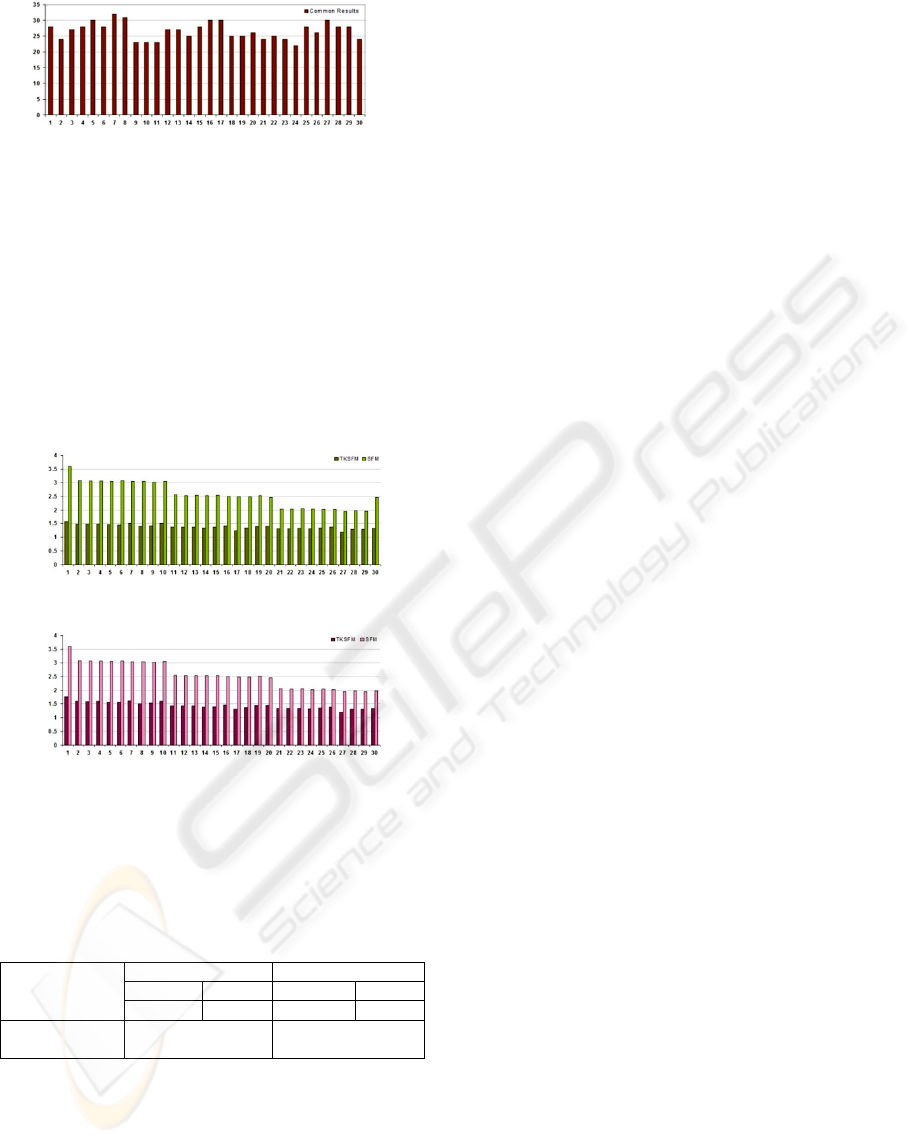
Figure 3: Number of Common Results for Top-50 Skyline
Queries.
Also, we studied the performance associated
with the lattice construction. Figure 4 and Figure 5
show the time required to build the lattice when
TKSFM and SFM are applied. We can observe that
time for TKSFM is up to two orders of magnitude
higher than SFM. This overhead for SFM is because
the algorithm computes the Skyline for each
subspace completely. Furthermore, between 40%
and 80% of the results obtained from TKSFM match
the results obtained from SFM in less time.
Figure 4: Time (seconds) for Top-10 Skyline Queries.
Figure 5: Time (seconds) for Top-50 Skyline Queries.
Finally, Table 1 shows the results for the t-test in
terms of time. As the analysis of the t-test shows, the
difference for time is highly significant (more than
99% level).
Table 1: t-test for time.
Average
k = 10 k = 50
TKSFM SFM TKSFM SFM
24.39 616.84 28.53 611.03
t-test(one-
tailed, paired)
p-value=0.000091 p-value=0.000113
5 CONCLUSIONS
In this work, the Top-k Skyline Frequency Metric
has been proposed in order to rank high dimensional
Skylines and its performance and variability has
been empirically compared to the Skyline Frequency
Metric. Both metrics are based on subspaces, but
TKSFM is less expensive and it has been thought to
not benefit tuples that have only the best value in
one of the dimensions. Experimental results show
that TKSFM identify at least 40% and varies at least
20% of the results obtained from SFM. In the future,
we plan to study the quality of our metric making a
study in a real scenario using real data gathered from
real users.
ACKNOWLEDGEMENTS
The authors thank María-Esther Vidal for her
assistance and discussions towards developing the
ideas of this investigation.
REFERENCES
W. Balke, and U. Güntzer, “Multi-objetive query
processing for database systems,” in Proc. of VLDB,
2004, pp. 936–947.
J. Bentley, H. T. Kung, M. Schkolnick, and C. D.
Thompson, “On the average number of maxima in a
set of vectors and applications,” J
ACM,
vol. 25(4), pp.
536 – 543, 1978.
S. Börzsönyi, D. Kossmann, and K. Stocker, “The skyline
operator,” in Proc. of ICDE, 2001, pp. 421–430.
C. Brando, M. Goncalves, and V. Gonzalez, “Evaluating
top-k skyline queries over relational databases,” in
Proc. of DEXA, 2007, pp. 254–263.
C. Y. Chan, V. Jagadish, K.-L. Tan, A. K. H. Tung, and Z.
Zhang, “On high dimensional skylines,” in Proc. of
ICDE, 2006, pp. 478–495.
C. Y. Chan, V. Jagadish, K. L. Tan, A. K. H. Tung, and
Z. Zhang, “Finding k-dominant skyline in high
dimensional space,” in
SIGMOD,
2006, pp. 539–550.
M. Goncalves and M. Vidal, “Top-k skyline: A unified
approach,” in Proceedings of OTM 2005 PhD
Symposium, 2005, pp. 790–799.
M. Goncalves and M. Vidal, “Reaching the top of the
skyline: An
efficient
indexed algorithm for top-k
skyline queries,” in Proc. of DEXA
,
2009, pp. 471–
485.
M. de Kunder, “The size of the world wide web,” 2010.
[Online]. Available http://www.worldwidewebsize.
com
X. Lin, Y. Yuan, and Y. Zhang, “Selecting stars: the k most
representative skyline operator,” in ICDE, 2007, pp.
86–95.
J. Pei, Y. Yuan, X. Lin, W. Jin, M. Ester, Q. Liu, W.
Wang, Y. Tao, J. X. Yu, and Q. Zhang, “To- wards
multi-dimensional subspace skyline analy- sis,” in
TODS,
2006, pp. 1335 – 1381.
Y. Yuan, X. Lin, Q. Liu, W. Wang, J. Yu, and Q. Zhang,
“Efficient computation of the skyline cube,” in VLDB,
2005, pp. 241 – 252.
ICEIS 2010 - 12th International Conference on Enterprise Information Systems
386
