
SHAPE FEATURES FOR MASS DIAGNOSIS IN
MAMMOGRAPHIC IMAGES
Ali Cherif Chaabani, Atef Boujelben, Adel Mahfoudhi and Mohamed Abid
CES-Computer, Electronic and Smart Engineering Systems Design Laboratory, National School of Engineers, Sfax, Tunisia
Keywords: Breast Cancer, Mass, Diagnosis, Mammography, CAD, Shape Features, Region Features, Boundary
Features, XRDM, IA.
Abstract: Mammography is the most efficient method for early mass detection and diagnosis. This paper deals with
the problem of shape features extraction in digital mammogram for mass diagnosis. We propose to combine
a region and boundary features in order to ameliorate the diagnosis quality. For boundary analysis we
propose to ameliorate the RDM method by using an extended approach noted XRDM. We also define a new
feature (IA) based on angle calculation. Based on the literature, we exploit a set of region features that are
the most used and the simplest for mass description. For experiments, we use the DDSM database and some
classifiers as Multilayer Perception (MLP) and K-Nearest Neighbours (KNN). Using KNN classifiers, we
obtained 97.1% as sensitivity (percentage of pathological ROIs correctly classified). The results in term of
specificity (percentage of non-pathological ROIs correctly classified) grew around 95.63% using MLP
classifier.
1 INTRODUCTION
The breast cancer is considered one of the major
causes that increases mortality among women. More
specifically, breast cancer is the second most
common type of cancer and the fifth most common
cause of cancer related death (Nishikawa, 2007). To
reduce the high rate of mortality, the screening
mammography via CAD systems (computer-aided
diagnosis (CADi) and computer-aided detection
(CADe)) have been proposed at an early stage.
CADi system is used to identify a suspicious lesion
(masses, calcification…) via segmentation methods,
while CADe system aims at distinguishing
malignant lesions from benign ones via features
extraction.
Breast tumors and masses usually appear in
mammograms with different shape characteristics:
malignant tumors usually have rough,
microlobulated, or speculated contours; whereas
benign masses commonly have smooth, round,
macrolobulated, or oval contours. To separate the
benignant masses from malignant ones, two
techniques are most adopted: shape analysis (Cascio
et al., 2006; Boujelben et al., 2009) and texture
analysis (Oliver et al., 2006; Sheshadri et al., 2006).
Shape Analysis is based upon boundary and
region features. In the boundary analysis, the
majority of researchers applied a method based on
Radial Distance Measure (RDM), angular measure
(Radial Angle (Sheng-Chih et al., 2005) and Tuning
angle (Denise et al., 2008; Rangayyan et al., 2006)),
fractal dimension and Fourier Descriptor. In this
context, Sheng-Chih et al. (2005) used the Radial
Angle defined by the smaller included angle
between the direction of the gradient and the radial
direction of the edge: when the mass tends to be
more round, its Radial Angles tend to be near 180°
and the average of the Radial Angles tends to be
larger. Conversely, a mass with spiculated edge will
have a smaller averaged Radial Angle.
The Turning Angle (or tangent function) is
defined as the tangent to the contour (Rangayyan et
al., 2006). For a contour with concave and convex
portions, the turning angle function begins to
decrease at the beginning of a concave portion, and
keeps on decreasing until the direction of the tangent
to the contour changes at the beginning of the next
convex portion. In their work Rangayyan et al.
(2006) exploit the Turning Angle to derive two
features: Index of Speculation (IS) to measure the
boundary roughness, and Index of Convexity (IC) to
describe boundary convexity. However, the problem
255
Chaabani A., Boujelben A., Mahfoudhi A. and Abid M. (2010).
SHAPE FEATURES FOR MASS DIAGNOSIS IN MAMMOGRAPHIC IMAGES.
In Proceedings of the International Conference on Computer Vision Theory and Applications, pages 255-262
Copyright
c
SciTePress
of this approach lies in the enormous time of
calculation. Moreover, angle measure depends on
affine transformation (rotation).
The fractal dimension may be used to quantify
the complexity of a mass boundary. In first use of
fractal analysis in their approach, Nguyen et al.
(2005) based their work upon 1D signatures of the
2D contours of breast masses via application of the
ruler method. After, Nguyen et al. (2006) employ the
box-counting method in addition to the ruler method
to compute the fractal dimension of the 2D contours
of breast masses as well as their 1D signatures. The
inconvenience of the fractal analysis is that return
values are not normalized. Consequently we risk
having a bad separation between malignant and
benignant cases.
Fourier descriptor is used in many diagnosis
works to characterize the mass boundary.
Rangayyan et al. (1997) use a four-step approach to
derive the feature noted Fourier Fraction (FF):
firstly, they use a complex representation of the
boundary. Secondly, they calculate the boundary
components. After that, the authors proceed to a
normalization of the components. Finally, they
generate a Fourier Fraction (FF) feature. Although
acceptable results found in (Rangayyan et al., 1997;
Shen et al., 1994), the problem of Fourier analysis is
in a high temporal complexity caused by the
complex representation of contour and the
normalization step.
The RDM descriptor is frequently adopted for
mass boundary description (Boujelben et al., 2009;
Alvarenga et al., 2006; Delogu et al, 2008) because
it is the less complex in terms of calculation and
implementation compared to other techniques;
moreover this method is invariant to affine
transformation. From the RDM, the authors extract
many features like Roughness (R), standard
deviation (SDEV), etc. In most of their approach, the
authors combine the RDM descriptor with region
features to ameliorate mass description. In this
context, Alvarenga et al. (2006) had evaluated the
performance and relevance of a set shape features
extract from RDM method and Convex_Hull. In
recent work of Delogu et al. (2008), a set of shape
features extracted from boundary (RDM) and region
(Circularity, Convexity) of mass have been used. Via
these shape features, the authors attempted to
discriminate between malignant and benign masses
by using classification techniques.
Region Analysis is used to describe the
regularity of the mammogram mass. In this context,
simple morphologic features like Circularity (C),
Eccentricity (Exc) are used (Sheng-Chih et al., 2005;
Delogu et al., 2008). Also, most authors benefit of
Convex-Hull to measure the mass convexity. From
Convex-Hull, Alvarenga et al. (2006) used the
Normalized Residual Value (NRV), the Convexity
(CVX) and the morphological-closing ratio
(Mshape). In this work, Alvarenga et al found that
NRV feature gives the best performance in the
description of mass region.
In this paper, we include the approach of shape
analysis in our diagnosis process of mammograms.
The objective of this paper is to evaluate the
combination of feature based on boundary and
region criteria. We evaluate the combination of
features in diagnosis analysis. First, a set of features
based on region is adopted. Second a set of features
based on boundary is adopted. Thirdly, a
combination of region and boundary features is
evaluated.
The rest of this paper is organized as follows:
section 2 describes the proposed block diagram for
mass diagnosis. Section 3 illustrates the adopted
method of shape features. Section 4 presents the
results obtained by the shape descriptor of the
proposed method. Finally, we draw conclusions and
some future issues in section 5.
2 BLOCK DIAGRAM FOR MASS
DIAGNOSIS
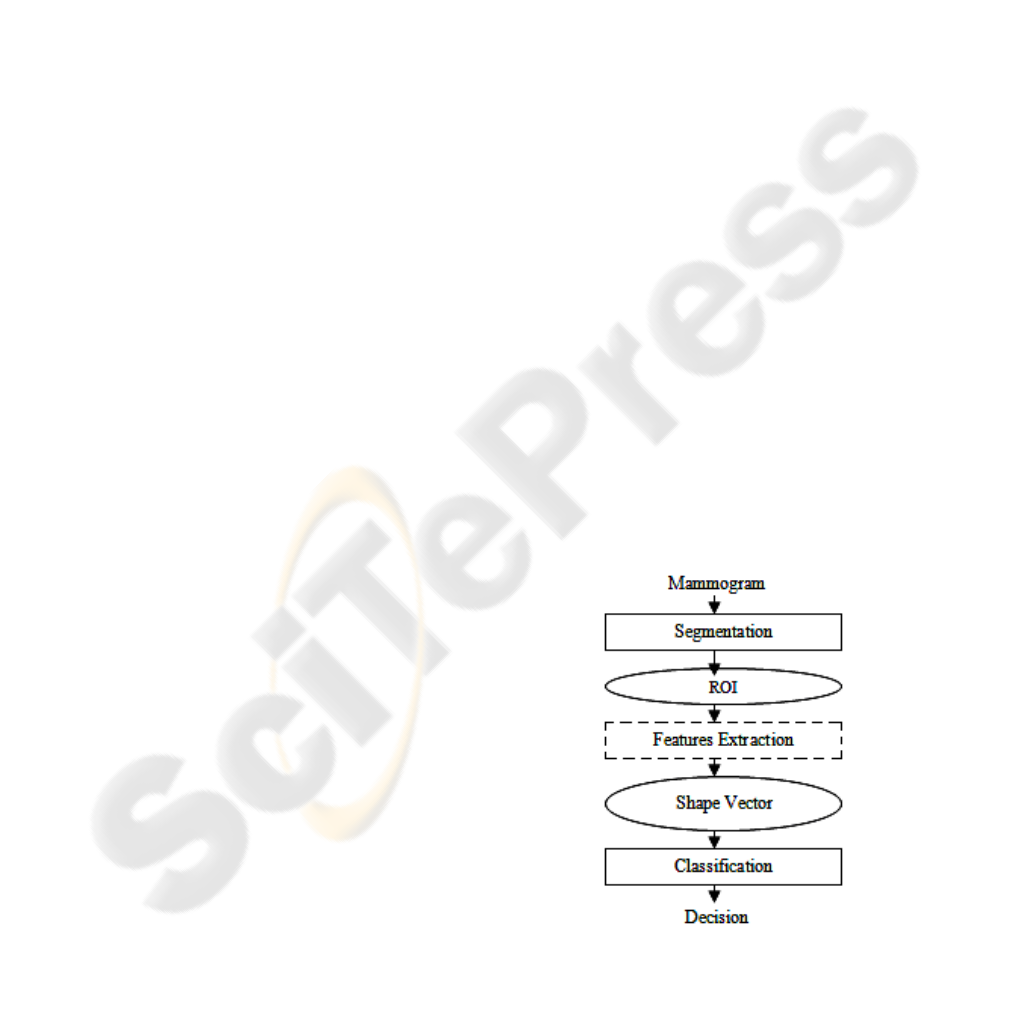
The proposed block diagram consists of three stages:
segmentation (identification of Regions Of Interest),
features extraction, and classification (Figure 1).
Figure 1: Block diagram for mass diagnosis.
Region of Interest (ROI) is selected from the
VISAPP 2010 - International Conference on Computer Vision Theory and Applications
256
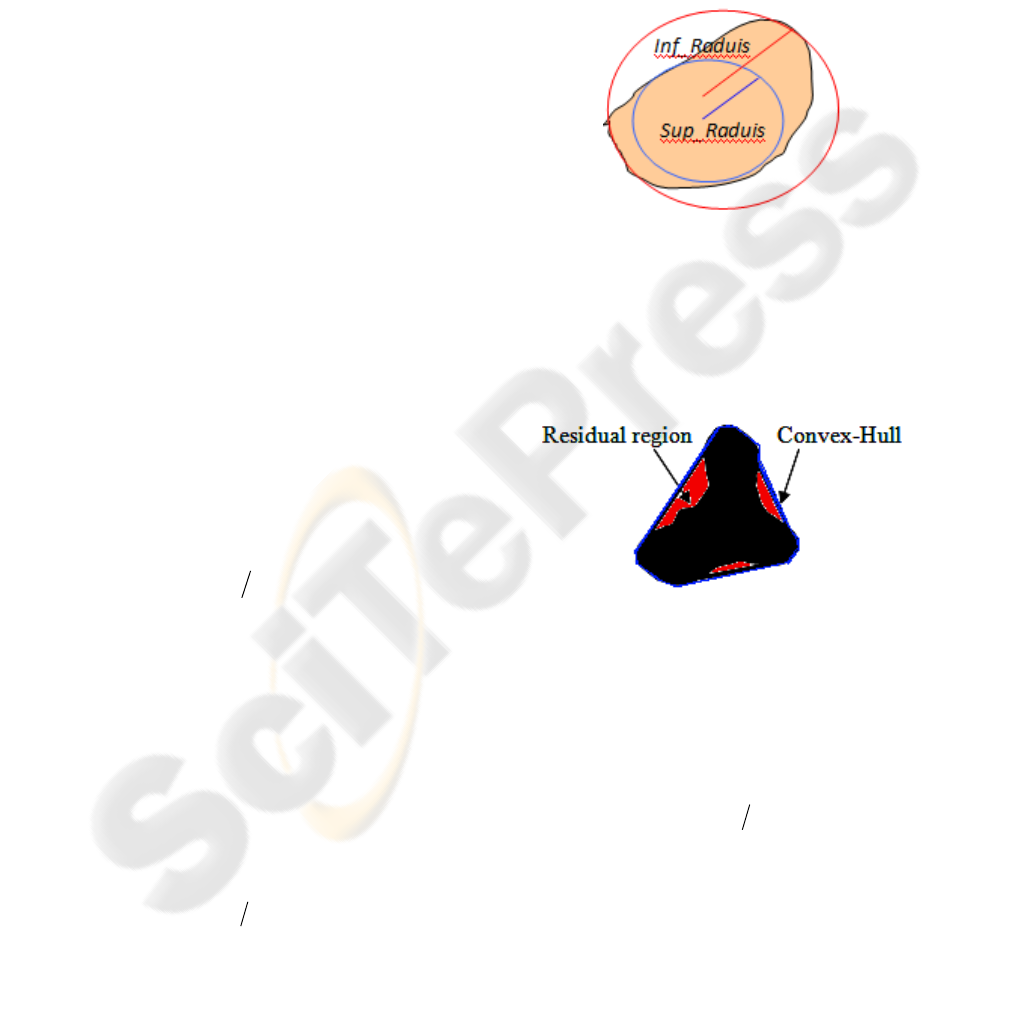
image by fixing a rectangular box around the
suspicious lesion area. A classical method of
segmentation based on Sobel filter and thresholding
approach is adopted. After the isolation of the ROI,
the extraction of features is adopted in ROI: this is
the stage of diagram in which we are interested in
this paper. After that, a classification part that makes
decision, based on features proposed, is started.
3 SHAPE FEATURES
EXTRACTION
Having completed the mass segmentation, and
before starting the classification process, a set of
features that extracted from the mass region and the
boundary is adopted.
3.1 Region Features
Region Features aims at describe the mammographic
masses by features extracted from the tumour
region. In our method, we exploit three features
indicated as follows: the Circularity (C), the Internal
External Circle (IEC) and the Normalised Residual
Value (NRV).
3.1.1 Circularity (C)
Circularity describes the area which can be circular.
It can be useful in this direction and can give an
indication on the regularity of a given mammogram
mass. This feature is given by the following
equation:
2
4 PAC
(1)
where: P is the perimeter and A the area of the
segmented mass. The perimeter was measured by
summing the number of pixels on the border of the
mass, and the area was the number of pixels inside
the border.
3.1.2 Internal External Circle (IEC)
This feature can be used to measure the elongation
of shape (Chettaoui et al, 2005). In our work, we
exploited this feature in the description of the mass
region. It is given by the following equation:
where: Inf_Radius represents the largest internal
circle and Sup_Radius represents the smallest
external circle (Figure 2).
For a round mass, the value of IEC is close to 1
since the value of Inf_Radius is very close to the
value of Sup_Radius, whereas for a lengthened mass
the value of IEC becomes close to 0 since the value
of Inf_Radius is far from the value of Sup_Radius.
The advantage of this feature is that it is
invariant to affine transformation and it is adequate
with our work. However, its calculation is slower,
because of the determination of internal and external
circles.
Figure 2: Calculation of IEC feature.
3.1.3 Normalized Residual Value (NRV)
This feature is extracted from the convex-hull by
using the residual region (red region in figure 3
represents the difference between mass region in
black and convex-hull).
Figure 3: Residual region.
Alvarenga et al. (2006) showed that NRV gave
the best performances compared to the
characteristics that can be extracted from the
convex-hull, and which can be useful in the
distinction between the regular and irregular area. It
is given by the following equation:
where: P_CH is the perimeter of the convex-hull
and A_RES is the area of the residual region.
3.2 Boundary Features
In this section, we show how to optimize RDM is
called eXtended RDM (XRDM). We propose a new
RadiusSupRadiusInfIEC __
(2)
2
2
)_()_( CHPRESANRV
(3)
SHAPE FEATURES FOR MASS DIAGNOSIS IN MAMMOGRAPHIC IMAGES
257
feature noted Index of Angle (IA), inspired of the
XRDM method and of the angular calculation. Also,
we benefit of the efficiency of the characteristic of
convexity (CVX) to describe the mass boundary.
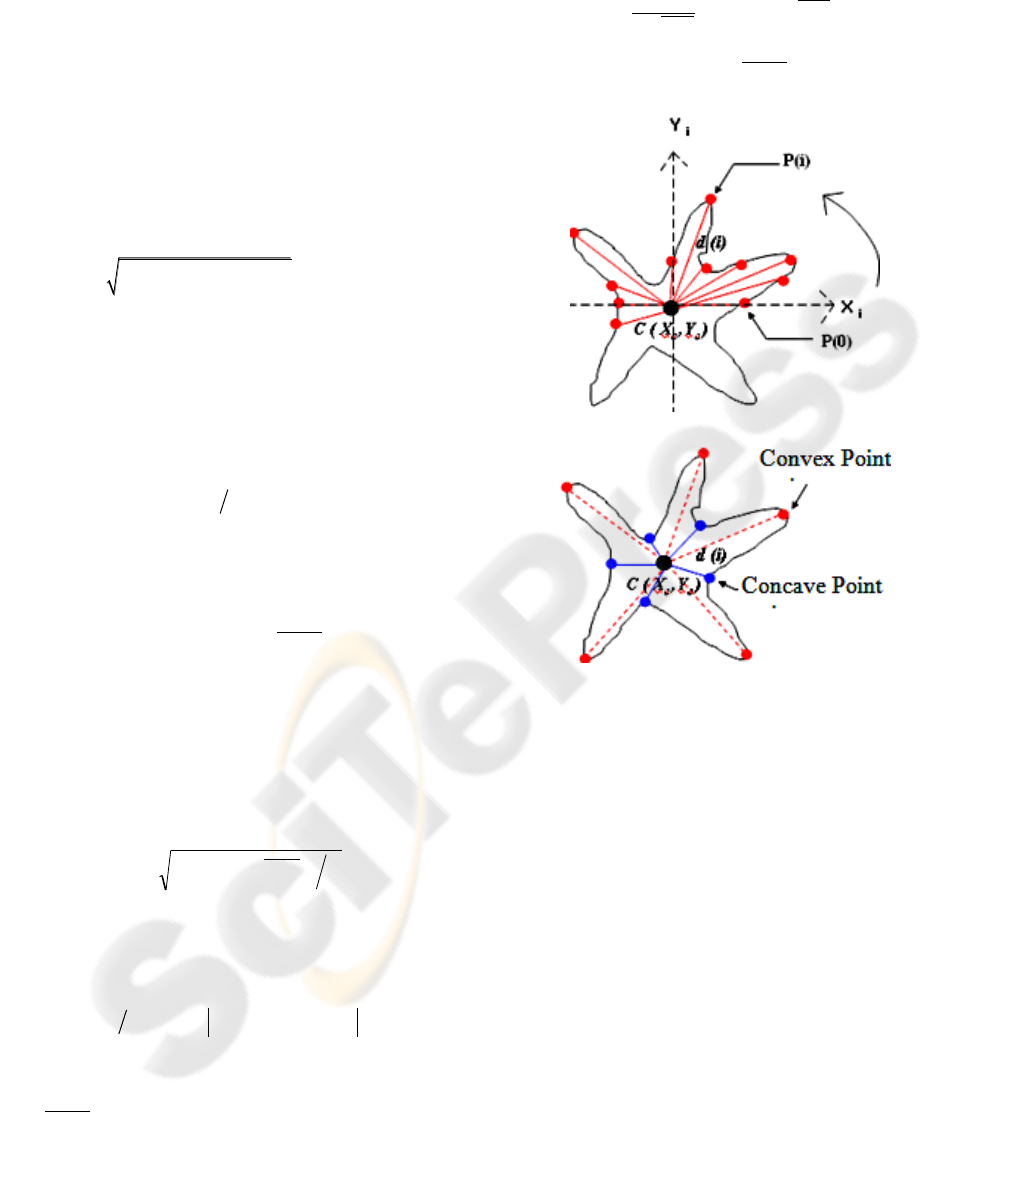
3.2.1 Extended Radial Distance Measure
(XRDM)
The RDM descriptor is one of the methods most
used in the analysis of the shape in order to
characterize the mass boundary. It is based on the
euclidian distances d(i) that calculated between the
centroid of the region and all the points in boundary
region (Figure 4(a)):
where: (Xc, Yc) and (Xi,Yi)) are respectively the
coordinates of the centroid C and the boundary pixel
at the i-th location, N is the number of contour
pixels.
All radial distances d(i) are normalized by using
the maximum value (normalised factor) of the radial
distances:
Several features can be extracted from the RDM
method. In our work, the features extracted from the
RDM are cited below:
The Standard Deviation (SDEV) is defined as the
variance of the distances
id
n
around the radius
(the average radial distance measure) of a circle.
SDEV permits to give better quality of
information on the irregularity of contour.
Indeed, the value of SDEV feature tends to 0.5
when it is about a malignant tumour. On the
other hand, the value of SDEV tends towards 0 in
the case of benign tumour.
The Roughness (R) treats the micro-lobulated
contours. It is defined as the average distance
between neighbouring pixels over tumor contour:
The Area Ration (AR) computes the percentage
of tumor outside the circular region defined by
id
n
(the average value of
id
n
). More contour
is irregular, more the value of AR is high. This cha-
racteristic permits to discriminate between the
speculated and smoothed contours:
where: AR=0, if
idid
nn
.
(a)
(b)
Figure 4: Illustration of (a) RDM and (b) XRDM.
However, computation of these features
increases their temporal complexity. To overcome
this problem, we propose to extend RDM method
(Boujelben et al., 2009) by replacing the calculation
of the features: we are interested only in a limited
number of points noted as concave and convex
points (Figure 4(b)). The concave and convex points
are defined as follows:
The concave point (Pconcave (i)): is a point
which has a radial distance d(i) lower than the
radial distance d(i-1) and lower than the radial
distance d(i+1).
The convex point (Pconvex (i)): is a point which
has a radial distance d(i) higher than the radial
distance d(i-1) and higher than the radial distance
d(i+1).
22
( ) , 1d i Xi Xc Yi Yc i N
(4)
ididid
n
max
(5)
NididSDEV
N
nn
2
(6)
N
nn
ididNR 1*1
(7)
N
nn
n
idid
idN
AR *
*
1
(8)
VISAPP 2010 - International Conference on Computer Vision Theory and Applications
258
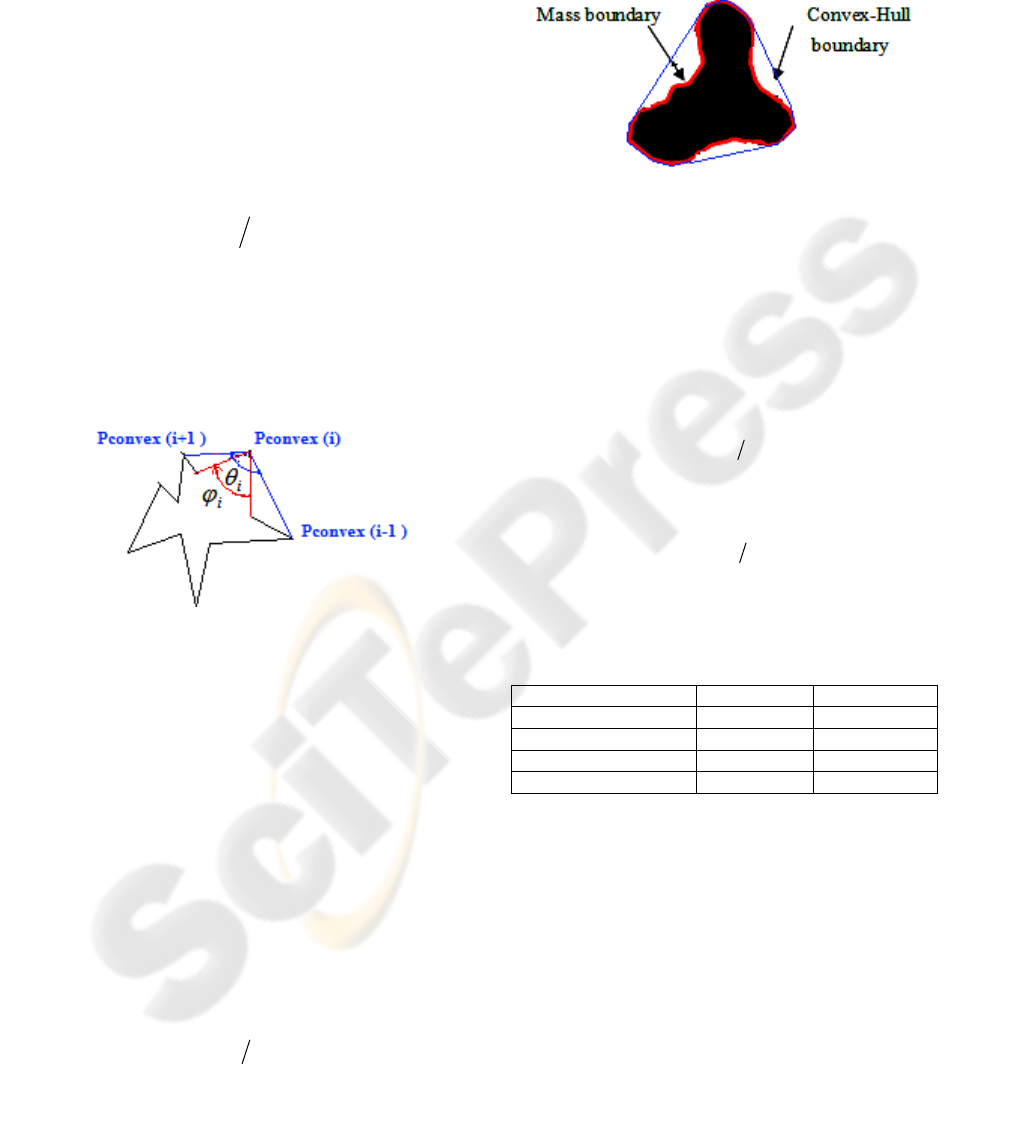
3.2.2 Index Angle (IA)
Basing on XRDM method, we introduce a new
feature in our boundary descriptor noted Index
Angle (IA). This feature is based on concave and
convex points defined in XRDM method and is
defined by the ratio of all the external angles (
i
)
by internal ones (
i
): the external is the angle
between a central convex point (Convex point pi)
and their neighbours convexes points (Convex point
pi-1, p+1), however, the internal is the angle
between a central convex point and their neighbours
concaves points (Figure 5).
The IA is applied to make a distinction between
the micro-lobulated boundaries and the round ones:
when the mass tends to be more rounded, its IA
tends to be near the 1. Conversely, a mass with
micro-lobulated edge will have a value of IA smaller
than 0.5.
Figure 5: Calculation of IA feature.
IA feature is used only for the concave and
convex points and not for all points, in order to
minimize the temporal complexity, differently with
features extracted from angle calculation used in
(Rangayyan et al., 2006). On the other hand, the
advantage of this characteristic is that it is
normalized and invariant to any affine
transformation.
3.2.3 Convexity (CVX)
This feature is based on boundary of mass and his
convex-hull (Figure 6). It is defined by the ratio of
perimeter of mass region (P_MR) and perimeter for
his convex-hull (P_CH):
CVX can be used to separate between the
speculated boundaries and the rounded ones: when
the mass tends to be more rounded, its CVX tends to
be near the 1. In the case of speculated mass, the
CVX is smaller than 0.5.
Figure 6: Mass and Convex_Hull boundary.
4 CLASSIFICATION AND TEST
The evaluation criteria used to determine the
performance of a CADi System are defined as
follows:
Sensitivity: percentage of pathological ROIs
correctly classified.
Specificity: percentage of non-pathological ROIs
correctly classified.
The parameters used by the evaluation criteria
are summarized in the following table:
Table 1: Parameters used for evaluation.
Case
Classifier
In reality
FP (False Positive)
Malign
Benign
FN (False Negative)
Malign
Malign
TP (True Positive)
Benign
Malign
TN (True Negative)
Benign
Benign
4.1 Image Data Set
The DDSM (Digital Dataset for Screening
Mammography) is the largest publicly available
database of mammographic data. It contains
approximately 2620 screening mammography cases.
The Digital for Screening Mammography
(DDSM) is the largest publicly available database of
mammographic data (Heath et al., 2001). It contains
approximately 2620 screening mammography cases.
From the total number of images included in the
DDSM database a total of 500 ROIs were used in
this work (table 2). For training step, we used 240
i
i
i
i
IA
(9)
CHPMRPCVX __
(10)
FNTPTPySensitivit
(11)
FPTNTNySpecificit
(12)
SHAPE FEATURES FOR MASS DIAGNOSIS IN MAMMOGRAPHIC IMAGES
259
ROIs (120 benign and 120 malign). For the
evaluation, we used 260 ROIs that contain 130
malign and 130 benign.
Table 2: Distribution of ROIs.
Training
Test
Malign
Benign
Malign
Benign
120
120
130
130
4.2 Experimental Results
To measure the performance given by our shape
features, two methods of classification are used: the
first is KNN (K-Nearest Neighbours) and the second
is MLP (Multilayer Perception).
4.2.1 Region Features
Table 3 illustrates the importance of region
information for mass description. As shown in this
table the best result is given by MLP classifier: the
result in terms of sensitivity tends towards 96%
while the result in terms of specificity exceeds 94%.
Table 3: Results from Region Features.
Classifier
KNN
MLP
Sensitivity (%)
95.45
96.70
Specificity (%)
92.96
94.50
Although MLP gives the best result, the
difference with the result given by KNN is not great.
We note that the region features give good results
despite the use of different classifiers. So, we
observe that the characteristics of cregion can be
exploited to differentiate the benign from the malign
mass.
4.2.2 Boundary Features
Table 4 shows the results given by boundary
features for mass description. As in the case of
region features, MLP gives the best result in terms
of sensitivity (97.90%) and specificity (94.20%).
Regarding the results given by boundary features,
we notice a slight optimization over the results given
by region features (table 3).
Table 4: Results from Boundary Features.
Classifier
KNN
MLP
Sensitivity (%)
95.10
97.90
Specificity (%)
93.67
94.20
In fact, the increase in the performance of
boundary features is justified by optimization of
features given by classic RDM as shown at Table 5:
according to the results that found in (Boujelben A.
et al., 2009), we find that XRDM gives the best
sensitivity and specificity for the two classifiers.
Table 5: RDM features vs XRDM features (Boujelben A.
et al., 2009).
RDM Features
Classifier
KNN
MLP
Sensitivity (%)
89.74
86.88
Specificity (%)
85.22
85.43
XRDM Features
Classifier
KNN
MLP
Sensitivity (%)
90.28
88.88
Specificity (%)
89.64
92.82
Subsequently, the inclusion of XRDM in a
feature vector described the contour can improve the
performance of classification of mammographic
masses.
4.2.3 Combinated Features
Table 6 presents the results given by the
combination of features of region and of boundary
ones. The best result in term of sensitivity tends
towards 97.10% in KNN classifier while the best
result in term of specificity tends towards 95.63% in
MLP classifier.
Table 6: Results from features combination (Boundary and
Region).
Classifier
KNN
MLP
Sensitivity (%)
97.10
96.74
Specificity (%)
94.53
95.63
The real contribution of this work lies in the
combination of features that based on region and
those based on the boundary. From Table 6, we
notice that the two classifiers used gave the best
performance: in fact, the combined characteristics
(region and the border) have improved the
specificity of two classifiers compared to results
found previously by only the use of the region or
contour (table 3 and 4). Regarding sensitivity, the
result is increased with the KNN classifier but it is
decreased with the MLP classifier.
Subsequently, the fusion of features improves the
accuracy of distinguishing between malign and
benign ones tumors.
In order to study the effectiveness of the
proposed features, we present in table 7 a
comparison of our found results with those found by
other works. As this table shows, the best results are
VISAPP 2010 - International Conference on Computer Vision Theory and Applications
260

given by our combination of features. But, despite
acceptable results found by our proposed features,
we can not conclude that we have the best results
because we did not use the same database used by
other works. In fact, the digitization can reflect the
final result. Also, the other works use an automatic
system for detection of masses whereas in our work
the task of mass detection is realized of a semi-
automatic manner.
Table 7: Results of comparison.
Approach
Sens
(%)
Spec
(%)
Classifier
Data Set
Alvarenga
et al.
(2006)
88
90.4
LDA
Local
(125
cases)
Rangayyan
et al.
(1997)
95
-
LDA
Local
(32
cases)
Retico et
al. (2007)
78.1
79.1
MLP
Local
(226
cases)
Chang et
al. (2005)
88.89
92.5
SVM
Local
(210
cases)
Our
proposition
97.1
94.53
KNN
DDSM
(500
cases)
96.74
95.63
MLP
However, we can say that the use of our
proposed features in the other works can be
important in the increase of the rate of success of the
distinguishing between the benign and malignant
mass.
5 CONCLUSIONS
Characterization of mammographic mass and its
classification as being benign or malignant is
difficult. In this paper, we have tried to improve the
performance of the mass classification. We have
proposed a shape features that based on the region
features and the boundary ones. The results have
been validated by two algorithms of classification:
KNN and MLP. The found results were acceptable
with a rate of sensitivity and of specificity that
passed 95%.
The shape features can characterize the types of
mammographic masses. Since the signs of
malignancy of breast tumour are related to shape and
texture, shape features are insufficient, by
themselves, for a description of the masses more
effective. For this reason, it is better to add texture
features to our descriptors in order to increase the
accuracy rate for discriminating between benign
masses and malignant ones. In future work, we will
illustrate the effectiveness of the combination of the
texture features and shape ones in the diagnostic
process.
Detection phase is the most difficult step in a
CAD system. For this reason, the future work will be
dedicated to the automation of detection by using of
our approach of mass detection, based on Level Set,
presented in (Boujelben. A. et al, 2009) and using of
our approach of mass description indicated in this
paper.
REFERENCES
Alvarenga, A. V., Fernando, A., Wagner Coelho de
Albuquerque, C. I., (2006). Assessing the performance
of the normalised radial length and convex polygons
in distinguishing breast tumors on ultrasound images.
Pereira Revista Brasileira de Engenharia Biomédica,
Vol. 22, pp. 181-189.
Boujelben, A., Chaabani, A. C., TMAR, H., ABID, M.,
(2009). An approach based on RDM for analysis in
breast cancer detection. In International Conference on
Applied Informatics, pp. 103-108, Algerie.
Boujelben. A. Chaabani, A. C., TMAR, H., ABID, M.,
(2009). Level Set method for breast regions detection.
In International Conference on Medical Imaging from
technology to Application (ICMITA09), pp. 169-174,
Tunisie.
Cascio, U., Fauci, D., Golosio, B., Magro, R., Masala, L.,
Oliva, P., Raso, G., Stumbo, S., (2006). Massive
Lesions Classification using Features based on
Morphological Lesion Differences. In Transactions on
engineering computing and technology, IMTC.
Chang, R.F., Wu, W., Moon, W., Chen, D.R., (2005).
Automatic ultrasound segmentation and morphology
based diagnosis of solid breast tumors. Springer, Vol.
89, pp. 179-185.
Chettaoui, C., Djamel, K., Djouak, A., Maaref, H., (2005).
Etude de formes des globules drépanocytaires par
traitement numérique des images. In Int. Conf. SETIT,
Tunisia.
Delogu, P., Fantacci, M. E., Kasae, P., Retico, A., (2008).
Characterization of mammographic masses using a
gradient-based segmentation algorithm and a neural
classifier. In Comput Biol Med.
Denise, G., Rangayyan, R. M., Juliano Carvalho, D.,
Sérgio Santiago, A., (2008). Polygonal Modeling of
Contours of Breast Tumors With the Preservation of
Spicules. In IEEE Transations In Biomedical
Engineering, Vol. 55.
Heath, M., Bowyer, K., Kopans, D., Moore, R.,
Kegelmeyer, P. Jr., (2001). The Digital Database for
Screening Mammography. In Proceedings of the 5th
International Workshop on Digital Mammography,
SHAPE FEATURES FOR MASS DIAGNOSIS IN MAMMOGRAPHIC IMAGES
261

Toronto, Canada, 11-14 June 2000, Medical Physics
Publishing, pp. 212-218.
Nguyen, T. M., Rangayyan, R. M, (2005). Fractal analysis
of contours of mammographic masses. In Third
IASTED International Conference on Biomedical
Engineering, pp. 186–191, Innsbruck, Austria.
Nguyen, T. M., Rangayyan, R. M, (2006). Shape analysis
of breast masses in mammograms via the fractal
dimension. In Proceedings of the 27th Annual
International Conference of the IEEE Engineering in
Medicine and Biology Society, pp. 3210-3213,
Shanghai, China.
Nishikawa, R. M., (2007). Current status and future
directions of computer-aided diagnosis in
mammography. Computerized Medical Imaging and
Graphics, 31:224-235.
Oliver, A., Llado, X., Marti, R., Freixenet, J., Zwiggelaar,
R., 2007. Classifying mammograms using texture
information. In Medical Image Understanding and
Analysis, Aberystwyth and Wales and UK, pp. 223–
227.
Rangayyan, R. M., El-Faramawy, N. M., Desautels, J.E.L,
Alim, O.A., (1997). Measures of acutance and shape
for classification of breast tumors. In IEEE
Transactions on Medical Imaging, Vol. 16, no. 6, pp.
799-810.
Rangayyan, R. M., Guliato, D., Carvalho, J. D., Santiago,
S.A., (2006). Feature Extraction from the Turning
Angle Function for the Classification of Contours of
Breast Tumors. In The International Special Topics
Conference on Information Technology in
Biomedicine IEEE-ITAB, pp. 1-6.
Retico, A., Delogu, P., Fantacci, M. E., Kasae, P., (2007).
An automatic system to discriminate malignant from
benign massive lesions on mammograms. Medical
Physics, Vol. 14, pp. 596–600.
Sheng-Chih, Y., Chuin-Mu, W., Yi-Nung, C., Giu-Cheng,
H., San-Kan, L., Pau-Choo, C., Chein-I Chang,
(2005). A Computer-Aided System for Mass
Detection and Classification In Digitized
Mammograms. In Biomed Eng Appl Basis Comm, pp
215-228.
Sheshadri, HS., Kandaswamy, A., (2006). Breast Tissue
Classification Using Statistical Feature Extraction of
Mammograms. In Indian J Med, Vol 23 No.3.
Shen, L., Rangayyan, R. M., Desautels, J. E. L., (1994).
Application of shape analysis to mammographic
calcifications. In IEEE Transactions on Medical
Imaging, Vol.13, no. 2, pp. 263–274.
VISAPP 2010 - International Conference on Computer Vision Theory and Applications
262
