
COLLABORATIVE EDUCATIONAL GEOANALYTICS
APPLIED TO LARGE STATISTICS TEMPORAL DATA
Mikael Jern
Department of Science and Technology, National Center for Visual Analitics, Linkoping University, Norrköping, Sweden
Keywords: Information and Geovisualization, Geovisual Analytics, Collaborative Time Animation, Storytelling,
Statistical Data, MediaWiki, Blogs, Collaborative Work, Learning.
Abstract: Recent advances in Web 2.0 graphics technologies have the potential to make a dramatic impact on
developing collaborative geovisual analytics that analyse, visualize, communicate and present official
statistics. In this paper, we introduce novel “storytelling” means for the experts to first explore large,
temporal and multidimensional statistical data, then collaborate with colleagues and finally embed dynamic
visualization into Web documents e.g. HTML, Blogs or MediaWiki to communicate essential gained insight
and knowledge. The aim is to let the analyst (author) explore data and simultaneously save important
discoveries and thus enable sharing of gained insights over the Internet. Through the story mechanism
facilitating descriptive metatext, textual annotations hyperlinked through the snapshot mechanism and
integrated with interactive visualization, the author can let the reader follow the analyst’s way of logical
reasoning. This emerging technology could in many ways change the terms and structures for learning.
1 INTRODUCTION
The major tenets of Web 2.0 are creating a
revolution in the way in which information is
produced and shared among different interest groups
and individuals. Concepts like “collective
intelligence” has become undisputed linked with
developments such as blogs, wikis, social
networking and collaborative software development.
Web 2.0 can make dramatic impact on developing
interactive and collaborative geovisual analytics
tools for the Internet. Tools are needed that advances
humans ability to exchange gained knowledge and
develop a shared understanding with other people.
Stimulate brainstorming and problem-solving
through creative and incremental discovery and
develop a contextual collaborative understanding -
commonly referred to as geospatial “analytics
reasoning” are important tasks to solve.
While the benefits of geovisual analytics tools
(Andrienko 2003 and 2005) are many, it remains a
challenge to adapt these tools to the Internet and
reach a broader user community. In this context, we
introduce a web-enabled tool Geovisual Analytics
Visualization “GAV Flash" for analysing and
communicating knowledge explored in large
volumes of statistical data. This tool and associate
applications OECD Factbook (OECD 2009b) and
Regional eXplorer (OECD 2009a) facilitate a broad
collection of dynamic visualization methods
integrated with the Adobe
©
Flash
©
and Flex
©
development platform. The eXplorer platform
focuses on the analytics reasoning aspects enabling
statisticians to explore spatial, temporal and
multivariate data from multiple perspectives
simultaneously using dynamically linked views,
views (Brodbeck 2003) discover interesting
relationships, share their incremental discoveries
with colleagues and finally communicate selected
relevant knowledge to the public.
In this paper, we introduce novel “storytelling”
means for the analyst to 1) select any spatial-
temporal and multidimensional national or sub-
national statistical data, 2) explore and discern
trends and patterns, 3) then orchestrate and describe
metadata, 4) collaborate with colleagues to confirm
and 5) finally publish essential gained insight and
knowledge embedded as dynamic visualization
“Vislet” in blogs or wikis with associate metadata.
The main features can be summarized:
• Interactions, dynamic time animation and state-
changes in an analytical reasoning process, such
as visual inquiries or highlighted outliers but
also linked, can be saved during an explorative
process through “memorized interactive views”.
233
Jern M. (2010).
COLLABORATIVE EDUCATIONAL GEOANALYTICS APPLIED TO LARGE STATISTICS TEMPORAL DATA.
In Proceedings of the 2nd International Conference on Computer Supported Education, pages 233-238
DOI: 10.5220/0002780302330238
Copyright
c
SciTePress
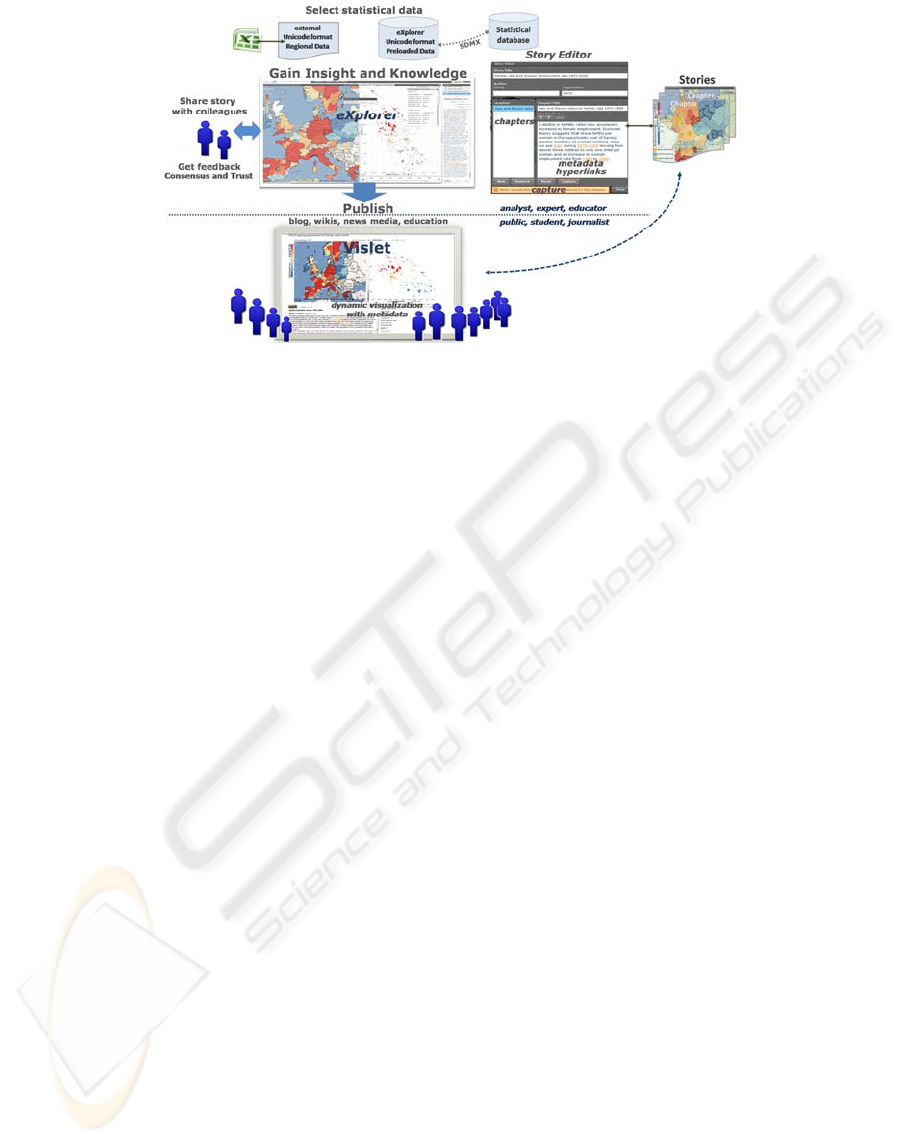
Figure 1: The analyst (author) uses eXplorer to1) import any national or sub-national statistical data, 2) explore and make
discoveries through trends and patterns and derive insight. Gained knowledge is the foundation for 3) creating a story that
can be 4) shared with colleagues and reach consensus and trust. The visual discoveries are captured into snapshots together
with descriptive metadata and hyperlinks in relation to the analytics reasoning. The author gets feedback from colleagues,
adopts the story and 5) finally publishes “tell-a-story” to the community using a “Vislet” that is embedded in blogs or wikis.
• A Story mechanism records the status of an
explorative discovery including tasks, events,
conditioning, dynamic linked views, region
highlights, colour legend scale, results from
filter or cluster operations and time animation;
• Combination of a descriptive and conceptual
metatext with an interactive and guided
discovery process could improve not only the
educational aspect but also the credibility of the
sharable understanding of analytical results;
• An eXplorer Story can be published on a HTML
page, blog or wikis as a Vislet with integrated
dynamic visualization and metatext;
A geovisual analytics framework and class library
for web developers with integrated service for
communicating and collaborating analytical
assessments to remote team members and
public; 2 related work.
2 RELATED WORK
The importance of providing explorative sessions in
geovisualization and incorporated features to capture
and reuse interactions and integrate them into
electronic documents was early demonstrated by
MacEachren (MacEachren and Brewer 2001) and
Jern (Jern 2001, 2008). CCMaps presents a
conditioned choropleth mapping tool that allows
users to save snapshots and reuse them for
presentation purpose. More recent efforts were made
by Visual Inquiry Toolkit (Guo et al. 2006)
that allows users to place pertinent clusters into a
“pattern-basket” to be reused in the visualization
process. Robinson describes a method they call “Re-
Visualization” and a related tool ReVise that
captures and re-uses analysis sessions (Robinson
2006); Keel describes a visual analytics system of
computational agents that support the exchange of
task-relevant information and incremental
discoveries of relationships and knowledge among
team members commonly referred to as sense-
making (Keel 2006). Wohlfart describes a
storytelling approach combined with interactive
volume visualization and an annotated animation
(Wohlfart and Hauser 2007).
Many capture and reuse approaches are limited to be
used within the same application environment that
may well require a license and are not always easily
accessible to team members without installing
external software. Increased computer security
practices tend to limit this possibility. In this
context, we introduce a web compliant layered
component toolkit facilitating a snapshot mechanism
that captures, re-uses and shares active properties for
individual functional components. We demonstrate
that such an implementation can provide a more
open and collaborative geovisual analytics
framework for public use (OECD 2009a).
CSEDU 2010 - 2nd International Conference on Computer Supported Education
234
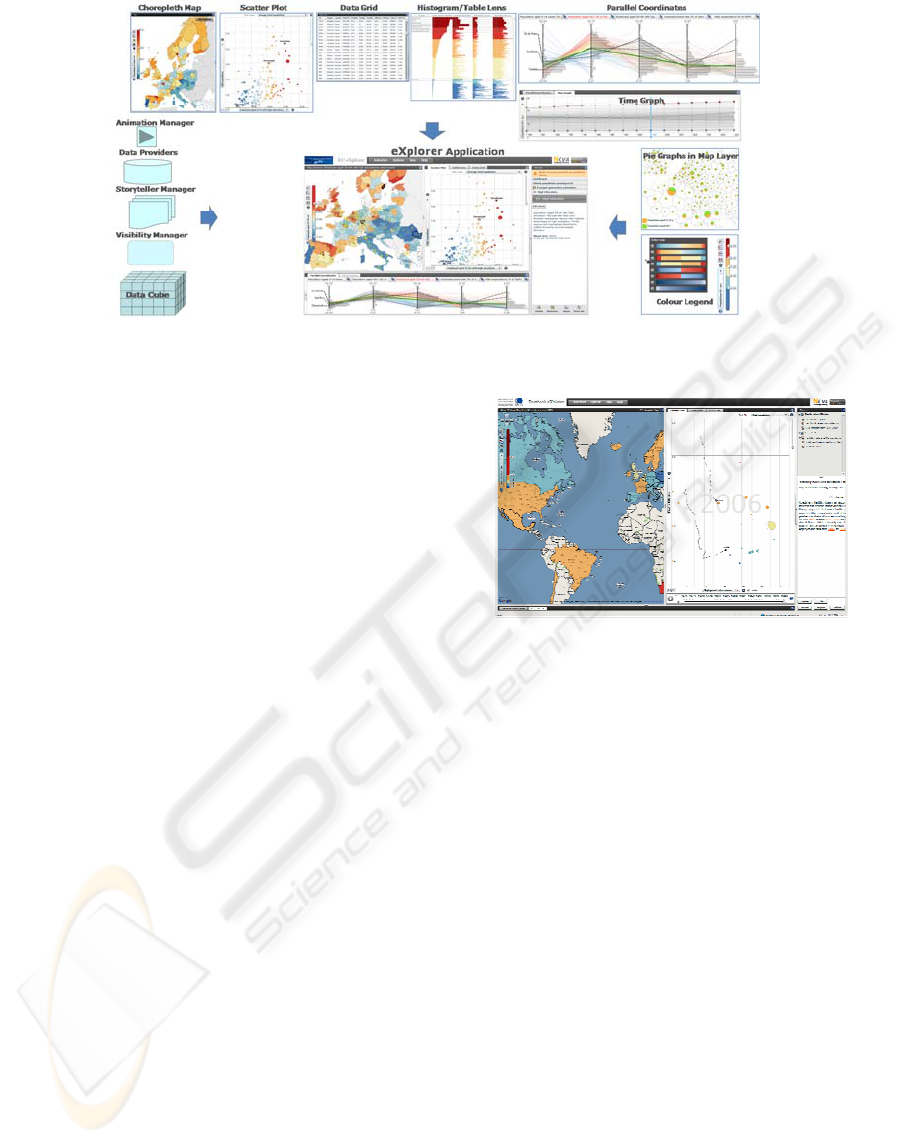
Figure 2: eXplorer is assembled from a collection of GAV Flash visualisation and administrative components.
3 SYSTEM IMPLEMENTATION
GeoAnalytics Visualisation GAV Flash is a toolkit
and framework adapted for the Web 2.0 using
Adobe’s Flash basic graphics and Flex for user
interfaces. Programmed in Adobe’s object-oriented
language ActionScript, GAV Flash facilitates 100%
deployment to the Internet through Adobe Flash
Player V10. GAV Flash includes a collection of
common geovisualization and information
visualization components, data analysis algorithms,
tools that connect the components to each other and
data providers that can load data from various
sources (figure 2). Interactive features that support a
spatial and temporal analytical reasoning process are
exposed such as tooltips, brushing, highlight, data
zoom, visual inquiry, conditioned statistics filter
mechanisms that can discover outliers and methods
supporting dynamically linked multiple views. A
space-time-attribute data cube provides the
interactive performance required for eXplorer’s
handling of massive statistical data.
As GAV Flash is built upon Adobe Flex, a
developer has access to all Flex user interface
functionalities. By combining buttons, panels and
sliders with GAV data providers, managers and
visual representations, applications can easily be
customized. The open architecture, allows new or
existing tools to be incorporated with the already
existing components, e.g. statistical analysis tools or
visual representations. By separating the data
structure from the visual representations,
applications are created that work regardless of
input.
Figure 3: A story called “Fertility rate and women
employment rate”. Two countries Italy and Mexico are
highlighted in two coordinated views. A decline in fertility
rates may accompany increases in female employment.
Economic theory suggests that fewer births per woman are
the opportunity cost of having greater numbers of women
working. Here we see Italy during 1970-1995 moving
from almost three children to only one child per woman
and an increase in woman employment rate from 1996 to
2006. The Story (right panel) shows the metatext for
current story and a list of other associated stories.
4 COLLABORATIVE
SPACE-TIME-ATTRIBUTE
ANIMATION FOR
STORYTELLING
Complex and collaborative geovisual analytics
sense-making tasks require the external
representation and visual organization of
information. These methods could help sense-
makers compare, organize, comprehend and reflect
on what they know, to quickly access specific
information when needed, to remember relevant
thoughts and ideas, as well as to exchange
COLLABORATIVE EDUCATIONAL GEOANALYTICS APPLIED TO LARGE STATISTICS TEMPORAL DATA
235
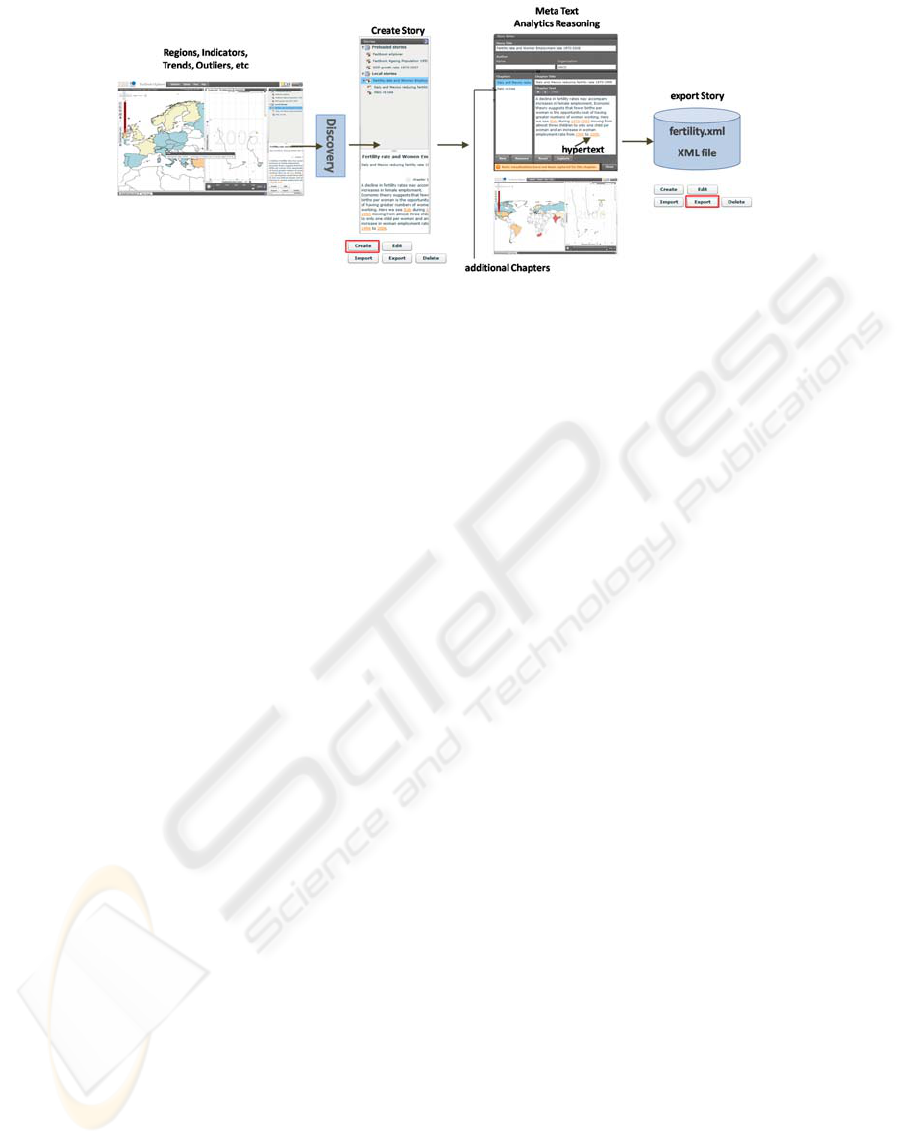
Figure 4: During an eXplorer session (figure 3), the analyst first selects regions to be analysed and associate indicators.
Then a search for trends, outliers, discovers important observations, highlights regions to be compared etc. - a discovery is
made! Secondly, open the Story Panel (right view), use button Create a Story, a Story Editor panel comes up, fill in the
required information and associate reasoning text and finally press Capture , the entire current eXplorer scenario (all views
and attributes) are saved together with selected indicators. The user can now start a second Chapter (New) and create a new
scenario and repeat the process or Close and then use the button Export as, give the Story a name "my story nr 2".xml. The
Story is now saved locally on your computer and can be reused Imported or sent to a colleague for review in eXplorer.
knowledge and develop a shared understanding with
other people. Computer generated information
visualizations usually explicitly state relationships
among information items thus allowing for quick
and non-ambiguous explorations of an information
space. Human generated information arrangements
are often vague in regards to relationships thus
inviting more creative interpretations of an
information space. The GAV Flash framework
integrates tools for both collaborative interactive
visualization and sense-making. A story indicates a
successful suggestion and subsequently fosters
additional suggestions based on similar
considerations based on similar considerations. This
learning mechanism allows our storytelling system
to improve the accuracy of its suggestions as well as
to dynamically adapt to particular users, tasks and
circumstances. Colleagues can review a story
arrangement and respond with suggestions and
comments and subsequently fosters additional
suggestions based on similar considerations.
The eXplorer platform facilitates the architecture to
support means of capture, add descriptive text, save,
packaging and sharing the discovery and results of a
geovisual analytics process in a series of snapshots
“Story” (figure 4 and 5). When the button “Capture”
in the Story Editor is pressed, the state of each GAV
Flash view in OECD Factbook eXplorer (figure 3) is
saved together with user-defined metatext. Before
closing the application, the user exports the story
into a XML formatted file. Team members (figure 1)
can through descriptive text combined with
interactive visualization follow the analyst’s way of
logical reasoning by loading selected stories. At any
time a team member can access stories and apply
them in eXplorer or any other GAV Flash
application assembled from the same component. A
comprehensive story in the context of a remote
collaborative sense-making activity can thus be
created by the analyst through a set of linked
snapshots (chapters). Users will discuss relevant
issues through storytelling based on solid evidence,
thus raising awareness and increasing the common
knowledge on a certain phenomenon.
An eXplorer story hyperlink (figure 5) is a reference
in the story metatext to an external web site or
another eXplorer discovery (view). A text item in
the current story is highlighted so that when clicked,
the story automatically displays in eXplorer, for
example, a zoom to a certain region, change of
indicator etc. or shows some referenced external
content. This highlighted word(s) is known as a
hyperlink and makes a logical connection to an
eXplorer state or external reference. Hyperlinks are
the basic building block of hypertexts. For example,
some key words in a story such as Italy are
highlighted, and provide links to explanations of
those words in the same eXplorer story.
To insert a hyperlink in the metatext that links to a
chapter or an external URL is often simply called to
"link" (figure 5). Hypertext (meaning "more than
just text") is a form of text that provides a richer
functionality than simple metatext by allowing the
reader to learn about topics within the story by
clicking on key words. Typically the link anchor will
be descriptive of the target's content (e.g. Italy), for
example NCVA home page. Highlight the text to
become a Hypertext, choose New Capture or
External URL. New Chapter allows you to create a
new eXplorer snapshot (e.g. zoom, highlight
regions). When the Hypertext is initiated, eXplorer
will display the state-of-the-snapshot.
CSEDU 2010 - 2nd International Conference on Computer Supported Education
236
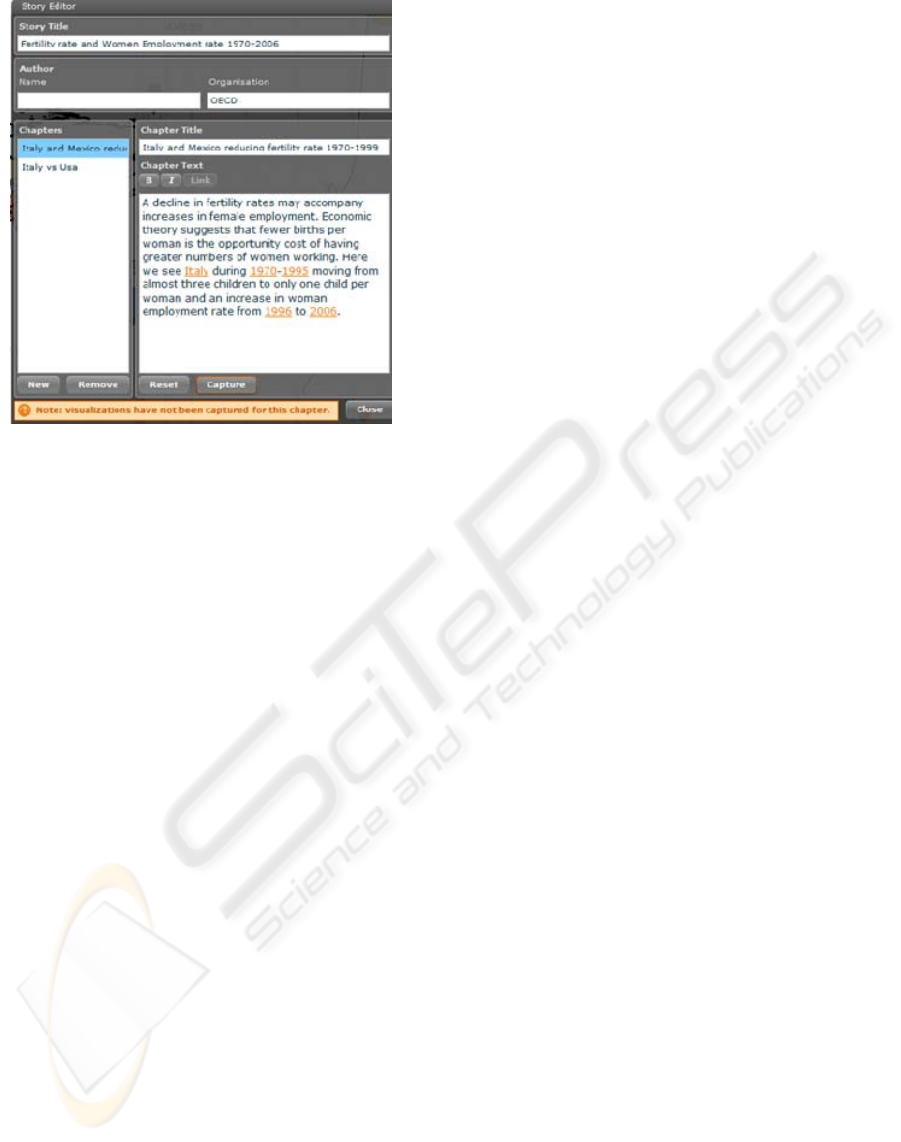
Figure 5: The Story Editor includes metatext with
hyperlinks and describes a discovery in an exploration
scenario here called “fertility rate and women employment
rate for 1970-2006” (figure 1). The story has two chapters.
5 CONCLUSIONS AND FUTURE
DEVELOPMENT
We expect that the web-enabled and collaborative
nature of the eXplorer platform will enhance the use
and understanding of statistics, thus adding to sound,
evidence-based policy decisions and transformed
into shared knowledge. At the same time, it will
encourage the practical use of advanced,
collaborative geovisual analytics technologies
because of its easy accessibility on the Internet. It
will enable the analyst to take a more active role in
the discovery process of exploring regional
indicators, for example, to identify those regional
areas that outperform other regions of their country
or mean values. The tool will increase the interest in
and knowledge of regional structures and
development patterns among specialist as well as
non-specialist users. The patterns of development
may differ widely in urban and rural areas and
regions may lag behind even when the national
economy is performing well. Comments from our
NCVA partners who have evaluated the tool
highlights the following features:
• eXplorer is free available;
• Easy-to-use external statistical data access;
• Ability to have dynamic time-link views and see
the multi-dimensionality of regional
development;
• Possibility to capture, save and open discoveries
(snapshots) with attached analytics reasoning
metadata;
• IT expertise is not required to publish interactive
visualization embedded in blogs and wikis;
• Important tool to publish statistics news on the
Web;
• Increased expectations in terms of user
experience;
• Will encourage more educational use of official
statistics;
NCVA is an associated partner to the OECD Global
Project on “Measuring the Progress of Societies”.
This “WikiProgress” project should represent the
catalyst of initiatives existing around the world on
the measurement of progress, as well as their use for
raising awareness amongst stakeholders, informing
them through statistical indicators describing
economic, social and environmental trends and
allowing them to discuss relevant issues through
storytelling based on solid evidence. WikiProgress
represents the place where both experts and public
share their analysis practices on indicators, about the
data that underlies our knowledge and hence our
action. OECD eXplorer has demonstrated that
geovisual analytics could represent a fundamental
tool in developing knowledge, thus making better
evidence based decisions possible and will provide
answers to questions like:
• Who is developing initiatives on measuring
progress (well-being, quality of life, etc.)?
• What type of classification do these initiatives
use?
• Which indicators are being used to measure the
different dimensions of progress?
• How is my country/region/community achieving
over time and in comparison to other similar
territories?
Our latest research includes a “Vislet”. A standalone
Flash application (widget) that is assembled from the
GAV Flash class library and Flex GUI tools (figure
6) and integrates selected statistical indicators
supported by highly interactive visualization with
descriptive metadata embedded into blogs, wikis or
any HTML document.
COLLABORATIVE EDUCATIONAL GEOANALYTICS APPLIED TO LARGE STATISTICS TEMPORAL DATA
237
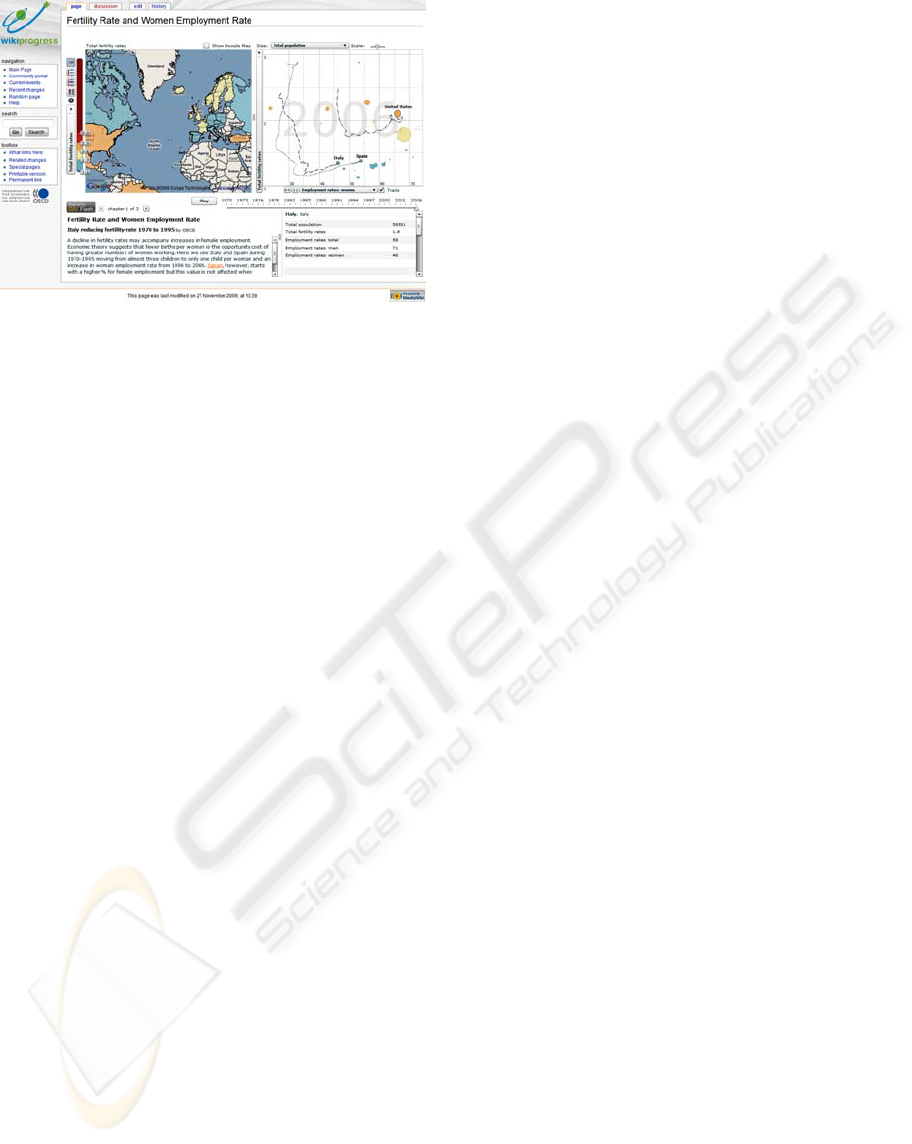
Figure 6: A proof-of-concept – A Story created in OECD
Factbook (figure 3) and here published in MediaWiki. A
vislet with two dynamic time-linked visualization views
choropleth map and scatter plot are embedded in a
wikiprogress article.
ACKNOWLEDGEMENTS
This applied research was carried out by NCVA
ITN, Linkoping University in close collaboration
with OECD who supplied data and comprehensive
evaluation. The research is in part supported by
funding from the “Visualization Program”
coordinated by the Swedish Knowledge Foundation.
The author thanks colleagues Tobias Åström, and
Markus Johnsson and special thanks to OECD Paris
for a dedicated contribution that made this project
possible.
REFERENCES
Andrienko, V., Andrienko, N., Voss, H., 2003. GIS for
Everyone: the Common GIS project and beyond,
Peterson M. (ed.), Maps and the Internet, Elsevier
Science, pp. 131-146
Andrienko, V., Andrienko, N., 2005. Visual exploration of
the spatial distribution of temporal behaviors. In
Proceedings of the International Conference on
Information Visualisation IEEE Computer Society.
Brodbeck, D., Girardin, L., 2003. Design study: using
multiple coordinated views to analyze geo-referenced
high-dimensional datasets. In Proceedings of the
Coordinated and Multiple Views in Exploratory
Visualization, IEEE Computer Society, pp. 104–111
Carr, D., White, D., MacEachren, A., 2005. Conditioned
choropleth maps and hypothesis generation. Annals of
the Association of American Geographers 95(1):32-
53. Chapala, GK.
Franzén, J., Jern, M., 2006. GeoAnalytics – Exploring
spatio-temporal and multivariate data, Reviewed
proceedings IV, London, published by IEEE
Computer Society.
Guo, D., Chen, J., MacEachren, A., Liao, K., 2006. A
visualization system for space-time and multivariate
patterns (VIS-STAMP). IEEE Visualization and
Computer Graphics vol 12(6).
Jern, M., 2001. Smart Documents for Web-Enabled
Collaboration, in “Digital Content Creation”, Vince,
J., and Earnshaw, R.A., (Eds), Springer Verlag.
Jern, M., Johansson, S., Pettersson, N., Feldt, H., 2005.
Tailor-made Exploratory Visualization for Statistics
Sweden, CMV 2005, London, published by IEEE
Computer Society.
Jern, M., Rogstadius, J., Åström, T., Ynnerman, A., 2008.
Visual Analytics presentation tools applied in HTML
Documents, Reviewed proceedings, IV08, London,
published by IEEE Computer Society.
Keel, P., 2006. Collaborative Visual Analytics: Inferring
from the Spatial Organisation and Collaborative use of
information, VAST 2006, pp.137-144, IEEE.
MacEachren, A.M., Brewer, I., 2001. Geovisualization to
mediate collaborative work: Tools to support different-
place knowledge construction and decision-making. In
20
th
International cartographic conference, Beijing,
China.
OECD 2009a. OECD eXplorer
http://stats.oecd.org/OECDregionalstatistics/
OECD 2009b. OECD Factbook
http://stats.oecd.org/oecdfactbook/
Roberts, J., 2004. Exploratory visualization with multiple
linked views. In Exploring Geovisualization.
MacEachren, A.M., Kraak, J., Dykes, J., eds,
Amsterdam.
Robinson, A., 2006. Re-Visualization: Interactive
Visualization of the Progress of Visual Analysis,
workshop proceedings, VASDS.
Wohlfart, M., Hauser, H., 2007. Story Telling for
Presentation. In: Volume Visualization EuroVis2007.
CSEDU 2010 - 2nd International Conference on Computer Supported Education
238
