
HEART-RATE ADAPTIVE MATCH FILTER
BASED PROCEDURE FOR AUTOMATIC DETECTION OF
T-WAVE ALTERNANS FROM 24-HOUR ECG RECORDINGS
Issues Related to Filter Implementation
Laura Burattini, Silvia Bini and Roberto Burattini
Department of Biomedical, Electronics and Telecommunication Engineering
Polytechnic University of Marche, 60131 Ancona, Italy
Keywords: T-wave alternans, Heart-rate adaptive-match filter, Repolarization analysis.
Abstract: Twenty-four hour T-wave alternans (TWA) analysis is a promising approach for risk stratification, which
still remains unpractical because TWA identification algorithms are complex and require long computation
time (CT). The aim of the present study was to test the applicability to 24-hour ECG recordings of our
heart-rate adaptive match filter (AMF) which allows TWA detection by submitting ECG data to a band-pass
filter centered at the TWA fundamental frequency f
TWA
, equal to a half heart rate. Two implementations are
possible: 1) the passing-band is adapted to a varying f
TWA
value (FA_AMF), and 2) the filter band is fixed
while conditioning the ECG data (SA_AMF). Simulated ECG tracings, characterized by no TWA or by
different kinds of TWA, and 24-hour ECG recordings from healthy subjects and coronary artery disease
patients were used to identify the fastest of these two implementations. Our results yielded the conclusions
that the CT of our AMF-based procedure is independent of the amount of TWA present in the tracing, but
depends on ECG sample length and filter implementation. If filter-design tools are available while
performing ECG analysis, the FA_AMF implementation is to be preferred because its CT is about one third
of SA_AMF CT.
1 INTRODUCTION
T-wave alternans (TWA) is an ECG phenomenon
consisting of every-other-beat changes in the T-
wave morphology. After Adam et al. (1984) reported
the existence of microvolt TWA, too small in
amplitude to be visually detected at standard display
scales, increasing evidence has been found of a link
between TWA and vulnerability to life-threatening
ventricular arrhythmias (Adam et al., 1984;
Rosenbaum et al., 1994; Verrier et al., 1994;
Bloomfield et al., 2004; Narayan, 2007; Chow et al.,
2008; Gold et al., 2008). Original observations of
this link arose from applications of fast Fourier
transform spectral method (Smith et al., 1988) for
TWA detection from ECG tracings of populations at
high risk for ventricular arrhythmias. To reach a
target heart-rate and meet data stationarity
requirements, Fourier analysis was applied to short-
term ECG tracings (typically 128 beats) recorded
under strictly controlled conditions, such as pacing
(Smith et al., 1988; Rosenbaum, 1994) or exercise
(Estes et al., 1997; Hohnloser et al., 1998; Gold et
al., 2000; Klingenheben et al., 2000; Hennersdorf et
al., 2001). Later on, time-domain based techniques,
with less restrictive requirements than Fourier
analysis, were proposed for more flexible TWA
analysis extended to long-term (20-minute to 24-
hour) ambulatory recordings (Nearing et al., 1991;
Burattini et al., 1999; Nearing et al., 2002; Martínez
et al., 2005; Burattini et al., 2006). These techniques
highlighted a strongly non-stationary nature of TWA
(Nearing et al., 1991; Martínez et al., 2006; Burattini
et al., 2008a and b). Especially, 24-hour Holter ECG
analysis was suggested as a promising approach for
risk stratification relative to cardiac arrest and
arrhythmic death in relatively low-risk subjects, such
as postmyocardial infarction patients (Verrier et al.,
2003, Sakaki et al., 2009). Analysis of long-term
ECG recordings for TWA identification is costly in
computation time (CT). This may limit real-time
analysis of ambulatory ECG recordings, unless an
optimized fast-running algorithm is set up.
401
Burattini L., Bini S. and Burattini R. (2010).
HEART-RATE ADAPTIVE MATCH FILTER BASED PROCEDURE FOR AUTOMATIC DETECTION OF T-WAVE ALTERNANS FROM 24-HOUR ECG
RECORDINGS - Issues Related to Filter Implementation.
In Proceedings of the Third International Conference on Bio-inspired Systems and Signal Processing, pages 401-408
DOI: 10.5220/0002694604010408
Copyright
c
SciTePress

To automatically detect stationary, as well as
time-varying TWA, we have recently proposed a
heart-rate adaptive match filter (AMF) based
procedure, which was tested by applications to a)
simulated ECG tracings, characterized by no TWA
or by different kinds of TWA, and b) ECG
recordings (up to 20-min long) from healthy subjects
and cardiac disease patients (Burattini et al., 2006,
Burattini et al., 2008a and b, Burattini et al., 2009a
and b). This procedure allows TWA detection by
submitting ECG data to bandpass filtering with
narrow passing band centered around the TWA
fundamental frequency f
TWA
(which, by definition,
equals a half heart rate), so that the TWA signal is
provided as output. Adaptation of the AMF to heart-
rate, and thus to f
TWA
, can be accomplished by two
different implementations. The first adapts the AMF
passing-band to the current f
TWA
value (adaptation at
the filter level; FA_AMF); the second assumes a
fixed filter band for conditioning the ECG data
(adaptation at the signal level; SA_AMF).
The aim of the present study was to set-up a low-
CT procedure suitable for real-time TWA analysis
by testing the applicability of our AMF-based
procedure to 24-hour ECG recordings, and to
analyze pros and cons of its FA_AMF and SA_AMF
implementations.
2 METHODS
2.1 Heart-Rate Adaptive Match Filter
Implementations
Our AMF is conceptually a bandpass filter (Burattini
et al., 2006 and 2008a and b), having a passing band
of 0.12 Hz (2·df=0.12 Hz implies df=0.06 Hz) wide
centered at the TWA fundamental frequency (f
TWA
).
When applied to a 128-beat ECG tracing, f
TWA
is
defined by the following equation:
MRR2
1
f
TWA
⋅
=
(1)
where MRR denotes mean RR interval, over 128
beats.
2.1.1 FA_AMF Implementation
After defining ω
1
=2π(f
TWA
-df) and ω
2
=2π(f
TWA
+df),
the AMF is implemented as a 6
th
order Butterworth
bandpass filter, whose transfer function H
BP
(ω) is
expressed as follows (Burattini et al., 2008):
6
1
6
1
6
2
2
BP
11
1
)(H
⎟
⎟
⎠
⎞
⎜
⎜
⎝
⎛
ω
ω
+
⎟
⎟
⎠
⎞
⎜
⎜
⎝
⎛
ω
ω
⋅
⎟
⎟
⎠
⎞
⎜
⎜
⎝
⎛
ω
ω
+
=ω
(2)
The input of the AMF is a 128-beat ECG signal
(ecg(t), t denoting time) potentially affected by
TWA. Its output is a constant phase and, possibly,
amplitude-modulated sinusoid, which represents
TWA and is, then, denominated ‘TWA signal’
(twa(t)). Consequently, if h
BP
(t) is the impulse
response function associated to H
BP
(ω), twa(t) is
given by the following equation:
(
)
(
)()
thtecgttwa
BP
∗
=
(3)
This implementation procedure is graphically
displayed in Fig. 1. When TWA is analyzed from
long-term ECG recordings by recursively (for
example every 10 s) extracting a 128-beat ECG
string from the entire recording (Burattini et al.,
2008), the passing band has to be relocated at f
TWA
,
which is a function of heart rate (eq. 1).
Consistently, this AMF implementation was called
filter-adapting AMF (FA_AMF). Specific steps for
TWA analysis are as follows:
1. Extraction of a 128-ECG string, ecg(t), from the
long-term recording.
2. f
TWA
computation from mean heart rate (eq. 1).
3. Setting of the 6
th
order Butterworth passing-band
at f
TWA
(eq. 2).
4. Filtering of ecg(t) with FA_AMF, according to
eq. 3, to obtain twa(t).
5. Exit, if the end of long term tracing is reached;
otherwise restart from step 1 after 10 seconds
time-increase.
Figure 1: Filter-adapting AMF implementation
(FA_AMF).
2.1.2 SA_AMF Implementation
The impulse response function h
BP
(t), associated to
the transfer function of eq. 2, can be synthesized by
using an appropriate designed low-pass filter.
Specifically, it is possible to show (see Appendix)
that h
BP
(t) can be expressed as:
BIOSIGNALS 2010 - International Conference on Bio-inspired Systems and Signal Processing
402
()
tcos)t(h2)t(h
TWALPBP
ω=
(4)
where ω
TWA
=2πf
TWA
, and h
LP
(t) is the impulse
response of a lowpass filter having ω
df
=2π·df cut-off
frequency. Indeed, the basic idea is to translate the
passing band around 0 Hz, so that it becomes
independent of f
TWA
, and move the heart-rate
dependency into the cosine (translation in the
frequency domain corresponds to modulation in the
time domain).
By substituting eq. 4 into eq. 3 (and recalling that
cos(x-y)=cos x cos y + sin x sin y ):
()
() () ( )()
() ( ) ( )()
() ( ) ( ) ( )
() ( ) ( ) ( )
()()()()
()()()()
dτthsinecgtsin2
dτthcosecgtcos2
dsintsinτthecg2
dcostcosτthecg2
dττ-tωcosτthτecg2
tωcost2htecg
twat
LPTWA
-
TWA
LPTWA
-
TWA
TWATWALP
-
TWATWALP
-
TWALP
TWA
LP
τ−τωτω+
+τ−τωτω=
=ττωω−τ+
+ττωω−τ=
=−=
=∗=
=
∫
∫
∫
∫
∫
∞+
∞
∞+
∞
∞+
∞
∞+
∞
∞+
∞−
Consequently,
()
()()()()()
[]
()()()()()
[]
thtsintecgtsin2
thtcostecgtcos2
twat
LPTWATWA
LPTWATWA
∗ωω+
+∗ωω=
=
(5)
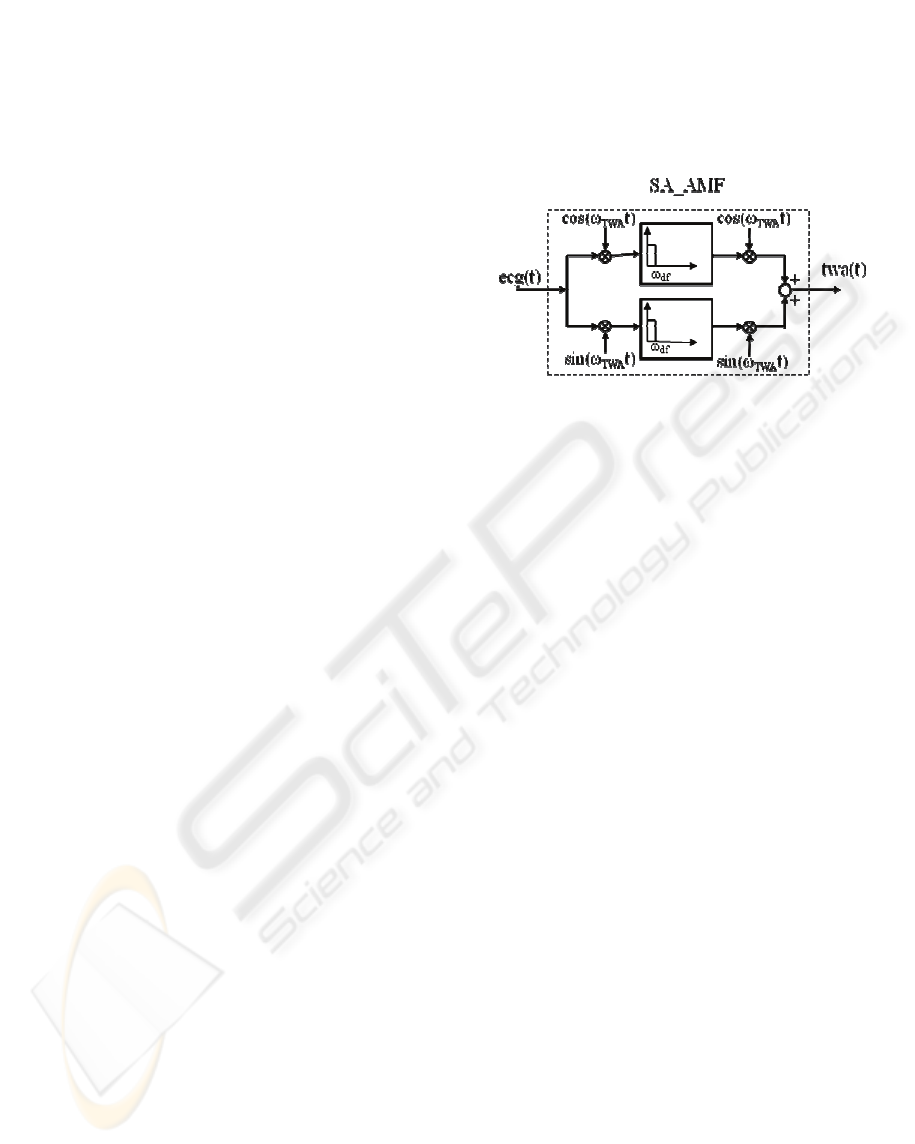
Based on this implementation, graphically shown in
Fig. 2, when TWA is recursively analyzed from
long-term ECG recordings, the passing band of the
two lowpass filters (which are identical) keeps
constant, while their input and output signals are
modulated to adapt to heart rate variations. This
AMF implementation is referred to as signal-
adapting AMF (SA_AMF), and each one of the
lowpass filters incorporated is set-up as a 3
rd
order
Butterworth filter. Specific steps for TWA analysis
are as follows:
1. ‘A priory’ design of a 3
rd
order Butterworth
lowpass filter with a cutoff frequency set at a
fixed df value.
2. Extraction of a 128-ECG string, ecg(t), from the
long-term recording.
3. Computation of ω
TWA
=2πf
TWA
, being f
TWA
defined by eq. 1.
4. Filtering of ecg(t) with SA_AMF, according to
eq. 5, to obtain twa(t).
5. Exit, if the end of long term tracing is reached;
otherwise restart from step 2 after 10 seconds
time-increase.
Figure 2: Signal-adapting AMF implementation
(SA_AMF).
2.2 FA_AMF vs. SA_AMF
Simulated and clinical ECG tracings (described in
2.3) were analysed by extracting 128 beats every 10
seconds (Burattini et al., 2008). Comparison
between FA_AMF and SA_AMF based TWA
detection procedures was performed in terms of
computation time (CT).
2.3 ECG Data
2.3.1 Simulated 128-Beat ECG Tracings
Basic simulated ECG tracing consisted of an 128-
fold repeated real and clean ECG complex sampled
at 200 samples/s. The RR interval was 0.750 s. Thus,
TWA fundamental frequency (f
TWA
) was 0.67 Hz ,
that is 1/(0.750×2 s) or 0.5 cycles per beat. T wave
was identified in a 160 ms window centred around
the T-wave apex. The endpoints samples of the T-
wave window (T
onset
and T
offset
) were localized 120
ms and 280 ms after the R peak.
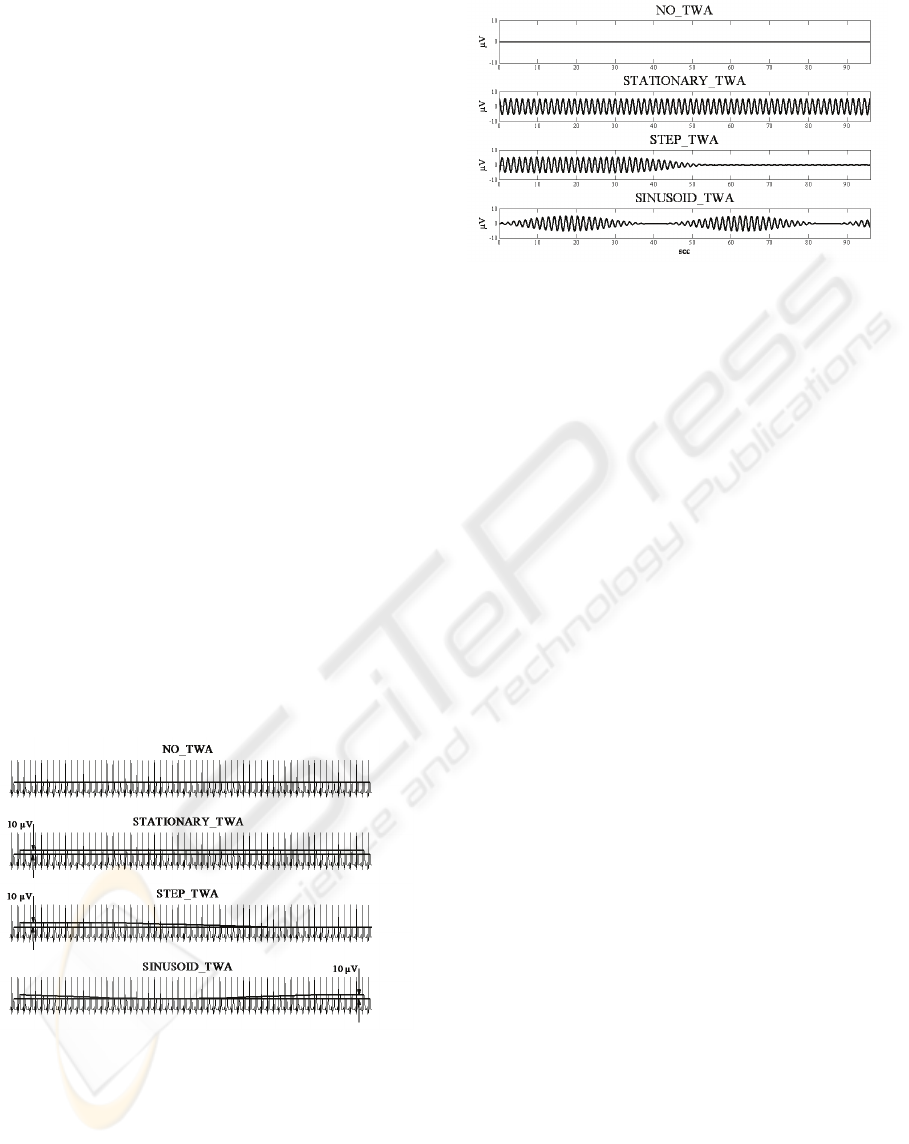
All simulated 128-ECG tracings are displayed in
Fig. 3. The first simulated ECG (NO_TWA)
represents the ideal case of a tracing not affected by
any kind of variability (basic cardiac complex
repeated with no changes). The second simulated
ECG (STATIONARY_TWA) was affected by a
stationary 10 μV TWA. Eventually, the third and the
forth simulated ECG tracings were affected by time-
varying (non-stationary) TWA, respectively
characterized by a smoothed step profile
(STEP_TWA; with 24 beats or 18 s transition time-
duration), and by a sinusoidal profile
HEART-RATE ADAPTIVE MATCH FILTER BASED PROCEDURE FOR AUTOMATIC DETECTION OF T-WAVE
ALTERNANS FROM 24-HOUR ECG RECORDINGS - Issues Related to Filter Implementation
403

(SINUSOID_TWA; with the sinusoid period of 60
beats or 45 s, and amplitude of 5 μV, yielding to a
maximum TWA amplitude of 10 μV).
Simulated long-term (20-minute and 24-hour)
tracings were obtained by repetition of the basic
128-beat ECG simulated strings.
2.3.2 Clinical ECG Tracings
Clinical tests were performed on 24-hour Holter
ECG recordings from 3 healthy (H) subjects and 3
coronary artery disease (CAD) patients. All subjects
pertain to the Intercity Digital Electrocardiology
Alliance (IDEAL) Study conducted following the
required rules for human subjects’ research
principles, according to the Declaration of Helsinki,
as well as to Title 45, U.S. Code of Federal
Regulations, Part 46, Protection of Human Subjects,
Revised November 13, 2001, effective December
13, 2001. The IDEAL protocol was approved by
Research Subject Review Board of the University of
Rochester. ECG tracings were acquired using the
SpaceLab-Burdick digital Holter recorder
(SpaceLab-Burdick, Inc., Deerfield, WI; sampling
frequency 200 samples/s).
2.4 Statistics
Each ECG tracing (either 128-beat, 20-minute or 24-
hour long) was analyzed five times, and mean and
standard deviation values of the CT were reported
(0.1 s resolution) and compared using Student’s t-
test. Associations between quantities was evaluated
using the correlation coefficient (r). Statistical
significance was assumed at P<0.05. Analysis were
performed on PC (Intel® Core™ Quad CPU Q9300
@ 2.50GHz, 3GB of RAM) using the MATLAB 7.0
development environment.
3 RESULTS
Fig. 4 shows the TWA signals obtained from both
FA_AMF-based (dotted line) and SA_AMF-based
(solid line) procedures when the input is represented
by the simulated data. For all simulated conditions
(namely NO_TWA, STATIONARY_TWA,
STEP_TWA, SINUSOID_TWA), the TWA-signal
outputs of FA_AMF implementation are not
distinguishable from the corresponding SA_AMF
ones. Thus, solid lines superimpose to dotted line in
the four panels of Fig.4.
Table 1 shows CT values of the two competing
filter implementations, in relation to different
simulated tracings lengths and to the four simulated
conditions specified above. FA_AMF column of this
table clearly shows that, for any given ECG tracing-
length (either 128 beats, or 20 minutes or 24 hours),
the CT is irrespective of TWA presence and kind.
This is true also for the SA_AMF implementation,
as judged from CT values in the related column of
Table 1. Comparison between corresponding CT
values of columns FA_AMF and SA_AMF, at 0.1 s
time resolution, shows no significant differences for
128-beat ECG analysis, while the FA_AMF
procedure is significantly faster than the SA_AMF
when applied to long-term (20-minute and 24-hour)
tracings. In absolute terms, for 20-minute ECGs, the
mean CT of FA_AMF differs by less than 2 seconds
compared to the FA_AMF implementation (1.2±0.0
s vs. 3.0±0.0; P<0.001). For 24-hour ECGs, the
SA_AMF mean CT (203.3±2.9 s) and the FA_AMF
mean CT (73.5±1.5 s) differ in such a way that the
ratio between the two is 2.77±0.03.
Mean (±SD) values for the FA_AMF and
SA_AMF implementations in individual H and CAD
cases are compared in Table 2. In the three H-
subjects, the MRR (0.74±0.08 s) is similar to that
(0.75 s) used in simulated cases. Also the mean CT
values of 24-hour simulations for FA_AMF
(73.4±0.8) and SA_AMF (203±2) are comparable
with the corresponding mean CTs from the three H
subjects (75.5±6.1 and 201±15, respectively).
On average, the ratio between SA_AMF CT and
FA_AMF CT is 2.67±0.13, a value comparable
(P<0.05) with that found in 24-hour simulated cases.
MRR variation between 0.660 and 1.130 s, over all
H and CAD cases, compared with corresponding CT
variations of SA_AMF and FA_AMF, suggests a
MRR-CT correlation, which is characterized by
r=0.99 and P<0.05 for both implementations.
4 DISCUSSION
Our AMF–based TWA identification algorithm is
substantially a bandpass filter which identifies TWA
by filtering out every ECG frequency component but
the TWA typical one (f
TWA
). This method has been
applied to 128-beat ECG recordings (Burattini et al.,
2006, 2008a and 2008b, 2009a) and to 20-minute
recordings (Burattini et al., 2008a and 2008b,
2009b). The latter study involved a recursive
application of the AMF procedure to 128-beat ECG
strings extracted every 10 seconds. On this basis,
from a theoretical point of view, our method appears
suitable for application to longer term tracings such
as 24-hour ECGs. Nevertheless, practical, routine
BIOSIGNALS 2010 - International Conference on Bio-inspired Systems and Signal Processing
404
applications of this technique to long recordings is
potentially limited by the CT required to identify
TWA. This possibility was tested in the present
study by analyzing the CT of two different
implementations of the AMF.
The first AMF implementation, referred to as
FA_AMF (Fig. 1), consists of a single 6
th
order
Butterworth bandpass filter. Since heart-rate is time
variant, the f
TWA,
defined as a half of mean heart rate,
is also time variant. Consequently, the FA_AMF
passing-band has to be recursively adapted to
properly detect TWA. This requires a real-time (i.e.
while analyzing TWA from the ECG) filter setting.
Thus, in the environment where TWA is analyzed
(for example in an ECG analysis machine),
availability of filter-design tools is required, such as
those provided by MATLAB.
The second AMF implementation, referred to as
SA_AMF (Fig. 2), is more complex for it involves
two identical lowpass filters and repeated signal
modulation. The 3
rd
order lowpass Butterworth
implementation of each one of these filters is
independent of heart rate and, thus, of f
TWA
.
Consequently, it can be designed ‘a priory’ and
imported in the TWA analysis environment, thus
releasing the need of recursive filter setting.
In this study we performed a quantitative
comparison of the two implementations, in terms of
CT, when analyzing 128-beat, 20-minute and 24-
hour simulated ECG recordings, and 24-hour clinical
ECG recordings. Both simulated and clinical
tracings were characterized by the same sampling
Figure 3: Central strings (about 45 s) of simulated 128-
beat ECG tracings. NO_TWA represents the ideal case of
a tracing not affected by any kind of modulation.
STATIONARY_TWA represents an ECG affected by a
stationary TWA of 10 μV. STEP_TWA represents an
ECG affected by TWA that varies from 10 μV to 0 μV
following a smoothed step profile. SINUSOIDAL_TWA
represents an ECG affected by TWA that varies from 10
μV to 0 μV following a sinusoidal profile.
Figure 4: Output TWA signals provided by the FA_AMF
(dotted line) and SA_AMF (solid line) based procedures,
when the inputs are the 128-beat simulated ECG tracings
with: no TWA (NO_TWA), stationary TWA
(STATIONARY_TWA), smoothed step TWA
(STEP_TWA) and sinusoidal TWA (SINUSOID_TWA).
For all the simulated conditions, the two estimated TWA
signals superimpose, so that dotted lines are not visible.
frequency (200 samples/sec), so that the number of
samples in a 24-hour recording is the same.
Results of the simulation study show that, for
any given ECG tracing length, the CT of related
filter implementation is irrespective of TWA
presence and kind. Comparison between
corresponding CT values of FA_AMF and SA_AMF
implementations indicates that, for short-time ECG
recordings, the two are equivalent, while the
FA_AMF procedure is significantly faster when
applied to long-term tracings (Table 1). In the
specific, when analyzing 24-hour recordings, the
ratio between CT of SA_AMF and CT of FA_AMF
was, on average, almost three times larger.
These observations are confirmed by the results
on the 24-hour clinical data. Indeed, the ratio of 2.67
between the CT of SA_AMF and FA_AMF is not
significantly different from that of 2.77 found for the
simulated 24-hour tracings.
In our clinical data, a strong correlation (r=0.99;
P<0.05) was observed between MRR over 24 hours
and corresponding CT of either one of the two
implementations. This result finds an explanation in
that 128-beat ECG are recursively submitted to the
AMF. These ECG segments, although matching in
terms of number of beats, are characterized by a
different length in terms of number of samples. The
longer the RR interval, the higher the number of
samples, and thus, the longer the required CT. This
observation is supported by the facts that simulated
and clinical data are characterized by similar MRR
and similar mean 24-hour CTs for both FA_AMF
and SA_AMF implementations (see Results). The
HEART-RATE ADAPTIVE MATCH FILTER BASED PROCEDURE FOR AUTOMATIC DETECTION OF T-WAVE
ALTERNANS FROM 24-HOUR ECG RECORDINGS - Issues Related to Filter Implementation
405

Table 1: Computation time (CT, seconds) of FA_AMF- and SA_AMF-based TWA detection procedures applied to 128-
beat, 20-minute and 24-hour simulated ECG recordings, in the absence of TWA, or in the presence of different kinds of
TWA. Mean CT±SD values are computed over five algorithm runs.
CT of FA_AMF (s) CT of SA_AMF (s) P (Student’s t test)
128-beat ECGs
NO_TWA 0.1±0.0 0.1±0.0 NS
STATIONARY_TWA 0.1±0.0 0.1±0.0 NS
STEP_TWA 0.1±0.0 0.1±0.0 NS
SINUSOID_TWA 0.1±0.0 0.1±0.0 NS
20-minute ECGs
NO_TWA 1.2±0.0 3.0±0.0 <0.001
STATIONARY_TWA 1.2±0.0 3.0±0.0 <0.001
STEP_TWA 1.2±0.0 3.0±0.0 <0.001
SINUSOID_TWA 1.2±0.0 3.0±0.0 <0.001
24-hour ECGs
NO_TWA 73.1±1.9 201.1±3.4 <0.001
STATIONARY_TWA 74.5±0.6 204.8±2.5 <0.001
STEP_TWA 72.7±1.6 204.6±1.0 <0.001
SINUSOID_TWA 73.5±1.2 202.5±3.2 <0.001
Table 2: Computation time (CT, seconds) of FA_AMF- and SA_AMF-based TWA detection procedures applied to 24-hour
ECG recordings of three H-subjects (H1, H2, and H3) and three CAD patients (CAD1, CAD2, and CAD3). Mean CT±SD
values are computed over five algorithm runs.
MRR (s) CT of FA_AMF (s) CT of SA_AMF (s) P (Student’s t test)
24-hour ECGs
H1 0.660 68.9±1.0 186.1±3.2 <0.001
H2 0.757 76.8±0.8 202.0±3.3 <0.001
H3 0.814 80.9±1.4 215.7±1.1 <0.001
CAD1 0.960 98.5±0.1 241.0±1.4 <0.001
CAD2 1.091 103.9±2.0 281.7±9.7 <0.001
CAD3 1.130 105.9±0.6 303.0±2.6 <0.001
above mentioned high correlation between mean RR
and CT was obtained considering together H-
subjects, who are not supposed to show significant
TWA levels, and CAD-patients, who instead are
known to show increased levels of TWA (Burattini
et al., 2008a and 2009a). This result agrees with the
result, obtained with simulated data, that the CT is
irrespective of TWA presence and kind. Altogether,
our results suggest that the FA_AMF
implementation is preferable as it is faster. This
advantage, however, conflicts with the limitation
relying on the need of filter-design tools that are not
commonly available in clinical environments. On the
other hand, when using the SA_AMF, the CT
assumes, over 24-hour ECGs, values of few minutes
(up to five in our results; Table 1 and Table 2).
These CT values can be considered acceptable for
real time computation in light of the fact that the
operator is made free from the need of filtering
design tools.
5 CONCLUSIONS
In conclusion, our AMF-based procedure for TWA
identification proved to be appropriate for
applications to 24-hour recordings. If filter design
tools are available while performing the analysis, the
FA_AMF implementation is to be preferred because
it allows faster analysis of 24-hour recordings, with
CT ratio between SA_AMF and FA_AMF being
about 2.7. Otherwise, SA_AMF implementation can
be performed, which provides TWA identification
with a CT of a few minutes.
BIOSIGNALS 2010 - International Conference on Bio-inspired Systems and Signal Processing
406

REFERENCES
Adam, D.R., Smith, J.M., Akselrod, S., Nyberg, S.,
Powell, A.O., Cohen, R.J., 1984, Fluctuations in T-
wave morphology and susceptibility to ventricular
fibrillation, J Electrocardiol, 17: 209-218.
Bloomfield, D.M., Steinman, R.C., Namerow, P.B.,
Parides, M., Davidenko, J., Kaufman, E.S., Shinn, T.,
Curtis, A., Fontaine, J., Holmes, D., Russo, A., Tang,
C., Bigger, J.T. Jr, 2004, Microvolt T-wave alternans
distinguishes between patients likely and patients not
likely to benefit from implanted cardiac defibrillator
therapy: a solution to the Multicenter Automatic
Defibrillator Implantation Trial (MADIT) II
conundrum, Circulation, 110: 1885-1889.
Burattini, L., Zareba, W., Moss, A.J., 1999, Correlation
method for detection of transient T-wave alternans in
digital Holter ECG recordings, Annals of Noninvasive
Electrocardiol, 4: 416-424.
Burattini, L., Zareba, W., Burattini, R., 2006, Automatic
detection of microvolt T-wave alternans in Holter
recordings: effect of baseline wandering, Biomed
Signal Process Control, 1: 162-168.
Burattini, L., Zareba, W., Burattini, R., 2008, Adaptive
match filter based method for time vs. amplitude
characterization of microvolt ECG T-wave alternans,
Ann Biomed Eng, 36: 1558-1564.
Burattini, L., Zareba, W., Burattini, R., 2008b,
Identification of time-varying T-wave alternans from
20-Minute ECG recordings, In Proceedings of
BIOSTEC 2008, International Joint Conference on
Biomedical Engineering Systems and Technologies,
Funchal, Madeira, Portugal, January 28-31, 186-192.
Burattini, L., Zareba, W., Burattini, R., 2009, Assessment
of physiological amplitude, duration and magnitude of
ECG T-wave alternans, Ann Noninvasive
Electrocardiol, 14: 366-374.
Burattini, L., Bini, S., Burattini, R., 2009b, Comparative
analysis of methods for automatic detection and
quantification of microvolt T-wave alternans, Med
Eng Phys, [Epub ahead of print],
doi:10.1016/j.medengphy.2009.08.009.
Chow, T., Kereiakes, D.J., Onufer, J., Woelfel, A.,
Gursoy, S., Peterson, B.J., Brown, M.L., Pu, W.,
Benditt, D.G., MASTER Trial Investigators, 2008.
Does microvolt T-wave alternans testing predict
ventricular tachyarrhythmias in patients with ischemic
cardiomyopathy and prophylactic defibrillators? The
MASTER (Microvolt T Wave Alternans Testing for
Risk Stratification of Post-Myocardial Infarction
Patients) trial. J Am Coll Cardiol, 52: 1607-1615.
Estes, N.A. 3
rd
, Michaud, G., Zipes, D.P., El-Sherif, N.,
Venditti, F.J., Rosenbaum, D.S., Albrecht, P., Wang,
P.J., Cohen, R.J., 1997, Electrical alternans during
rest and exercise as predictors of vulnerability to
ventricular arrhythmias, Am J Cardiol, 80: 1314-
1318.
Gold, M.R., Bloomfield, D.M., Anderson, K.P., El-Sherif,
N.E., Wilber, D.J., Groh, W.J., Estes, N.A. 3rd,
Kaufman, E.S., Greenberg, M.L., Rosenbaum, D.S.,
2000, A comparison of T-wave alternans, signal
averaged electrocardiography and programmed
ventricular stimulation for arrhythmia risk
stratification, J Am Coll Cardiol, 36: 2247-2253.
Gold, M.R., Ip, J.H., Costantini, O., Poole, J.E., McNulty,
S., Mark, D.B., Lee, K.L., Bardy, G.H., 2008, Role of
microvolt T-wave alternans in assessment of
arrhythmia vulnerability among patients with heart
failure and systolic dysfunction: primary results from
the T-wave alternans sudden cardiac death in heart
failure trial substudy, Circulation, 118: 2022-2028.
Hennersdorf, M.G., Niebch, V., Perings, C., Strauer, B.E.,
2001, T wave alternans and ventricular arrhythmias in
arterial hypertension, Hypertension, 37: 199-203.
Hohnloser, S.H., Klingenheben, T., Li, Y.G., Zabel, M.,
Peetermans, J., Cohen, R.J., 1998, T wave alternans as
a predictor of recurrent ventricular tachyarrhythmias
in ICD recipients: prospective comparison with
conventional risk markers, J Cardiovasc
Electrophysiol, 9: 1258-1268.
Klingenheben, T., Zabel, M., D'Agostino, R.B., Cohen,
R.J., Hohnloser, S.H., 2000, Predictive value of T-
wave alternans for arrhythmic events in patients with
congestive heart failure, Lancet, 356: 651-652.
Martínez, J.P., Olmos, S., 2005, Methodological principles
of T wave alternans analysis: a unified framework,
IEEE Trans Biomed Eng, 52: 599-613.
Martínez, J.P., Olmos, S., Wagner, G., Laguna, P., 2006,
Characterization of repolarization alternans during
ischemia: time-course and spatial analysis, IEEE
Trans Biomed Eng, 53: 701-711.
Narayan, S.M., 2007, T-wave alternans and human
ventricular arrhythmias: what is the link?. J Am Coll
Cardiol, 49: 347-349.
Nearing, B.D., Huang, A.H., Verrier, R.L., 1991, Dynamic
tracking of cardiac vulnerability by complex
demodulation of the T wave, Science, 252: 437-440.
Nearing, B.D., Verrier, R.L., 2002, Modified moving
average analysis of T-wave alternans to predict
ventricular fibrillation with high accuracy, J Appl
Physiol, 92: 541-549.
Rosenbaum, D.S., Jackson, L.E., Smith, J.M., Garan, H.,
Ruskin, J.N., Cohen, R.J., 1994, Electrical alternans
and vulnerability to ventricular arrhythmias, N Engl J
Med, 330: 235-241.
Sakaki, K., Ikeda, T., Miwa, Y., Miyakoshi, M., Abe, A.,
Tsukada, T., Ishiguro, H., Mera, H., Yusu, S.,
Yoshino, H., 2009, Time-domain T-wave alternans
measured from Holter electrocardiograms predicts
cardiac mortality in patients with left ventricular
dysfunction: a prospective study, Heart Rhythm, 6:
332-337.
Smith, J.M., Clancy, E.A., Valeri, C.R., Ruskin, J.N.,
Cohen, R.J., 1988, Electrical alternans and cardiac
electrical instability, Circulation, 77: 110-121.
Verrier, R.L., Nearing, B.D., 1994, Electrophysiologic
basis for T wave alternans as an index of vulnerability
to ventricular fibrillation,J Cardiovasc Electrophysiol,
5: 445–461.
Verrier, R.L., Nearing, B.D., La Rovere, M.T., Pinna,
G.D., Mittleman, M.A., Bigger, J.T. Jr, Schwartz, P.J.,
ATRAMI Investigators, 2003, Ambulatory
electrocardiogram-based tracking of T wave alternans
in postmyocardial infarction patients to assess risk of
HEART-RATE ADAPTIVE MATCH FILTER BASED PROCEDURE FOR AUTOMATIC DETECTION OF T-WAVE
ALTERNANS FROM 24-HOUR ECG RECORDINGS - Issues Related to Filter Implementation
407

cardiac arrest or arrhythmic death, J Cardiovasc
Electrophysiol, 14: 705-711.
APPENDIX
Consider a filter having the following unit impulse
response:
(
)
tcos)t(h2)t(h
TWALP
ω=
(A1)
where h
LP
(t) is the unit impulse response of a
lowpass filter with cutoff frequency df. By taking
the Fourier transform of h(t) we get:
()
()
()
()
()
()
1
2()cos
2
1
2
TWA TWA
jt
LP TWA
jt jt
LP LP
H
ht te dt
hte hte dt
ω
ωω ωω
ω
ω
π
π
+∞
−
−∞
+∞
−− −+
−∞
=
==
=+
∫
∫
(A2)
Upon examination of eq. A2, it is seen that the first
summation term is equal to a right-shifted by ω
TWA
version of the LP frequency response, while the
second term corresponds to a left-shifted by ω
TWA
version of the LP frequency response. Thus, the
frequency response associate to h(n) is:
() ( ) ( )
TWALPTWALP
HHH ω+ω
+
ω−ω=ω
(A3)
The magnitude of the first component in eq. A3 is
seen to equal the magnitude of LP shifted by ω
TWA
radians. That is, it corresponds to the rightmost
passband centered at ω
TWA
. Similarly, the magnitude
of the second term corresponds to the leftmost
passband centered at ω
TWA
. Thus, we can conclude
that the filter, whose frequency response is
represented in eq. A3, can be used to implement our
AMF:
() ()
ω=ω HH
BP
(A4)
BIOSIGNALS 2010 - International Conference on Bio-inspired Systems and Signal Processing
408
