
ARTIFICIAL NEURAL NETWORK MODEL APPLIED
TO A PEM FUEL CELL
D. S. Falcão
1
, J. C. M. Pires
2
, C. Pinho
1
, A. M. F. R. Pinto
1
and F. G. Martins
2
1
CEFT - Centro de Estudos de Fenómenos de Transporte
2
LEPAE - Laboratório de Engenharia de Processos, Ambiente e Energia
Faculdade de Engenharia da Universidade do Porto, Rua Dr. Roberto Frias, s/n, 4200-465 Porto, Portugal
Keywords: Artificial neural networks (ANN), Proton Exchange Membrane Fuel Cell (PEMFC), Modelling.
Abstract: This study proposes the simulation of PEM fuel cell polarization curves using artificial neural networks
(ANN). Fuel cell performance can be affected by numerous parameters, namely, reactants pressure,
humidification temperature, stoichiometric flow ratios and fuel cell temperature. In this work, the influence
of relative humidity (RH) of the gases, as well as gases and fuel cell temperatures was studied. A
feedforward ANN with three layers was applied to predict the influence of those parameters, simulating the
voltage of a fuel cell of 25 cm
2
area. Different ANN models were tested, varying the number of neurons in
the hidden layer (1 to 6). The model performance was evaluated using the Pearson correlation coefficient
(R) and the index of agreement of the second order (d
2
). The results showed that feedforward ANN can be
used with success in order to obtain the optimal operating conditions to improve PEM fuel cell performance.
1 INTRODUCTION
Fuel cells are an innovative alternative to current
power sources with potential to achieve higher
conversion efficiencies thus reducing the
environmental impact. In particular, the proton-
exchange membrane (PEM) fuel cells are today in
the focus of interest as one of the most promising
developments in power generation with a wide range
of applications in transportation and in portable
electronics. Although prototypes of fuel cell vehicles
and residential fuel cell systems have already been
introduced, their cost must be reduced and their
efficiencies enhanced.
To achieve optimal fuel cell performance, it is
critical to have an adequate water balance to ensure
that the membrane remains hydrated for sufficient
proton conductivity, while cathode flooding and
anode dehydration are avoided (Baschuk and Li,
2000; Biyikoglu, 2005). Water content of the
membrane is determined by the balance between
water production and three water transport
processes: electro-osmotic drag of water (EOD),
associated with proton migration through the
membrane; back diffusion from the cathode; and
diffusion of water to/from the oxidant/fuel gas
streams. Understanding the water transport in the
PEM is a guide for materials optimization and
developments of new Membrane Electrode
Assemblies (MEA’s).
Mathematical modelling and simulation are
needed as tools for design optimization of fuel cells.
In this work, the effect of anode/cathode relative
humidity, reactants temperatures and fuel cell
temperature on the performance of a PEMFC with
multiserpentine flow channels is studied and the
results are compared to the predictions of an
artificial neural networks (ANN) based model. ANN
is a statistical model that is applied in different
fields, such as, process control, optimization,
medical diagnosis, decision making, signal and
speech processing (Gupta and Achenie, 2007; Nagy,
2007; Uncini, 2003). ANN models are characterized
by a set of processing neurons with an activation
function that are distributed in layers (input, hidden
and output layers). One of the problems of the
training step is the overfitting. A high number of
iterations lead to decrease the error in the training
set, but the achieved model presents a large error
when applied to a new set. A method often applied
to solve this problem is the early stopping (Nguyen
et al., 2005; Özesmi et al., 2006). Using this method,
the data should be divided into three sets (Chiang et
al., 2004): (i) the training set, used to determine the
435
Falcão D., Pires J., Pinho C., Pinto A. and Martins F. (2009).
ARTIFICIAL NEURAL NETWORK MODEL APPLIED TO A PEM FUEL CELL.
In Proceedings of the International Joint Conference on Computational Intelligence, pages 435-439
DOI: 10.5220/0002317604350439
Copyright
c
SciTePress
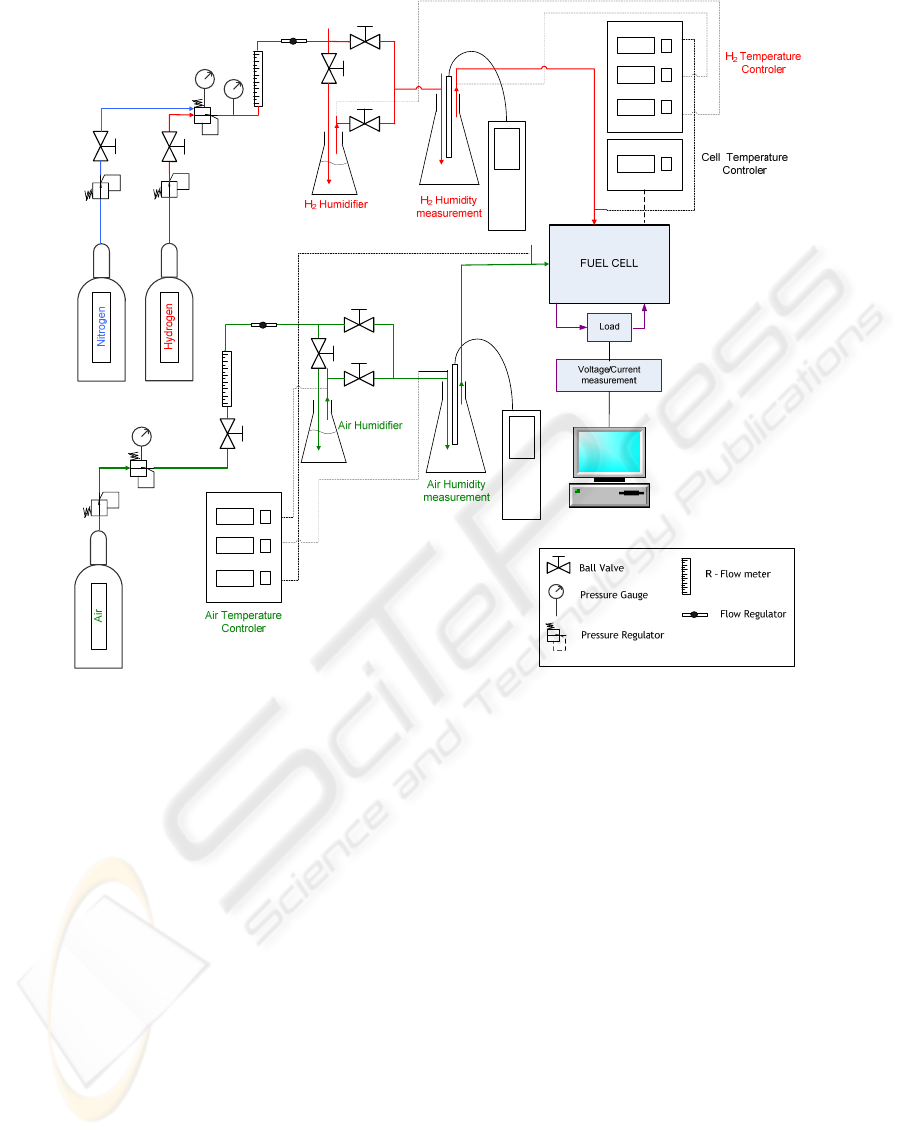
Figure 1: Schematic representation of the experimental set-up.
model parameters; (ii) the validation set, used to
evaluate the performance of ANN model during the
training step and to stop it when the validation error
starts to increase; and (iii) the test set, used to
evaluate the ANN performance when applied to a
new set. Some studies applying ANN models to fuel
cells can be found in recent literature (Ogaji et al.,
2006; Saengrung et al., 2007; Ou and Achenie,
2005). Ogaji et al. (2006) applied these models to
simulate the performance of solid oxide fuel cells
ANN presented great accuracy. Saengrung et al.
(2007) tried to predict the performance of a
commercial proton exchange membrane using two
ANN models. Both models presented successful
predictions of the stack voltage and current of the
fuel cell. Ou and Achenie (2005) compared the
performance of ANN and two hybrid models for
predicting the voltage of proton exchange membrane
fuel cells. The models presented similar
performance.
The scope of this work is the application of an
ANN model to predict fuel cells polarization curves
and verify the feasibility of this application.
2 EXPERIMENTAL SYSTEM
A schematic drawing of the experimental apparatus
used in this work is shown in Figure 1
Pure hydrogen (humidified or dry) as fuel and air
(humidified or dry) as oxidant are used. The pressure
of the gases is controlled by pressure regulators
(Air- Norgreen 11400, H
2
- Europneumaq mod. 44-
2262-241) and the flow rates are controlled by flow
meters (KDG – Mobrey).
The reactants humidity and temperatures are
monitored by adequate humidity and temperature
probes (Air – Testo, H
2
– Vaisala). The
humidification of air and hydrogen gases is
conducted in Erlenmeyer flasks by a simple
bubbling process. To control the humidification
temperature, each Erlenmeyer flask is thermally
isolated and surrounded by an electrical resistance
(50 W/m) activated by a Osaka OK 31 digital
IJCCI 2009 - International Joint Conference on Computational Intelligence
436
temperature controller. The same procedure is
applied along the connecting pipes from the
humidification point up to the entrance of the fuel
cells to guarantee the temperature stabilization of
each reacting gas flow, as well as to control the
operating temperature of the fuel cell. For the
measurement and control of the cell electrical
output, an electric load reference LD300 300W DC
Electronic Load from TTI is used. This device could
work with five different operating modes:
- Constant current – two possibilities were
available, 0 to 8 A (with 1 mA resolution) and 0 to
80 A (10 mA resolution), with a precision of ±0.2
%+20 mA;
- Constant voltage – two possibilities were
available, Vmin up to 8 V (1 mA resolution) and
Vmin up to 80 V (10 mA resolution (were V min is
10 mV for low power situation and 2 V for 80 A).
Precision is ±0.2 %+2 digits;
- Constant power – the available power range
goes from 0 till 320 W, with a precision of 0.5 %+2
W;
- Constant conductance - operating range from
0.01 up to 1 A/V (1 A/V resolution) and from 0.2 up
to 40 A/V (resolution of 0.01 A/V) with a precision
of 0.5 %+2 digits;
- Constant resistance – operating range from 0.04
up to 10 Ω (0.01 Ω resolution) and from 2 to 40 Ω
(with 0.1 Ω resolution) with a precision of 0.5 %+2
digits.
This load was connected to a data acquisition
system composed by Measurement Computing
boards installed in a desktop computer. The used
data acquisition software was DASYLab.
In the present work, all the components of the
PEMFC were “in house” designed, with exception
of the MEA. A Dupont Nafion 111 MEA with 25
cm
2
active surface area is used. The channels
configuration used for the anode and cathode flow
channels (multiserpentine design) is represented in
Figure 2. Channels depth is 0.6 mm for anode side
and 1.5 mm for cathode side.
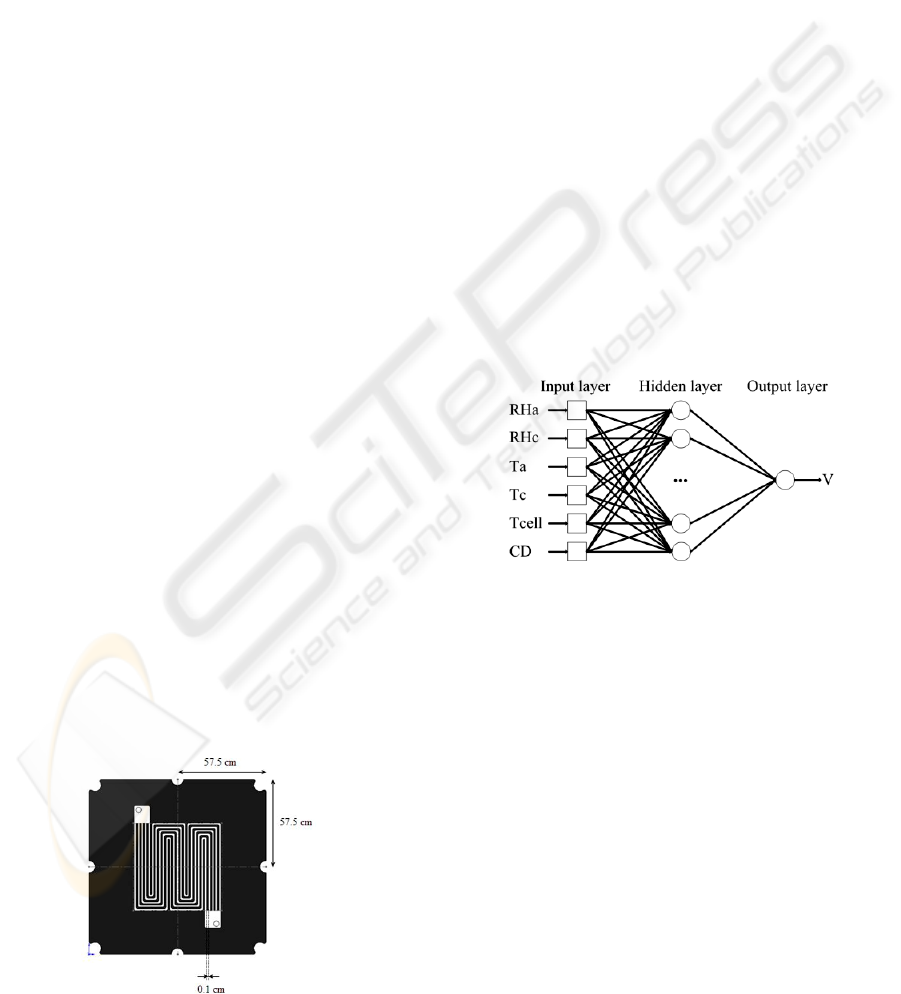
Figure 2: Flow channels configuration and dimensions.
3 ANN MODEL
In this study, a feedforward ANN with three layers
was applied to predict the voltage (V) of a PEM fuel
cell. The input variables (see Figure 3) were: Anode
Relative Humidity (RHa), Cathode Relative
Humidity (RHc), Anode flow rate Temperature (Ta),
Cathode flow rate Temperature (Tc), Cell
Temperature (Tcell) and Current Density (CD).
Hyperbolic tangent and linear functions were used as
activation functions in hidden and output neurons,
respectively. The objective function was the
minimization of the mean squared error of the
training data. The early stopping method was
applied and the data was divided into three sets
(training – 124 data points; validation – 25 data
points; and test – 38 data points). Different ANN
models were tested, varying the number of neurons
in the hidden layer (1 to 6). For each structure, 100
runs were performed. The best ANN model
corresponded to the minimum error in the training
and validation data. The model performance was
evaluated using the Pearson correlation coefficient
(R) and the index of agreement of the second order
(d
2
) (Sousa et al., 2007).
Figure 3: ANN structure for fuel cell electric voltage
modelling.
4 RESULTS
In this work, the influences of gases relative
humidity and temperature and cell temperature were
studied. Additionally, several ANN models were
tested to predict the voltage using some
experimental conditions. The early stopping
methodology was applied to improve the
generalization of the ANN models obtained. The
data were divided into three sets: training, validation
and test. Training and validation sets were used to
determine the ANN model parameters. The test set
was used to evaluate the performance of ANN
model when applied to a new set (not influencing the
determination of the model parameters). The best
ARTIFICIAL NEURAL NETWORK MODEL APPLIED TO A PEM FUEL CELL
437
model, containing 6 hidden neurons, adjusts very
well experimental results, as can be seen in Figures
4 to 8. Accordingly, the performance indexes
obtained by this statistical model are presented in
Table 1. The values showed that the achieved ANN
model is good for predictive purposes.
Table 1: Performance indexes (R and d
2
) in training,
validation and test sets.
Set Training Validation Test
R
0.99 0.99 0.91
d
2
1.00 1.00 0.96
Figures 6 and 8 with a Tcell of 333 K and Figure 7
with a Tcell of 313 K show the performance of the
model in test set. The remaining figures show the
performance in the training and validation sets.
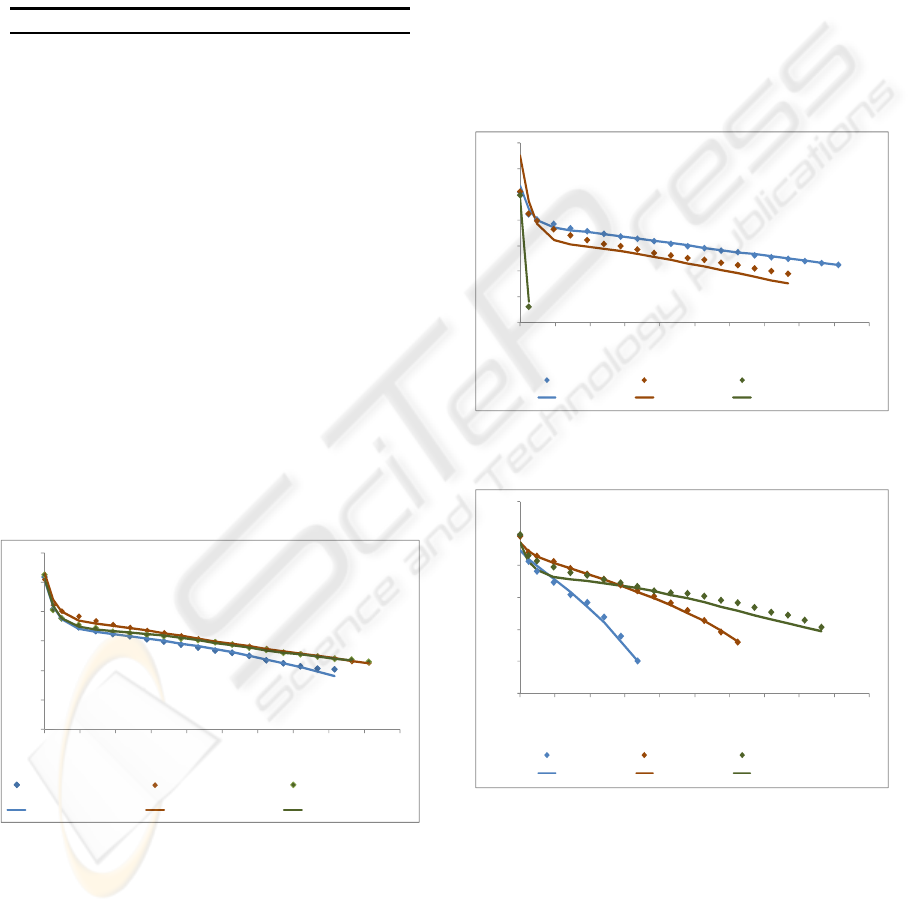
4.1 Influence of the Relative Humidity
of Reactants Gases
To study the influence of gases RH, three
experiments were done: two with only the anode or
cathode stream humidified and another with both
gases streams humidified. As can be seen in Fig. 4,
the best fuel cell performance was achieved when
both streams were humidified. Relatively to the
other two experiments, best results were obtained
when just the anode stream was humidified. In fact,
the water production occurs at the cathode side. So,
for these operating conditions, the cathode
humidification is dispensable.
Figure 4: Experimental and modelling data for dry anode
or cathode and for both gases humidified, for gases and
cell temperatures of 298 K.
4.2 Influence of Cell Temperature and
Reactant Gases Temperature
The influence of cell temperature was studied for
two gases humidification temperatures: 298 K and
333 K and the influence of gases temperature for
two cell temperatures: 298 K and 333 K. Fig. 5, 6, 7
and 8 show that the best performance was achieved
when the cell temperature is the same as the reactant
gases temperature. So, for all experiments, better
results were obtained for a cell temperature/gases
temperature of 298 K and 333 K. If the cell
temperature is higher than the gases temperature, the
membrane will dry and the proton conductivity is
severely affected. If the cell temperature is lower
than the gases temperature, the membrane will flood.
Excessive water amounts filling the pores inhibit the
access to active sites and block the transport of
gaseous reactants and products.
Figure 5: Experimental and modelling data for different
cell temperatures, for fully humidified gases at 298 K.
Figure 6: Experimental and modelling data for different
cell temperatures, for fully humidified gases at 333 K.
Curiously, in Figures 6 and 7, for lower current
densities, better results are obtained for Tcell/gases
temperature of 313 K. For lower current densities,
the water production in the cathode is lower and, so,
the introduction of more water improves the cell
performance.
0.0
0.2
0.4
0.6
0.8
1.0
1.2
0.00 0.05 0.10 0.15 0.20 0.25 0.30 0.35 0.40 0.45 0.50
Volt a ge [V]
Current Density [A/cm
2
]
RHa=5%, RHc=95% Exp RHa=95%, RHc=95% Exp RHa=95%, RHc=5% Exp
RHa=5%, RHc=95% Model RHa=95%, RHc=95% Model RHa=95%, RHc=5% Model
0.0
0.2
0.4
0.6
0.8
1.0
1.2
1.4
0.00 0.05 0.10 0.15 0.20 0.25 0.30 0.35 0.40 0.45 0.50
Volt age [V ]
Current Density [A/cm
2
]
Tcell=298 K Exp Tcell=313 K Exp Tcell=333 K Exp
Tcell=298 K Model Tcell=313 K Model Tcell=333 K Model
0.0
0.2
0.4
0.6
0.8
1.0
1.2
0.00 0.05 0.10 0.15 0.20 0.25 0.30 0.35 0.40 0.45 0.50
Vo lt age [V ]
Current Density [A/cm
2
]
Tcell=298 K Exp Tcell=313 K Exp Tcell=333 K Exp
Tcell=298 K Model Tcell=313 K Model Tcell=333 K Model
IJCCI 2009 - International Joint Conference on Computational Intelligence
438
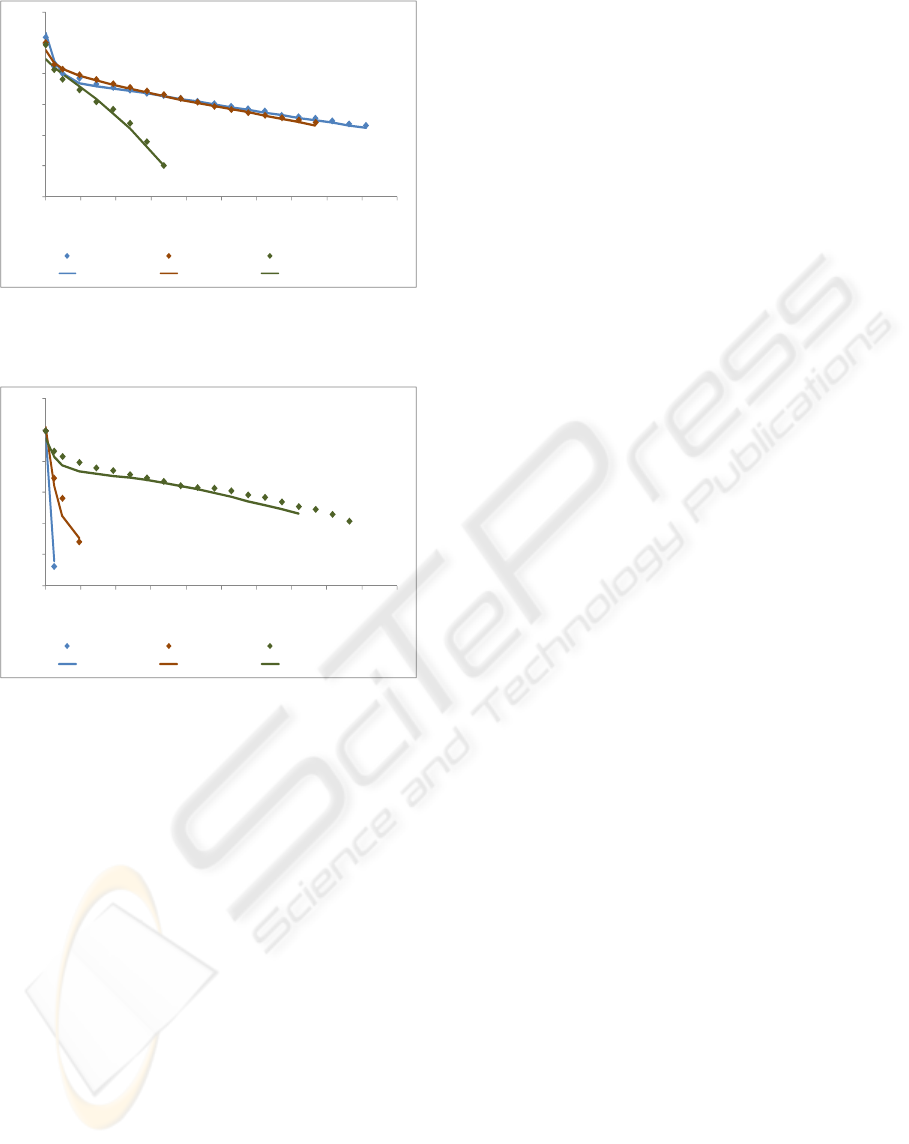
Figure 7: Experimental and modelling data for different
gases temperatures (fully humidified), for a cell
temperature of 298 K.
Figure 8: Experimental and modelling data for different
gases temperatures (fully humidified), for a cell
temperature of 333 K.
5 CONCLUSIONS
The effect of the relative humidity of the gases, and
of the temperature of the reactant gases and cell on
fuel cell performance was studied. It was concluded
that the fuel cell works better with both anode and
cathode humidified and that the temperature of the
gases and of the fuel cell should be the same. The
model developed in this work predicts very well the
experimental results. This kind of models could be
used with success for quick predictions of fuel cell
behaviour.
ACKNOWLEDGEMENTS
The partial support of “Fundação para a Ciência e
Tecnologia - Portugal” through project POCI/
EME/55497/2004 and scholarships SFRH/
BD/28166/2006 and SFRH/BD/23302/2005 is
gratefully acknowledged.
REFERENCES
Baschuk, J..J. and Li, X., 2000, Modeling of polymer
electrolyte membrane fuel cells with variable degrees
of water flooding, J. of Power Sources, Vol. 86, pp.
181-195.
Biyikoglu, A., 2005, Review of proton exchange fuel cell
models, International Journal of Hydrogen Energy,
Vol. 30, pp. 1185-1212.
Chiang, Y.M., Chang, L.C., Chang, F.J.,2004.
Comparison of static-feedforward and dynamic-
feedback neural networks for rainfall–runoff
modelling. Journal of Hydrology 290 (3-4), 297-311.
Gupta, R.R., Achenie, L.E.K., 2007. A network model for
gene regulation. Computers & Chemical Engineering
31 (8), 950-961.
Nagy, Z.K., 2007. Model based control of a yeast
fermentation bioreactor using optimally designed
artificial neural networks. Chemical Engineering
Journal 127 (1-3), 95-109.
Nguyen, M.H., Abbass, H.A., McKay, R.I., 2005.
Stopping criteria for ensemble of evolutionary
artificial neural networks. Applied Soft Computing 6
(1), 100-107.
Ogaji, S.O.T., Singh, R., Pilidis, P., Diacakis, M., 2006.
Modelling fuel cell performance using artificial
intelligence. Journal of Power Sources 154 (1), 192-
197.
Ou, S., Achenie, L.E.K., 2005. A hybrid neural network
model for PEM fuel cells. Journal of Power Sources
140 (2), 319-330.
Özesmi, S.L., Tan, C.O., Özesmi, U., 2006.
Methodological issues in building, training, and
testing artificial neural networks in ecological
applications. Ecological Modelling 195 (1-2), 83-93.
Saengrung, A., Abtahi, A., Zilouchian, A., 2007. Neural
network model for a commercial PEM fuel cell system.
Journal of Power Sources 172(2), 749-759.
Sousa, S.I.V., Martins, F.G., Alvim-Ferraz, M.C.M.,
Pereira, M.C., 2007. Multiple linear regression and
artificial neural networks based on principal
components to predict ozone concentrations.
Environmental Modelling & Software 22 (1), 97-103.
Uncini, A., 2003. Audio signal processing by neural
networks. Neurocomputing 55 (3-4), 593-625.
0.0
0.2
0.4
0.6
0.8
1.0
1.2
0.00 0.05 0.10 0.15 0.20 0.25 0.30 0.35 0.40 0.45 0.50
Vo lt age [V ]
Current Density [A/cm
2
]
Tgases=298 K Exp Tgases=313 K Exp Tgases=333 K Exp
Tgases=298 K Model Tgases=313 K Model Tgases=333 K Model
0.0
0.2
0.4
0.6
0.8
1.0
1.2
0.00 0.05 0.10 0.15 0.20 0.25 0.30 0.35 0.40 0.45 0.50
Vo lt age [V ]
Current Density [A/cm
2
]
Tgases=298 K Exp Tgases=313 K Exp Tgases=333 K Exp
Tgases=298 K Model Tgases=313 K Model Tgases=333 K Model
ARTIFICIAL NEURAL NETWORK MODEL APPLIED TO A PEM FUEL CELL
439
