
UNDERSTANDING THE BEHAVIOUR OF CDMA-BASED
CELLULAR NETWORKS WITH A USER-FRIENDLY
SIMULATION SOFTWARE
Xavier Lagrange and Boulbeba Karoui
Institut TELECOM, TELECOM Bretagne, Universite europeenne de Bretagne
2 rue de la Chataigneraie , 35576 Cesson Sevigne Cedex, France
Keywords:
Universal Mobile Telecommunications System (UMTS), Code Division Multiple Access (CDMA), Simulation
Software, Virtual Labs, e-learning in network engineering.
Abstract:
The Universal Mobile Telecommunications System (UMTS) has been developed in order to create a unified
telecommunications system with multimedia capabilities. UMTS uses the Code Division Multiple Access
(CDMA) technique. In this type of system, all users share the same frequency at the same time. Interference
then plays a major role in the behaviour of a CDMA network and causes the coverage to vary according to the
load. Furthermore many parameters have an impact on the coverage (spreading factor, user rate, transmission
power etc...). So motivating students to learn CDMA concepts is often difficult because they find it very
difficult to understand the physical phenomena. To overcome this problem, students need to practise several
laboratory exercises. Then they need a suitable simulation tool. In this paper a simple cellular model is
introduced and a CDMA software based on that model is described. Its effectiveness as a teaching method is
explained. This simulator can help students to understand the CDMA network behaviour more accurately.
1 INTRODUCTION
The exciting pace of wireless telecommunications
system evolution has marked the last few years. This
fast evolution is the result of the huge success of digi-
tal mobile systems and the increasing demands of mo-
bile users for Internet oriented applications. Second
generation systems mainly offered telephony services
and data transmission with moderate rates. Third gen-
eration networks have multimedia capabilities, such
as the support for high bit rates and the introduction
of packet data/IP access.
Main third generationsystems are UMTS (Univer-
sal Mobile Telecommunication System) standardized
within 3GPP (Third Generation Partnership Project)
(Lagrange, 2005) and CDMA2000, which is an evo-
lution of the north-American system IS-95 and which
is standardized by 3GPP2.
Both air interfaces use the CDMA (Code Division
Multiple Access). CDMA is suited for data trans-
fer with bursty behaviour. However, CDMA is much
more complex than classical Time Division Multiple
Access (TDMA). All users in a cell are transmitting
on the same frequency and thus create interference to
each other. Power control has, therefore, a major im-
pact on a network based on CDMA. Each transmit-
ter has to adapt its transmission power to the optimal
level that allows both a good quality of service and
a high capacity. That transmission power level in-
creases with the number of the users. Hence coverage
and capacity are two antagonist notions. The higher
the load is the lower the coverage is.
In this paper, a user-friendly simulation software
that may ease understanding of the behaviour of
CDMA-based cellular networks is presented. This pa-
per is divided into seven sections. Section 2 is a re-
minder of spread spectrum and cellular CDMA sys-
tems. Section 3 describes the simulation tool con-
text and objectives. Section 4 introduces the model
used in the simulator software and the main func-
tions. Section 5 gives the simulator features. Section
6 presents some laboratory exercises for students that
can be achieved through the simulator tool. Section
7 gives some feedbacks on the use of the tool. Fi-
nally, section 8 proposes some possible evolutions of
the simulator.
31
Lagrange X. and Karoui B. (2009).
UNDERSTANDING THE BEHAVIOUR OF CDMA-BASED CELLULAR NETWORKS WITH A USER-FRIENDLY SIMULATION SOFTWARE.
In Proceedings of the First International Conference on Computer Supported Education, pages 31-38
DOI: 10.5220/0001851000310038
Copyright
c
SciTePress

2 CELLULAR AND CDMA
FUNDAMENTALS
2.1 Spread Spectrum Interest
In a transmission system, the correct reception of a
transmitted information bit requires a certain rela-
tionship between the energy received per information
bit E
b
and the noise spectral density N
0
. The ratio
E
b
/N
0
must be higher than a threshold to guarantee
a maximum bit error rate (BER). That threshold can
be assumed in the first approximation step to be inde-
pendent of the transmission and modulation scheme.
Consequently that threshold is given by :
E
b
/N
0
≥ (E
b
/N
0
)
T
(1)
where the threshold (E
b
/N
0
)
T
is typically 6 dB for a
10
−3
BER (ratio 4 in a linear scale).
In direct-sequence spread spectrum systems, de-
vices transmit chips instead of bits at a higher rate
than necessary. For a user bit rate R, chips are trans-
mitted at a rate W : each bit is replaced by a sequence
of W/R chips. In order to keep good spectrum prop-
erties the sequence is pseudo-random and hence the
bandwidth of the transmitted signal is W for simple
modulation schemes as opposed to the bandwidth of
the user bit flow that is R. As a conclusion, the spec-
trum is spread and ratioW/R is then called the spread-
ing factor or the spreading gain.
In the transmitter, each data bit is multiplied with
the spreading sequence and then sent on the air. In
the receiver, the spread signal is also multiplied by the
same sequence and integrated over the bit period (this
is the simplest receiver, for an exhaustive presenta-
tion see (Proakis, 2001)). This operation is called de-
spreading. The original user flow is then recovered.
The signal is generally interfered by thermal noise
and interferences. However, de-spreading is neutral
for all noise and interferences thanks to the random
properties of the spreading sequence. Let C be the
received signal power at the receiver. Let I
tot
be the
power of all the interferences. The following formula
is admitted:
E
b
N
0
=
W
R
C
I
tot
(2)
Let β = (E
b
/N
0
)
T
R
W
. Constraint 1 may be combined
with equation 2 and be re-written as follows:
C
I
tot
> β (3)
Equation 3 shows that β is the minimum required
C/I. In UMTS (Holma and Toskala, 2004), W = 3.84
Mchip/s and R depends on the user service but is typi-
cally 15000 bps for voice services. HenceW/R = 256
(spreading gain 24 dB). In all casesW/R is larger than
1 and consequently
C
I
tot
may be lower than 1. As a
conclusion, spread spectrum systems tolerate a level
of noise and interference much higher than the signal.
For instance with (E
b
/N
0
)
T
= 6 dB and a spreading
gain of 24 dB then β = −18 dB. For the system to
work well C/I
tot
must be just higher than −18 dB.
2.2 CDMA Principle
Code division multiple access (CDMA) is a form of
multiplexing that does not divide up the channel by
time (as in TDMA:Time Division Multiple Access) or
frequency (as in FDMA:Frequency Division Multiple
Access) but by codes. CDMA uses direct-sequence
spread spectrum but the sequences are based on Walsh
codes constructed with Hadamar matrices (Viterbi,
1995). The spreading sequences of the different users
are orthogonal. However, the orthogonality is only
guaranteed if synchronization is possible between the
different spreading sequences. Such synchronization
is simple when there is a common transmitter : it
can then be used on the downlink of cellular sys-
tems as the same base station is transmitting to all
mobiles of the cell. However, it is not possible on
the uplink as mobiles cannot be synchronized to each
other at the chip level because of variable propaga-
tion delays. Different users then use different pseudo-
random spreading codes on the uplink (Viterbi, 1995).
To illustrate the access of the CDMA type, we can
make an analogy with a gathering of people from dif-
ferent nationalities where everyone is speaking at the
same time but is using different languages. A new-
comer who for example understands only French lan-
guage would be able to extract only the French sen-
tences stated of the ambient hubbub. Conversations
of the others seem to him like a noise deprived of
mean. However, if the general level of noise coming
from the other conversations is too important, it will
be more difficult or even impossible for our visitor to
understand the speech of his compatriot.
2.3 Interference Analysis in a Regular
Network
In a cellular network mobiles do not receive a perfect
signal from their serving base station. The signal is af-
fected by noise and interference. The noise is mainly
due to thermic agitation of electrons (thermal noise)
and to imperfections of the first amplifier stage. It is
denoted by N
th
.
CSEDU 2009 - International Conference on Computer Supported Education
32
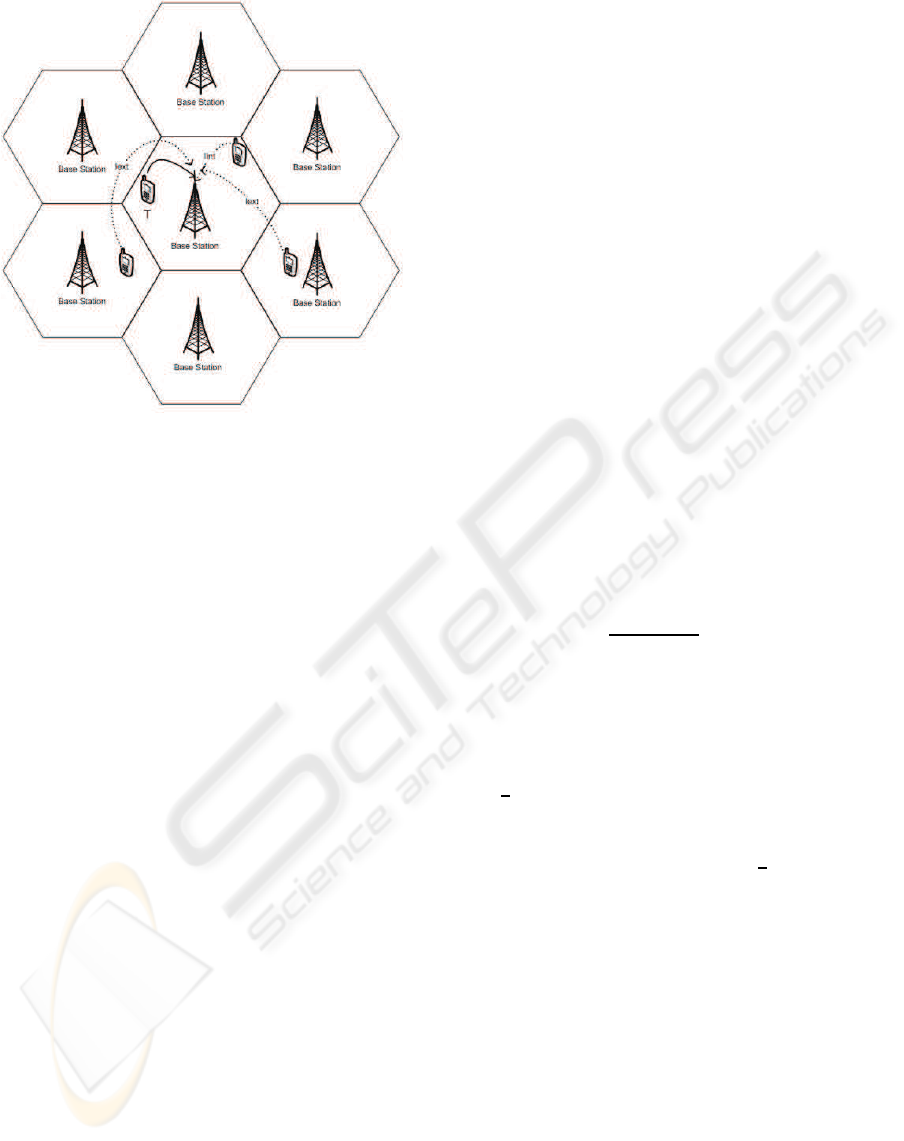
Figure 1: Interferences in the UpLink come from mobiles
in the other cells and in the same cell.
Interference is mainly due to the reuse of frequen-
cies in several cells and is called co-channel interfer-
ence. Other types of interference are negligible com-
pared to the co-channel interference. In CDMA net-
works the same frequency is used for all terminals in
all cells. The level of interference is then high com-
pared to TDMA or FDMA networks.
Due to the limitation of the text length, we develop
the impact of the interference on the uplink (terminal
to network). The same phenomenons are observed
on the downlink though there is some differences due
to the possibility to have orthogonal codes between
transmissions to different users of the same cell (La-
grange, 2000).
A user terminal T is transmitting on frequency f
0
to its serving base station B in one cell. All termi-
nals in the same cell are transmitting on f
0
to B and
generate internal interference. Furthermore f
0
is also
used by all terminals connected to other base stations.
Such transmissions generate external interference (for
T). Let I
int
be the internal interference and I
ext
be the
external interference (see fig 1). TheC/I ratio may be
written as :
C/I
tot
= C/(I
int
+ I
ext
+ N
th
) (4)
2.4 Power Control
In a CDMA system power control is a very important
issue because all the users of the network use the same
frequency band at the same time.
The general objective of power control is to ensure
the same E
b
/N
0
ratio for all users. In order to mini-
mize the power consumption the E
b
/N
0
target must
be the lowest acceptable value. That is :
E
b
/N
0
= (E
b
/N
0
)
T
(5)
In order to reach the (E
b
/N
0
)
T
, each mobile must
adapt its transmission power. As N
0
is the same for
all mobiles in the same cell, reaching an E
b
/N
0
target
is equivalent to reaching a common signal target de-
noted as C
tg
. The more mobile there are, the higher
N
0
is and hence the higher C
tg
is.
The maximum capacity is obtained when all mo-
biles are received at the same power level at the base
station. However, that level is not the same in all base
stations. Determining the level target for each cell is
a complex task in an operational network. Iterative
algorithms that try to approach the optimal solutions
are used. In a simple regular network it is possible to
analytically determine that target (see (Zander, 1992)
for more details). Such an approach is used in this
contribution but is not detailed for the sake of sim-
plicity.
2.5 Notion of Pole Capacity
If only one cell is considered and if the thermal noise
is negligible then with a perfect power control the
C/I
tot
is given by:
C/I
tot
=
C
tg
(M − 1)C
tg
= 1/(M − 1) (6)
where M is the number of mobiles in the considered
cell. Equation 6 and constraint 3 demonstrate that the
maximum number of mobiles able to transmit in one
cell is limited. Even if mobiles were able to transmit
at very high power it is never possible to have more
than
1
β
+1 active mobiles in one cell. The pole capac-
ity is then defined as the maximum number of mobiles
per cell in a network with infinite power mobiles. An
upper bound of the pole capacity is
1
β
+ 1 but deter-
mining it is not simple when external interference is
taken into account.
2.6 Variation of the Coverage
According to the Load
The coverage in a CDMA system is directly related
to the load of the network. The load is defined as the
number of active users.
The more the number of mobiles in the cell in-
creases, the more they must increase their emission
power. However, each mobile is characterized by a
maximum transmission power. Consequently, mo-
biles that are located at the edges of the cell are no
longer able to reach the base station (the required
power would be above the maximum value). This
UNDERSTANDING THE BEHAVIOUR OF CDMA-BASED CELLULAR NETWORKS WITH A USER-FRIENDLY
SIMULATION SOFTWARE
33

phenomenon is known as cell breathing : coverage
decreases as the load increases.
The exact coverage depends on several parameters
like the data rate allocated to each user, the level of
noise but especially the load on the cell. In a simple
regular network with perfect power control, the cov-
erage can be calculated on the uplink and downlink.
3 SIMULATION TOOL
OBJECTIVES
At TELECOM Bretagne (Ecole Nationale Superieure
des Telecommunications de Bretagne) cellular net-
work fundamentals are given in first year of gradu-
ation studies (MSc level). The second year is rather
dedicated to more advanced systems like 3G and 4G
wireless networks. In this context, spread spectrum
concept and CDMA is taught. As it was introduced in
part 2 there is a lot of interaction in cellular networks
due to the impact of the interference. Understanding
how a network ”lives” is not simple. Sometimes stu-
dents are confused by the technical details and do not
understand the basic physical phenomena. It is then
necessary to have labs where the student can practice.
As network UMTS devices are very expensive, simu-
lation is the only way for laboratories.
3.1 Simulation Tool Overview
Indeed, major simulation tools like OPNET (OPNET,
2008) or COMNET (COMNET, 2008) are more pro-
tocol oriented and require a lot of time to be used cor-
rectly. Furthermore the multi-cell aspect is generally
not included. Other planning tools such as ATOLL
(FORSK, ) or PLANET (MARCONI, 2008) are more
adapted to predict the coverage in a given environ-
ment. They use sophisticated digital elevation models
to predict coverage and evaluate the quality of service
delivered in a zone. The behaviour of a network for
different loads is precisely modelled and may be dis-
played. However, a huge number of parameters have
to be manipulated. When some variations in the cov-
erage are apparent, it is very difficult to identify the
reason for them. For example, the coverage level may
be deeply impacted by some specificities of the prop-
agation models rather than the basic physical CDMA
characteristics.
There is then a need for a user-friendly simula-
tion software of a CDMA network that reflects the
behaviour of a CDMA wireless network.
3.2 VICTOR Objectives
The objective at TELECOM Bretagne was to have a
tool that every student could launch and use within
5 minutes. Simplicity was the first objective. The
simulation is thus not event-oriented but is closer to
a Monte-Carlo approach. The developed software is
based on a model which will be described in the fol-
lowing and the simulator is called VICTOR (Visuali-
sation Interactive du ConTrOle de puissance dans un
Reseau regulier) : Interactive Visualization of power
control in a regular network.
4 MODEL PRESENTATION
4.1 The Network Model
A regular hexagonal network with omnidirectional
base stations is considered in VICTOR. The number
of cells is set to 7 : one central cell is surrounded by
six neighboring cells. Terminals are randomly spread
over the 7 hexagonal cells. They are assumed to be
fixed. However, they are called mobiles, as it is usu-
ally done in cellular networks.
The radius of the cells may be changed by the user
but the default value is 1 km. A regular propagation is
considered also in VICTOR. The effect of obstacles
is not simulated in details. Irregularities in the prop-
agation are modelled by a random variable. Such an
approach is very classical in much research work (see
(Gilhousen et al., 1991) for instance). The user has
access to a large number of parameters (propagation
law, spread spectrum factor, noise figure,... ). How-
ever, predefined values that correspond to a typical
coherent system are set by default.
4.2 Main Functions of the Software
VICTOR propose two possibilities to fix its configu-
ration parameters: i) at the beginning of the simula-
tion, ii) at any time in the simulation. Once the pa-
rameters are fixed, the user can very easily change the
number of mobiles in the network through the slider.
For a given number of mobiles, VICTOR calculates
the target level of the reception power in the down-
link and in the uplink. It derives the required power
level for each mobile on the uplink and for each base
station on the downlink.
In some cases, it is not possible to serve all mo-
biles. Mobiles that cannot be served are called inac-
tive mobiles : on the uplink the transmission power
of inactive mobiles is set to 0. On the downlink, no
CSEDU 2009 - International Conference on Computer Supported Education
34
Choose
uplinkor
downlink
Changethe
numberofmobiles
Parametersofthe
clickedbase
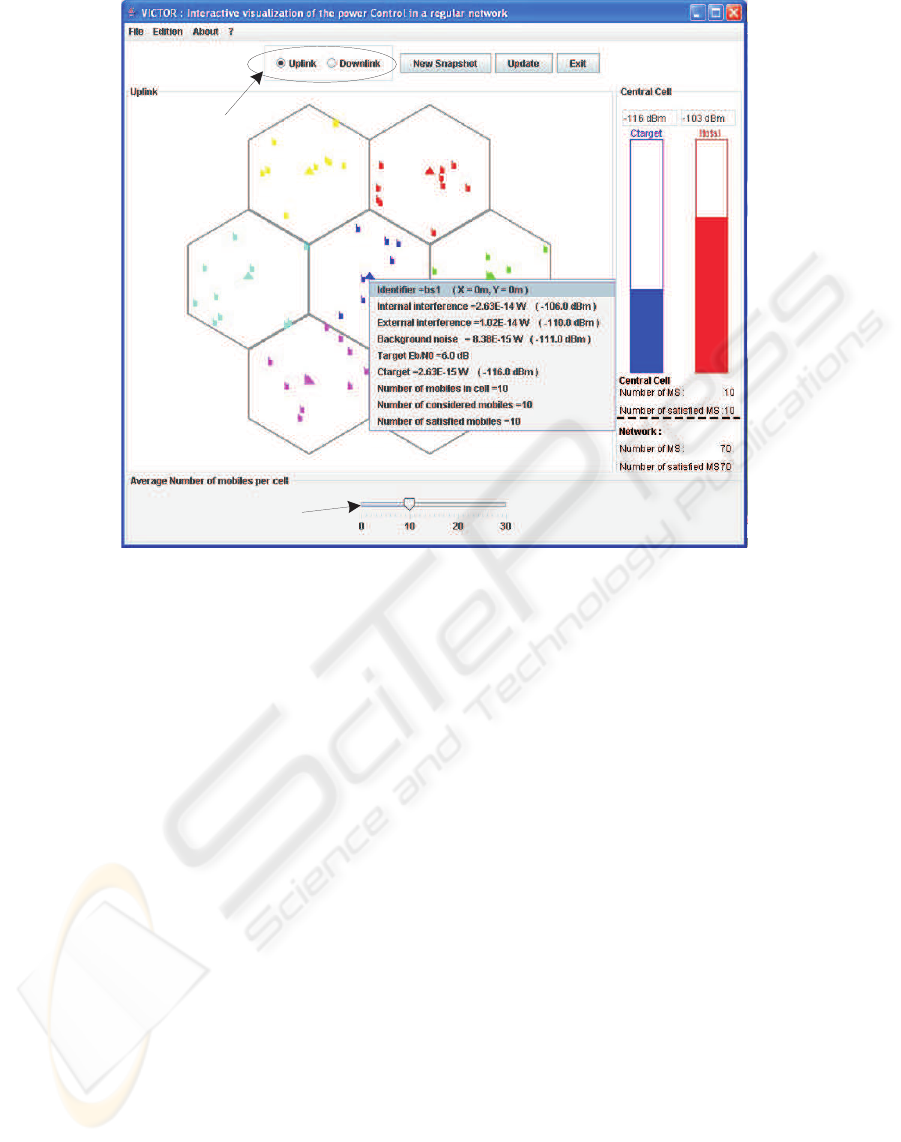
Figure 2: All mobiles are covered in the network: 10 mobiles in the central cell and 70 mobiles in the whole network.
power is dedicated to inactive mobiles. The commu-
nication of such mobiles would be cut or not estab-
lished in an operational network.
Once the transmission powers of the mobiles and
the base stations are defined, VICTOR computes the
internal and external interferences for each mobile
and for each base station, the path loss and many other
fields. All the computation is done both on the uplink
and the downlink. The user chooses either the down-
link display or the uplink display. He or she can very
easily switch from one view to another one thanks to
a radio button .
5 OVERVIEW OF THE
SIMULATOR
VICTOR is programmed in Java language and
can run on any operating system. There is
also an applet version of VICTOR which can be
used from any browser (http://formations.telecom-
bretagne.eu/ressources/rsm). The software is approx-
imately 10 000 lines.
The main principle window of VICTOR is divided
in 4 parts (see fig. 2). The network is represented by
the cells, the different base stations and mobiles. In
the right of the window, some gauge indicators are
disposed : i) in the uplink case, the two gauges rep-
resent the target power and the total interference (in-
ternal, external and thermal noise) of the base station
of the central cell; ii) in the downlink case, the two
gauges indicate the target power and the total interfer-
ence for a test mobile. In addition to the two gauges,
there are two indicators of the number of mobiles and
the number of satisfied mobiles (well served mobiles)
on both the central cell and the network.
VICTOR offers the possibility to select the visu-
alization of the network either on the uplink or on the
downlink by a radio operator button. The position of
the mobiles in the different cells can be changed by
carrying out a new random choice (while pressing on
the new Snapshot button). Finally, the user may see
the information such as the received power, the inter-
nal interference,... by clicking on a mobile or a base
station.
Let us consider the case of 10 mobiles in each cell
of the network (see fig. 2). In the central cell, the
interference level is weak (-103 dBm) and the target
power level (-116 dBm) is low enough to serve all the
mobiles. Consequently, all the mobiles are covered
in the central cell (10 mobiles) and in the whole net-
work (70 mobiles). Fig. 2 shows all the information
of the base station on the uplink such as the internal
interference, the external interference and so on.
Let us now consider 30 mobiles in each cell (see
UNDERSTANDING THE BEHAVIOUR OF CDMA-BASED CELLULAR NETWORKS WITH A USER-FRIENDLY
SIMULATION SOFTWARE
35
fig. 3). Mobiles that do not have enough power to
reach the base station are barred with a cross. As it
is depicted in the latter figure, the number of covered
mobiles (110 mobiles) is lower than the number of
mobiles in the network (210 mobiles). For example,
if the user looks at the central cell there are only 16
active mobiles among the 30 mobiles because of the
high interference level (-87 dBm). Consequently, the
user deduces that the cell has attained its pole capacity
(16 mobiles). Fig. 3. shows all the information of the
mobile station on the uplink such as the transmission
power, the path loss... All these examples are given
for uplink. However, VICTOR can also be used to
visualize the pole capacity notion on the downlink.
Figure 3: Pole capacity on the uplink: 16 mobiles in the
central cell and 110 in the network.
6 LABORATORY EXERCISES
In lectures, the basic concept of a CDMA network and
related issues and challenges are introduced. These
concepts are reinforced when the students set up the
laboratory exercises. In the following we present sev-
eral labs.
Laboratory 1: The Cell Breathing Phenomenon
on Uplink. In this introductory lab, students are first
asked to analytically determine the maximum radius
of a cell on the uplink without any load. By consid-
ering only thermal noise, they calculate the minimum
level received power C
min
by combining equations 3
and 4. Using propagation equations withC
min
and the
mobile transmission power they then find the range of
mobile terminals. The obtained value is much higher
than the radius of a hexagonal cell. This shows the
coverage for a non loaded network is very good.
Students then use VICTOR and look at the num-
ber of mobiles that can reach the base station for dif-
ferent loads. They realize the total interference level
increases with the number of mobiles in the network.
They are asked to determine the maximum number of
mobiles served. They are then asked to increase the
transmission power of mobiles by typically 3 dB to
check that the capacity increases slightly. They repeat
the same process (power increase). Above a certain
power they note the capacity does not increase any-
more : the pole capacity has been reached. They note
this maximum is the same for different snapshots. In
completing this practical, students develop a sound
knowledge of the impact of interference in a CDMA
system and an understanding of the pole capacity.
Laboratory 2: The CellBreathing Phenomenon on
Downlink. As in lab 1, students are asked initially to
calculate the pole capacity on the downlink case and
to check it with VICTOR. They notice that beyond a
certain power of the base station the number of cov-
ered mobiles does not exceed the already theoretically
calculated value. The pole capacity has been reached.
In completing this practical, students develop a better
understanding about the pole capacity on the down-
link case.
Laboratory 3: Impact of the User Rate. CDMA is
interesting in multimedia cellular networks because it
provides flexibility. A network is able to accommo-
date different user rates R. As the bandwidth W re-
mains the same, increasing the user rate decreases the
spreading factor. Hence, higher rates require higher
power. In this lab, students are asked to increase the
user rate and to determine the impact on the capacity
both on the uplink and the downlink. Let us note that
VICTOR is not able to mix different user rates in the
same simulation like a UMTS network. However, it
is possible to change that parameter and to see the im-
pact of a new value with exactly the same position of
mobiles. Students can then really understand the im-
pact of high rates and the corresponding cost in term
of power budget.
Laboratory 4: TDMA vs CDMA. Due to multipath,
the different transmissions of a base station are not
perfectly orthogonal. This is generally modeled by
integrating in the interference calculation a non or-
thogonality factor α. This factor may vary from one
mobile to another and depends on its position in the
network. However, for the sake of simplicity the same
value is considered for all mobiles in VICTOR.
Students fix the number of mobiles per cell to the
pole capacity of the uplink and they notice that all
mobiles are covered on the downlink for α = 0.5. In-
CSEDU 2009 - International Conference on Computer Supported Education
36
deed, the internal interference value on the downlink
is much lower than on the uplink thanks to orthogonal
codes on the downlink. Students are shown that for
α equals to 0, the internal interference is eliminated.
Consequently, the maximum capacity increases be-
cause mobiles receive less internal interference and
need less power. For α = 1, the capacity is lower due
to the rising internal interference in the cell. In this
case, the base station must redistribute equitably its
power between the mobiles.
In the following, a complementary lab describ-
ing the behaviour of a CDMA system compared to a
TDMA system is presented. Let us consider the case
of a strong non-orthogonality on the downlink. Two
strategies are proposed: i) the base station transmits
simultaneously two user flows on two different codes;
ii) the base station transmits one flow, then the other,
by reducing the spreading factor and by increasing the
instantaneous rate (case of the TDMA). Students are
asked then to consider the two strategies. Students
show that in the first strategy there is internal inter-
ference but in the second strategy internal interfer-
ence is eliminated. Consequently, the network perfor-
mance becomes much better. Students may then con-
clude that TDMA is better on the downlink of a given
base station when there are no strict delay constraints.
In completing this practical, students gain experience
in modelling orthogonality on the downlink and re-
ceived a good introduction to the basis of 3.5 systems
like HSDPA (High Speed Data Packet Access) that
rely on a time shared downlink channel.
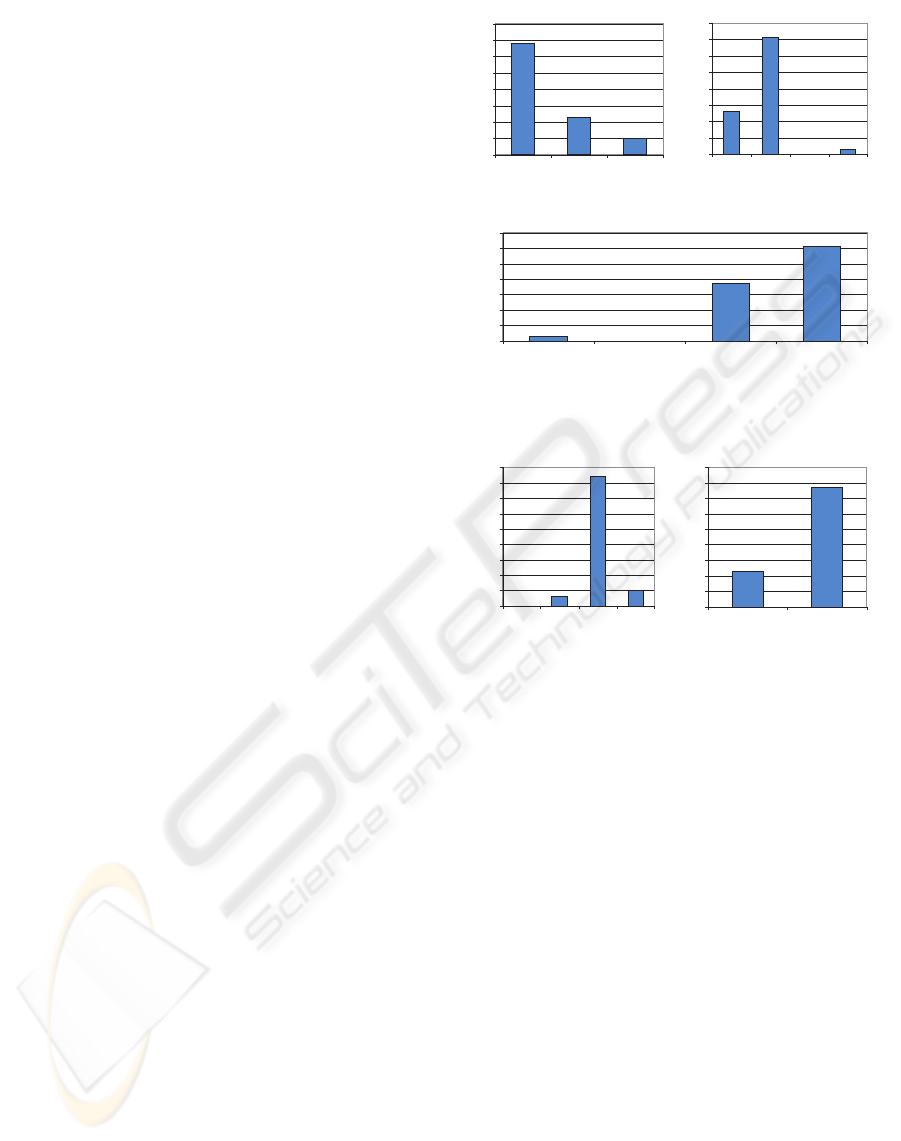
7 ASSESSMENT
7.1 Evaluation by Students
VICTOR was used during autumn semester in 2006-
2007 and 2007-2008. In 2006-2007, there were 32
students who were registered for the course unit. As
it was a trial, they did only labs 1 and 2 after the the-
oretical courses.
VICTOR software was evaluated anonymously by
students. The aim of the evaluation is to check VIC-
TOR is really easy to use and to analyze the percep-
tion of students on VICTOR’s benefits. Students were
asked 5 questions as shown in figure 4. One addi-
tional open question asks them to give their opinion
on VICTOR. More than 95% find the software is easy
or very easy to use. They do not spend much time
to become familiar with VICTOR as more than 65%
needed less than 5 minutes to that. Some students who
have an above average ability to follow theoretical
courses found VICTOR unnecessary since the con-
Howlongtobecomefamiliarwith
Victor
0
10
20
30
40
50
60
70
80
lessthen5
minutes
between5
and10
minutes
morethan
10minutes
% of responses
EaseofuseofVictor
0
10
20
30
40
50
60
70
80
very
easyto
use
easyto
use
difficult
touse
very
difficult
touse
% of responses
0
10
20
30
40
50
60
70
Victoris
unncessary
becausethe
conceptsstudied
areverysimple
Victoris
unncessary
becausethe
conceptsstudied
aretoocomplicated
Victorisagood
tooltounderstand
thebehaviorofa
CDMA network
Victorisagood
toolbutitis
necessarytowork
onthelessons
before
% of responses
IthinkIhaveabetterunderstanding
ofCDMA networksthankstoVictor
0
10
20
30
40
50
60
70
80
90
No Yes
% of responses
BenefitsofVictor(score0to3)
0
10
20
30
40
50
60
70
80
90
0 1 2 3
% of responses
Figure 4: Subjective evaluation of VICTOR by students.
cepts covered were simple. However, more than 95%
found it useful. Note that 61% consider VICTOR is
useful but does not exempt them from working on the
theoretical lessons. Students were asked to write one
sentence for their evaluation of VICTOR. Here are a
few answers:
• VICTOR is a good way to have practical applica-
tions of the theoretical courses,
• VICTOR facilitates understanding of the course,
• VICTOR is a simple software that really helps to
fix the basic concepts of CDMA networks,
• I won’t say that I learnt new things. However, I
have understood why some elements of the course
are useful and thanks to VICTOR I asked myself
good questions. It is then a very useful help to
understand the course.
7.2 Objective Evaluation with a Quiz
Before the labs, students were asked to make a techni-
cal multiple-choice test comprising 12 questions. The
same test was used after the labs to analyze the bene-
fits of the labs.
UNDERSTANDING THE BEHAVIOUR OF CDMA-BASED CELLULAR NETWORKS WITH A USER-FRIENDLY
SIMULATION SOFTWARE
37
0
1
2
3
4
5
6
7
8
9
10
Score before the labs Sore after the labs
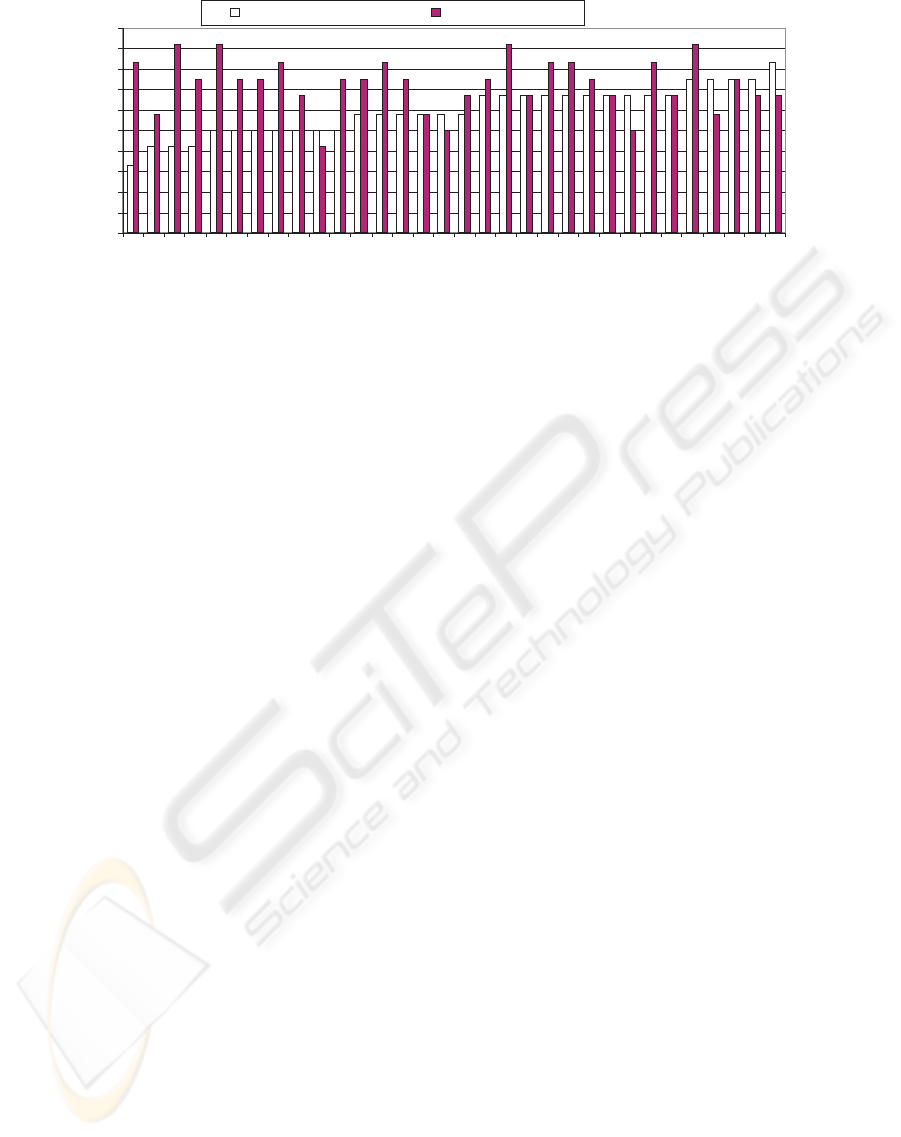
Figure 5: Scores of all students before and after the labs (sorted in ascending order for the first test.)
The individual score of each student is given in
figure 5. Most students (78%) got a better or an equal
score after the labs. The average score was 6/10 be-
fore the labs and 7.3 after the labs. Strangely, 6 stu-
dents got a lower score after the labs. This is due to
two different factors : firstly, some students answered
randomly to some questions. Secondly, the questions
were short. Hence, a few questions were partly am-
biguous. Several students thought they include traps.
Instead of giving the simple direct answer, they mis-
interpreted the question and gave a wrong answer
though they had well understood the concept. One
can notice that the students who had a low score at
the first test improved their score greatly in the sec-
ond test. This should suggest that these students have
the ability to understand the concepts but have diffi-
culties in classical lessons. For such students lab work
is very important.
8 CONCLUSIONS
VICTOR can be used either for class demonstra-
tions, in enhancement of the traditional lecture envi-
ronment, or in the computer laboratory for hands-on
practical work in a UMTS networking course. It is
easy to use and provides a suitable interface that helps
users to gain better understanding of UMTS network.
The possibility of VICTOR enhancement are nu-
merous. However,the challenge is to keep a very sim-
ple man-machine interface to have software which is
very easy to use. Students may focus their attention
on the radio and network aspects and not on how to
use the software.
ACKNOWLEDGEMENTS
The authors want to thank students of TELECOM
Bretagne who also contributed to the development
of VICTOR software : Raymond Coulibaly, Souley-
mane Faye, Youness Oulbacha, Jihad Sarsi.
REFERENCES
COMNET (2008). Comnet description. Technical report,
http://www.comnet.at/website/output.php.
FORSK. Atoll description. Technical re-
port, http://www.forsk.com/htm/products/atoll
overview.htm.
Gilhousen, K., Jacobs, I., Padovani, R., Viterbi, A., Weaver,
L., and Wheatley, C. (1991). On the capacity of a cel-
lular cdma system. IEEE Transactions on Vehicular
Technology, 40(2):303–311.
Holma, H. and Toskala, A. (2004). WCDMA for UMTS,
third Edition. Wiley and sons Ltd.
Lagrange, X., editor (2000). Les reseaux Radiomobiles.
Edition Hermes Science.
Lagrange, X., editor (2005). Principes et Evolutions de
l’UMTS. Edition Hermes Science.
MARCONI (2008). Planet description. Technical report,
http://www.marconi.com.
OPNET (2008). Opnet description. Technical re-
port, http://www.opnet.com/products/modeler/home-
1.html.
Proakis, J. (2001). Digital Communications. Mc Graw Hill.
Viterbi, A. (1995). CDMA, Principles of Spread Spectrum
Communication. Addison-Wesley.
Zander, J. (1992). Performance of optimum transmitter
power control in cellular radio systems. IEEE Trans-
actions on Vehicular Technology, 41:57–62.
CSEDU 2009 - International Conference on Computer Supported Education
38
