
DATA REDUCTION OR DATA FUSION IN BISOGINAL
PROCESSING?
Martin Golz
1
, David Sommer
1
and Udo Trutschel
2,3
1
University of Applied Sciences Schmalkalden, Faculty of Computer Science, Schmalkalden, Germany
2
Department Circadian Technologies Inc., Stoneham, Massachusetts, U.S.A.
3
Institute for System Analysis and Applied Numerics, Tabarz, Germany
Keywords: EEG, EOG, Eyetracking, Driving Simulator, Microsleep, Vigilance Monitoring, Computational
Intelligence, Support Vector Machines, Feature Fusion, Feature Reduction, Validation.
Abstract: When subjects are monitored over long time spans and when several biosignals are derived a large amount
of data has to be processed. In consequence, the number of features which has to be extracted is mostly very
restricted in order to avoid the so-called “curse of high dimensionality”. Donoho (Donoho, 2000) stated that
this applies only if algorithms perform local in order to search systematically for general discriminant
functions in a high-dimensional space. If they take into account a concept for regularization between
locality and globality “blessings of high dimensionality” are to be expected. The aim of the present study is
to examine this on a particular real world data set. Different biosignals were recorded during simulated
overnight driving in order to detect driver’s microsleep events (MSE). It is investigated if data fusion of
different signals reduces detection errors or if data reduction is beneficial. This
was
realized
for nine
electroencephalography, two electrooculography, and for six eyetracking signals. Features were extracted of
all signals and were processed during a training process by computational intelligence methods in order to
find a discriminant function which separates MSE and Non-MSE. The true detection error of MSE was
estimated based on cross-validation. Results indicate that fusion of all signals and all features is most
beneficial. Feature reduction was of limited success and was slightly beneficial if Power Spectral Densities
were averaged in many narrow spectral bands. In conclusion, the processing of several biosignals and the
fusion of many features by computational intelligence methods has the potential to establish a reference
standard (gold standard) for the detection of extreme fatigue and of dangerous microsleep events which is
needed for upcoming Fatigue Monitoring Technologies.
1 INTRODUCTION
The fusion of many features is often under criticism,
because it is assumed that processing of a large
number of features leads to performance
deteriorations of classifiers. This is because local
optimizations of discriminant functions suffer from
the so-called “curse of high dimensionality”. It has
been shown theoretically that non-local learning
algorithms, like the Support Vector Machine (SVM),
suffer less from this problem and that there are also
“blessings of high dimensionality” (Donoho, 2000),
i.e. certain random fluctuations are very well
controlled in high dimensions, whereas in moderate
dimensions these fluctuations lead to deteriorations
in statistical measures. Therefore, the question of
fusion or reduction of features remains open and
answers depend on signal characteristics
(nonlinearities, randomness) and should be given
problem specific.
Here we present experimental investigations uti-
lizing 15 different signals of electroencephalography
(EEG), electrooculography (EOG), and eyetracking
signals (ETS). All signals are featured by relatively
high temporal resolution and are corrupted by large
noise originated by a lot of other simultaneously
ongoing brain processes. This leads to more or less
extensive signal processing which results in a large
variety of different features. Then, it is often discus-
sed if a fusion of all features or, in controversy, fea-
ture reduction should be strived in order to optimize
performance of subsequent processing methods. On
the one hand, fusion of features of different types of
signals should be beneficial, because EEG, EOG and
ETS are reflecting different processes. On the other
hand, ETS and EOG are relatively close related.
440
Golz M., Sommer D. and Trustschel U. (2009).
DATA REDUCTION OR DATA FUSION IN BISOGINAL PROCESSING?.
In Proceedings of the International Conference on Bio-inspired Systems and Signal Processing, pages 440-445
DOI: 10.5220/0001782604400445
Copyright
c
SciTePress

Both contain components of eye movement, but they
are differing in that ETS outputs the time series of
pupil size and that the EOG contains components of
blink movements. Therefore, it should be of interest
if a fusion of both closely related types of signals is
still of advantage or not.
2 VIGILANCE MONITORING
Over the past years the development of vigilance
monitoring systems has made considerable progress.
In case of applications to transportation industries
several stages of interactions between the system
and the driver are under discussion and are to some
extend implemented. On a low level of interaction
the estimated vigilance level is displayed to the
driver in order to give him a feedback and to support
his own decision making. Advantageously, the accu-
racy in such “alertometer” applications must be at
least as high as to display the vigilance level in two,
or three, or some more steps. This is not the case on
higher levels of interaction where e.g. acoustic or
visual stimuli are presented in order to give insistent
warnings to the driver. Highly accurate estimations
are required here. If the rate of false alarms would be
too high, such systems are scarcely accepted by
drivers. On the other hand, missing errors are very
dangerous for the driver and are therefore not accep-
table especially during very low vigilance and in its
extreme extent, the microsleep events (MSE). The
latter are defined as short and non-anticipated intru-
sions of sleep into wakefulness under demands of
sustained attention (www.microsleep.de).
The question remains whether there exists a
unique sign of extreme fatigue and of MSE which
can be measured non-intricately. In a recent paper
Schleicher et al. (Schleicher et al., 2007)
investigated oculomotoric parameters in a data set of
82 subjects. The parameter most correlating to
independent vigilance ratings was the duration of
eye blinks. In addition to correlation analysis this
parameter was investigated in detail immediately
before and after a MSE which they defined as
overlong eye blinks. The mean duration of overlong
eye blinks is substantially longer (269 ms) than of
blinks immediately before (204 ms) and after (189
ms) a MSE. Furthermore, considerable inter-
individual differences were reported and the
duration of overlong eye blinks seems to be much
lower than the reported 700 ms of Summala et al
(Summala et al., 1999). Ingre et al (Ingre et al.,
2006) also reported large inter-individual variability
of blink duration in a driving simulation study of 10
subjects after working on a night shift. In
conclusion, only gradual changes and a large inter-
subject variability are observable in this important
parameter which is mostly used in industrial fatigue
monitoring devices. The same is reported of other
variables, e.g. delay of lid reopening, blink interval,
and standardised lid closure speed (Schleicher et al.,
2007).
EEG studies on strong fatigue of several authors
have resulted in a similar picture of inter-individual
differences, of non-unique parameter values and of
non-specific patterns. In their review paper Santama-
ria and Chiappa (Santamaria and Chiappa, 1987)
stated: “There is a great deal of variability in the
EEG of drowsiness among different subjects”. In a
large normative study with 200 male subjects the
EEG of drowsiness was found to have “infinitely
more complex and variable patterns than the wakeful
EEG pattern” (Maulsby et al., 1968). Åkerstedt et al.
(Akerstedt et al., 1991) showed that with increasing
working time subjectively rated sleepiness strongly
increases and the EEG showed a significant but
moderate increase of hourly mean power spectral
densities (PSD) only in the alpha but not in the theta
band. In contrast, Makeig & Jung (Makeig and Jung,
1995) concluded from their study that the EEG
typically loses its prominent alpha and beta frequen-
cies as lower frequency theta activity appears at the
time when performance is deteriorating due to strong
fatigue. Sleep deprived subjects performing a conti-
nuous visuomotor compensatory tracking task
(Makeig et al., 2000) showed increasing PSD in the
lower theta range (3-4 Hz) during periods of poor
performance. But, other studies stated a broad-band
increase of PSD in the theta-alpha-range and Lal &
Craig (Lal and Craig, 2002) found significant
increases of PSD in the delta-theta-alpha-beta-range
by factors of 22%, 26%, 9%, 5%, respectively.
Another variable which has the potential to have
a relatively close relationship to the sleep/wake sys-
tem is the pupil size. Experiments to get normative
values of the pupil unrest index including 349 sub-
jects at the age between 20 and 60 years resulted in
significant variations depending on sleepiness
(Wilhelm, et al., 2001). Pupillograms can be
measured contactless by camera based eyetracking
systems (ETS). This measure is additionally
dependent on several other influences, like e.g.
ambient illumination. Therefore, it is like EEG and
EOG problematic as a basic indicator for vigilance
monitoring devices on real roads. Varying ambient
illuminations do not appear in laboratories.
Despite the above mentioned difficulties in sear-
ching for unique signs of extreme fatigue, the analy-
sis of brain electric and of oculomotoric signals are
DATA REDUCTION OR DATA FUSION IN BISOGINAL PROCESSING?
441
accepted as most favourable for detections of sudden
performance deteriorations on a second-by-second
basis. It is unlikely that biosignals, like e.g. electro-
cardiogram, electromyogram, electro-dermal activi-
ty, or indirect measures of driver fatigue like driving
parameters, e.g. variability of lane deviation and of
steering angle, contain such information which im-
mediately reflect ongoing MSE.
3 EXPERIMENTS
During the week preceding the study subjects had to
keep a sleep diary to assess sleep habits. In addition,
subjects had to carry a wrist actometer during the
three days and nights preceding the experiments.
Actograms were checked immediately after arrival
of the subject to the experimental night, normally at
11 pm. If total sleep length (6 … 10 hrs), time-since-
sleep (14 … 16 hrs) and if the subject accomplished
the demand of no nap, then a permit for experiments
was given. Three days before the experimental night
subjects were familiarized with the lab equipment
and had to drive on a 20 min training course in the
driving simulator. Two subjects complained about
simulator sickness and were excluded from further
investigations. During the experimental nights one
further subject has quitted because of simulator sick-
ness and one because of back pain. In total twenty-
two healthy subjects (21 male, 1 female; mean age
24.4 ± 3.1 years, range 19-28 years) finished experi-
ments completely. All subjects gave written infor-
med consent and gave a written declaration on their
transfer home after experiments. Only driving as
passenger or, in case of campus residents, walking
was allowed.
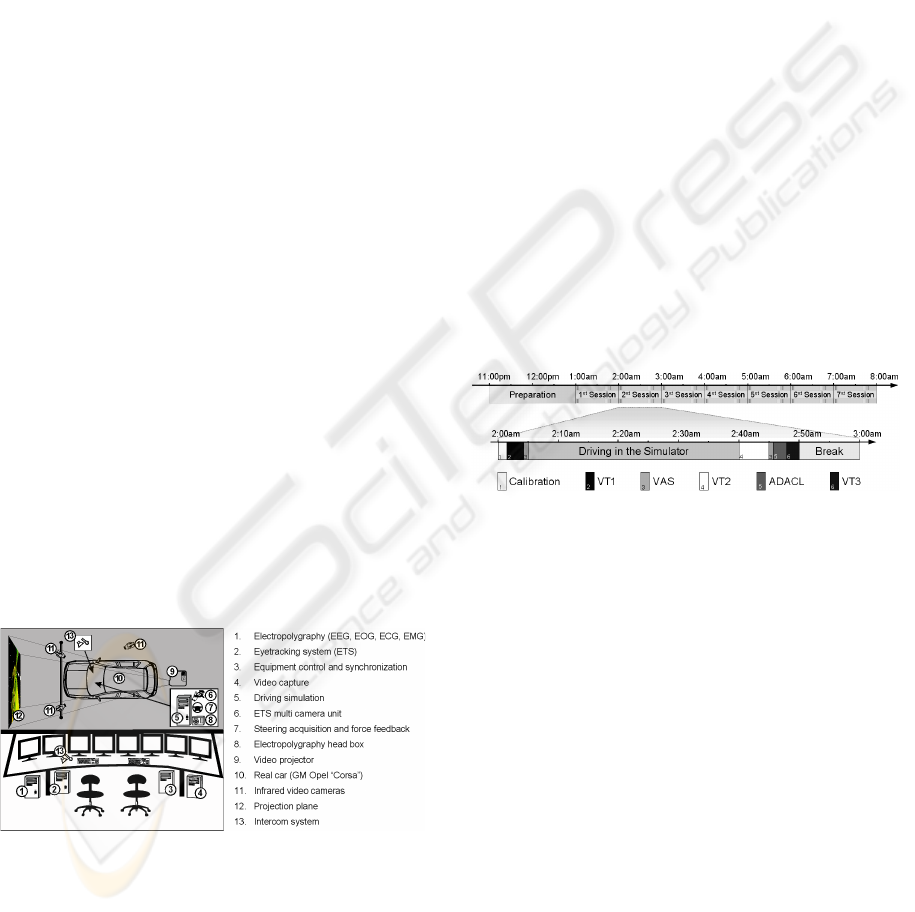
Figure 1: Lab layout: dark simulator room (grey) with a
real car; operator room (light grey).
Experimental investigations were conducted in
our driving simulation lab consisting of an operator
room and a fully dark, temperature controlled simu-
lator room (Fig. 1). Subjects had to drive a real car
(GM Opel “Corsa”) on a slightly winding road under
conditions of night vision. No oncoming traffic was
simulated in order to maintain high level of monoto-
ny. The driving scene was projected on a projection
plane 2.6 m in front of the subject; maximum visual
angle is 56 deg. In case of complete road departures
a force feedback to the steering wheel was switched
on. This was in nearly all cases effective enough to
waken drowsy subjects.
For monitoring subjects behaviour three video
cameras were utilized: (1) of subjects left eye region,
(2) of her / his head and upper part of the body, and
(3) of driving scene. Video recordings were used for
online and offline scoring as explained later. Logged
variables of the driving simulator were lane devia-
tion, velocity, steering angle, and pedal movements;
sampling rate was 10 s
-1
. Furthermore, several elec-
trophysiological signals were derived. Seven EEG
channels (C3,
Cz,
C4,
O1,
O2,
A1,
A2, common ave-
rage reference), two of EOG (vertical, horizontal),
one of ECG, and one of EMG (musculus submenta-
lis) were sampled at a rate of 128 s
-1
. Further 6 sig-
nals were recorded by a binocular eye tracking sys-
tem (ETS) at a rate of 250 s
-1
. For each eye the pupil
size
and
the two coordinates of eye gaze on the plane
of projection were measured.
Figure 2: Operating schedule of one experimental night.
Subjects had to complete seven driving sessions. In each
session subjects drove in the simulator and attended three
vigilance tasks (VT 1 - 3), and two questionnaires (VAS =
Visual Analogue Scale, ADACL = Thayer Activation-De-
activation Adjective Checklist).
In all, subjects had to complete seven driving
sessions lasting 35 min, each preceded and followed
by vigilance tests and responding to sleepiness ques-
tionnaires (Figure 2) which are not considered in this
paper. Before starting the next driving session a 10
min long break was inserted for subjects needs and
in order to motivate the subject to continue driving
with best possible performance. Driving started at
1:00 a.m. after a day of normal activity and a time
since sleep of at least 16 hours.
On the one hand, our design has the disadvantage
of non-continuous driving due to questionnaires,
vigilance tests and breaks. But on the other hand a
large total time-on-duty is gained and a time-of-day
effect due to passing the circadian trough can be
observed. We experienced earlier that it is hard to
BIOSIGNALS 2009 - International Conference on Bio-inspired Systems and Signal Processing
442

motivate a subject for continuous driving in a simu-
lator for longer than two or three hours; most of
them are willing to give up when the first MSE arise.
We believe that our design results in much more
examples of MSE than in continuous driving of
equivalent total length (4 h).
Driving tasks were chosen intentionally monoto-
nous and with time-since-sleep up to 24 hours to
support drowsiness and occurrence of MSE. MSE
were detected online by two operators who observed
the subject utilizing three video camera streams as
aforementioned. Typical signs of MSE are e.g. pro-
longed eyelid closures, roving eye movements, head
noddings, major driving incidents and drift-out-of-
lane accidents. We have found 3,573 MSE (per sub-
ject: mean number 162 ± 91, range 11 - 399).
The step of online scoring is critical, because
there are no unique signs of MSE, and their exact
beginning is sometimes hardly to define. Therefore,
all events were checked offline by an independent
expert and
were corrected if necessary. Unclear MSE
characterized by e.g. short phases with extremely
small eyelid gap, inertia of eyelid opening or slow
head down movements were excluded from further
analysis. Non-MSEs were selected at all times out-
side of clear and of unclear MSE. We have picked
out the same amount of Non-MSE as of MSE in or-
der to have a balanced data set. Our intention was to
design a detection system for clear MSE versus clear
Non-MSE classification. We hypothesize that such a
system can not only detect the MSE recognized by
human experts. They should also offer a possibility
to detect unclear MSE cases which are not easily
recognizable by experts. In another paper we report
on first positive results to this hypothesis (Sommer
et al., 2008).
4 DATA ANALYSIS
Pre-processing, feature extraction, classification and
validation are typically the main steps of discrimi-
nant analysis. Three main steps of pre-processing
were performed: signal segmentation, artefact remo-
val and missing data substitution. Segmentation of
all signals was done with respect to the observed
temporal starting points of MSE or Non-MSE using
two free parameters, the segment length and the tem-
poral offset between first sample point of the seg-
ment and starting point of the event. The first para-
meter adjusts the trade-off between temporal and
spectral resolution whereas the second parameter
controls the location of the region-of-interest on the
time axis. Both parameters are of high importance
and were found to be optimal when offset is -3 sec
and segment length is 8 sec (Golz et al., 2007). This
means that classification is working best when
biosignals from 3 sec immediately before MSE to 5
sec after MSE onset are analyzed. Artefact detection
in EEG and missing data in ETS during every eyelid
closure were both of minor importance (Golz et al.,
2007).
We utilized the common periodogram and the re-
cently introduced method of Delay Vector Variance
(DVV) (Lal and Craig, 2002) as feature extraction
tools. The first method assumes stationary signals
and their generating system is linear. It is a direct
method to estimate logarithmic PSD. DVV
transforms the signal to the state space utilizing time
delay embedding. Provided that distinct conditions
are fulfilled, e. g. if the signal generating system can
be described by relatively simple coupled ordinary
differential equations, this has the advantage that
signals exhibiting some degree of irregularity in the
time domain are mapped on relatively simple
trajectories in the state space. Simple statistical tests
in the state space can then be utilized to estimate to
which degree the signal may be generated by a
nonlinear system and to estimate how large may be
the amount of stochasticity in the signal. Both
features are important and are dependent on one free
parameter which controls the degree of similarity in
the sate space. Therefore, two feature sets are
generated by DVV. They may vary over time if the
signal generating process alters as it might by when
a MSE is oncoming.
After completion of pre-processing and feature
extraction the stage of classification analysis is up
next. It turned out that Support Vector Machines
(SVM) outperform several other methods (Golz et
al., 2007). It is a stochastic learning method and is
adapting discriminant functions in order to gain high
adaptivity and also high generalizability. In order to
gain this several internal parameters are to be
optimized which is computational time consuming
(Golz et al., 2007). For comparison we utilized also
a winner-takes-all neural network, namely the
OLVQ1 algorithm. It demands much less
computational effort and is a good choice of effici-
ency when many parameters of pre-processing and
feature extraction are to be optimized empirically.
Next, validation is performed in order to estimate
the true error of classification. The expectation value
of the
classification
error
based on the training data is
known to be biased. This so-called training set error
is a useful
measure
to check how good the adaptation
of the discriminant function has been working. Seve-
ral cross validation methods have been developed in
order to get a second
measure, the test
error. Here we
DATA REDUCTION OR DATA FUSION IN BISOGINAL PROCESSING?
443
have used the “leave-one-out” cross validation, be-
cause it provides an almost unbiased estimation of
the true classification error, but it is computationally
expensive. Advantageously, in case of SVM an effi-
cient implementation is possible due to the support-
vector concept.
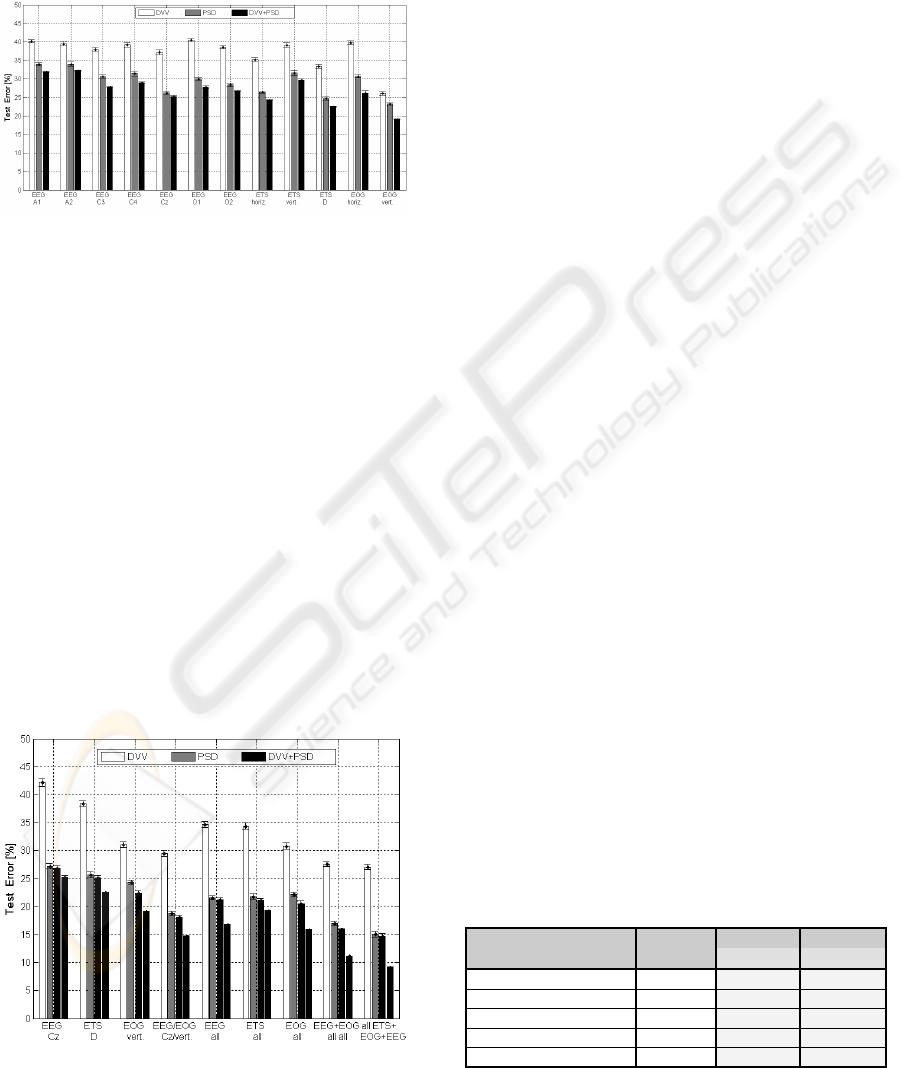
Figure 3: Mean and standard deviation of test set errors for
single signals and several examples of feature fusion.
5 RESULTS
Mean and standard deviation of test errors (Figure 3)
of different feature sets extracted from only one bio-
signal were estimated. The PSD feature set resulted
in lower errors than the DVV feature set (white bars
are always higher than grey bars). DVV shows good
potential in exploring the horizontal EOG, which is
due to eye blinks far from quasi-stationarity. This is
required for PSD estimation but not for DVV. The
fusion of both PSD and DVV features performed al-
ways better than PSD features alone (black bars are
always lowest). The vertical EOG component turned
out as most successful for microsleep detection, but
error rates are around 20 %.
The fusion of features of different signals always
reduces errors (six right most groups of bars in Figure
Figure 4: Mean and standard deviation of test set errors for
several examples of feature fusion.
4). The fusion of the best single channels (EOG ver-
tical and EEG Cz) performs better than the fusion of
all EEG signals, or of all ETS, or of both EOG sig-
nals. But this is clearly outperformed by fusion of all
EEG and all EOG features, or of all EEG + EOG +
ETS features (two right most groups of bars in Fig.
4). The latter resulted in mean test errors lower than
10 %. A comparison of more classification methods
and a report of some more details on discriminant
analysis, their parameters and their computational
costs can be found elsewhere (Golz et al., 2007).
Different methods of feature reduction were app-
lied to all nine EEG
and EOG
signals (Table
1). First,
no reduction was aimed to have a baseline result. So,
513 features per channel were processed. SVM (E
Test
= 13.1 %) performs much better than OLVQ1 (E
Test
=
27.7
%). Next, PCA (principal
component analysis)
was utilized to reduce the number of features down
to 60 for OLVQ1 and 128 for SVM. This was found
as an empirical optimum with minimal test errors
(OLVQ1: 17.4 %; SVM: 10.9 %). The third method
was the commonly used summation in four spectral
bands (delta, theta, alpha, beta), which leads to total
number of features of N
F
= 4 features / signal x 9
signals = 36 features. It clearly came out that this
reduction is too much. Next, summation in small,
equidistant spectral bands was performed, whereby
frequency range and width of the bands were deter-
mined empirically. We found a range of 0.5 to 23.5
Hz and a width of 1 Hz optimal, i.e. 24 features per
signal. The fifth method was a summation in bands
whereby ranges where determined by utilizing Evo-
lutionary Strategies (ES). The number of features
per channel was preset to 10. Further details can be
found elsewhere (Golz et al., 2007), (Sommer and
Golz, 2007). Results show that feature reduction
leads to more than 3 % of error reduction which can
be gained by simple averaging in small spectral
bands or by ES optimization. The common method
of reduction to the delta, theta, alpha, and beta band
is as bad as no reduction.
Table 1: Results of 5 different feature reductions applied
to EEG and EOG. Test set errors (E
Test
) were estimated by
Multiple Hold-Out and by Leave-One-Out cross validation
utilizing OLVQ1 and SVM, respectively. The number of
features (N
F
) varies largely between cases.
Case N
F
OLVQ1 SVM
E
TEST
[%] E
TEST
[%]
(1) No reduction 4617. 27.7 ± 0.6 13.1 ± 0.3
(2) PCA 60 / 128. 17.4 ± 0.4 10.9 ± 0.2
(3) fixed band 36. 17.5 ± 0.4 13.2 ± 0.3
(4) equidistant bands 216. 15.7 ± 0.4 9.9 ± 0.1
(5) ES-OLVQ1 90. 14.1 ± 0.4 9.8 ± 0.1
BIOSIGNALS 2009 - International Conference on Bio-inspired Systems and Signal Processing
444

6 CONCLUSIONS
It has been shown that fusion of features has poten-
tial to improve detection accuracy of driver’s micro-
sleep. Features of two different extraction methods,
namely the Power Spectral Density (PSD) and the
Delay Vector Variance (DVV), were fused first, but
with a limited success. Fusion of different signals of
one signal type, such as all EEG signals, as well as
fusion of different signal types, namely EEG, EOG,
ETS, resulted in clear improvements. The best single
EEG signal (Cz) gained a mean error of 25 %. The
fusion of all 7 EEG signals reduced errors down to
16 %, and the fusion of all 15 signals available redu-
ces errors down to 9 %.
In high-dimensional spaces it is apparently intra-
ctable to search systematically and to approximate a
general, high-dimensional function accurately. This
is known as the so-called “curse of high dimensiona-
lity”. But, Support-Vector Machines and also other
modern methods of computational intelligence, but
not OLVQ1, impressively demonstrated that high di-
mensionality must not be a curse. OLVQ1 perfor-
mance decreased largely when the number of input
variables (features) was very high. Our results also
showed that fusion of features of all signals is most
beneficial.
Reduction is of limited advantage and was only
successful for highly correlating features, e.g. sum-
mation of PSD values in small spectral bands. There
is presumably no potential for further improvements
due to feature reduction. This was demonstrated by
computational expansive optimizations of the para-
meters of spectral bands utilizing Evolutionary Stra-
tegies. Note that these optimizations are capable to
search for different spectral bands for each subject,
if it would be advantageously.
Future work should reveal if a further diversifi-
cation of feature extraction may increase performan-
ce of discriminant analysis. Different types of featu-
res should then be fused which is likely to improve
accuracy and robustness of MSE detection.
On the one hand the detection of driver’s micro-
sleep is a relatively clear case illustration for the
problem of spontaneous behavioural events and their
detection. On the other hand, their detection in bio-
signals will be a necessary milestone for future on-
line driver monitoring technology. It explores the
extreme end of driver’s fatigue where it is essential
to avoid attention losses. The practical goal of such a
detection system is to establish a laboratory referen-
ce standard for detection of microsleep and extreme
hypovigilance. Contactless operating online driver
monitoring technology, which is currently under
development by car industry, must be validated uti-
lizing such a laboratory reference standard.
REFERENCES
Donoho, D. (2000). High-Dimensional Data Analysis: The
curses and blessing of dimensionality. Ann Conf Amer
Math Soc, Los Angeles. (http://www-stat.stan-
ford.edu/~donoho/Lectures)
Overview at http://www.microsleep.de
Schleicher, R., N. Galley, S. Briest, L. Galley (2007).
Blinks and Saccades as Indicators of Fatigue in
Sleepiness Warnings: Looking Tired? Ergonomics,
vol. 51, pp. 982-1010.
Summala, H., H. Häkkänen, T. Mikkola, J. Sinkkonen
(1999). Task effects on Fatigue Symptoms in Over-
night Driving. Ergonomics, vol. 42, pp. 798-806.
Ingre, M., T. Akerstedt, B. Peters, A. Anund, G. Kecklund
(2006). Subjective Sleepiness, Simulated Driving
Performance and Blink Duration. J Sleep Research,
vol. 15, pp. 47-53.
Santamaria, J., K.H. Chiappa (1987). The EEG of
Drowsiness in Normal Adults, J Clin Neurophysiol,
vol. 4, pp. 327-382.
Maulsby, R.L. et al (1968). The Normative Electro-
encephalographic Data Reference Library, Final
Report, Contract NASA 9-1200, National Aeronautics
and Space Administration.
Akerstedt, T., G. Kecklund, A. Knutsson (1991). Manifest
Sleepiness and the Spectral Content of the EEG
During Shift Work, Sleep, vol. 14, pp. 221-225.
Makeig, S., T. P. Jung (1995). Changes in Alertness are a
Principal Component of Variance in the EEG
Spectrum, Neuroreport, vol. 7, pp. 213-216.
Makeig, S., T.P. Jung, T. Sejnowski (2000). Awareness
During Drowsiness: Dynamics and Electrophy-
siological Correlates, Can J Exp Psychol, vol. 54, pp.
266-273.
Lal, S., A. Craig (2002). Driver Fatigue: Electroence-
phalography and Psychological Assessment, Psycho-
physiology, vol. 39, pp. 313-321.
Wilhelm, B. et al (2001). Daytime Variations in Central
Nervous System Activation Measured by a
Pupillographic Sleepiness Test, J Sleep Res, vol.10,
pp.1-7.
Sommer, D., M. Golz, J. Krajewski (2008). Consecutive
Detection of Extreme Central Fatigue. Proc 4
th
Europ
Congr Med & Biomed Engineering (EMBEC-2008),
to appear.
Golz, M., D. Sommer, M. Chen, U. Trutschel, D. Mandic
(2007). Feature Fusion for the Detection of
Microsleep Events. J VLSI Signal Proc Syst, vol. 49,
pp. 329-342, 2007.
Sommer, D., M. Golz (2007). Feature Reduction for
Microsleep Detection. In IWK’07, 52nd Int. Sci. Koll.,
Technical Univ. of Ilmenau, Germany, Vol I, 77-82.
DATA REDUCTION OR DATA FUSION IN BISOGINAL PROCESSING?
445
