
EFFICIENT CLASSIFICATION FOR LARGE-SCALE PROBLEMS
BY MULTIPLE LDA SUBSPACES
Martina Uray
Institute of Digital Image Processing
Joanneum Research, Austria
Peter M. Roth, Horst Bischof
Institute for Computer Graphics and Vision
Graz University of Technology, Austria
Keywords:
LDA, Image classification, Large databases.
Abstract:
In this paper we consider the limitations of Linear Discriminative Analysis (LDA) when applying it for large-
scale problems. Since LDA was originally developed for two-class problems the obtained transformation
is sub-optimal if multiple classes are considered. In fact, the separability between the classes is reduced,
which decreases the classification power. To overcome this problem several approaches including weighting
strategies and mixture models were proposed. But these approaches are complex and computational expensive.
Moreover, they were only tested for a small number of classes. In contrast, our approach allows to handle a
huge number of classes showing excellent classification performance at low computational costs. The main
idea is to split the original data into multiple sub-sets and to compute a single LDA space for each sub-set.
Thus, the separability in the obtained subspaces is increased and the overall classification power is improved.
Moreover, since smaller matrices have to be handled the computational complexity is reduced for both, training
and classification. These benefits are demonstrated on different publicly available datasets. In particular, we
consider the task of object recognition, where we can handle up to 1000 classes.
1 INTRODUCTION
Linear Discriminative Analysis (LDA) is a popular
and widely used statistical technique for dimension
reduction and linear classification. Important appli-
cations include face recognition (Belhumeur et al.,
1997), speech recognition (Hunt, 1979), or image re-
trieval (Swets and Weng, 1996). The main idea is to
search for a linear projection, that preserves a maxi-
mum amount of discriminative information when pro-
jecting the original data onto a lower dimensional
space. In fact, Fisher (Fisher, 1936) introduced a pro-
jection that minimizes the Bayes error for two classes.
Hence, by maximizing the Fisher criterion (see Sec-
tion 2), that analyzes the between scatter versus the
within scatter for two classes, an optimal solution
with respect to the Bayes error is obtained. For more
details see, e.g., (Fukunaga, 1990).
Later this approach was extended for multiple
classes by Rao (Rao, 1948). But Loog et al. (Loog
et al., 2001) showed that for more than two classes
maximizing the Fisher criterion provides only a sub-
optimal solution. In general, the Fisher criterion
maximizes the mean squared distances between the
classes, which, however, is different from minimizing
the Bayes error. In particular, thus obtained projec-
tions tend to overemphasize distances of already well
separable classes (in the original space). Neighboring
classes may overlap in the projected subspace, which
reduces the separability and the classification perfor-
mance. But for many practical applications (e.g., face
recognition) only a small number of well separable
classes are considered. Under this condition even the
sub-optimal solution mostly provides an approxima-
tion of sufficient accuracy to solve the specific task.
In contrast, in this paper, we apply LDA for multi-
class classification for large-scale problems (i.e., up to
1000 classes). Hence, we expect that due to the sub-
optimal projection an increasing number of classes
would decrease the classification performance. This
299
Uray M., M. Roth P. and Bischof H. (2009).
EFFICIENT CLASSIFICATION FOR LARGE-SCALE PROBLEMS BY MULTIPLE LDA SUBSPACES.
In Proceedings of the Fourth International Conference on Computer Vision Theory and Applications, pages 299-306
DOI: 10.5220/0001754802990306
Copyright
c
SciTePress
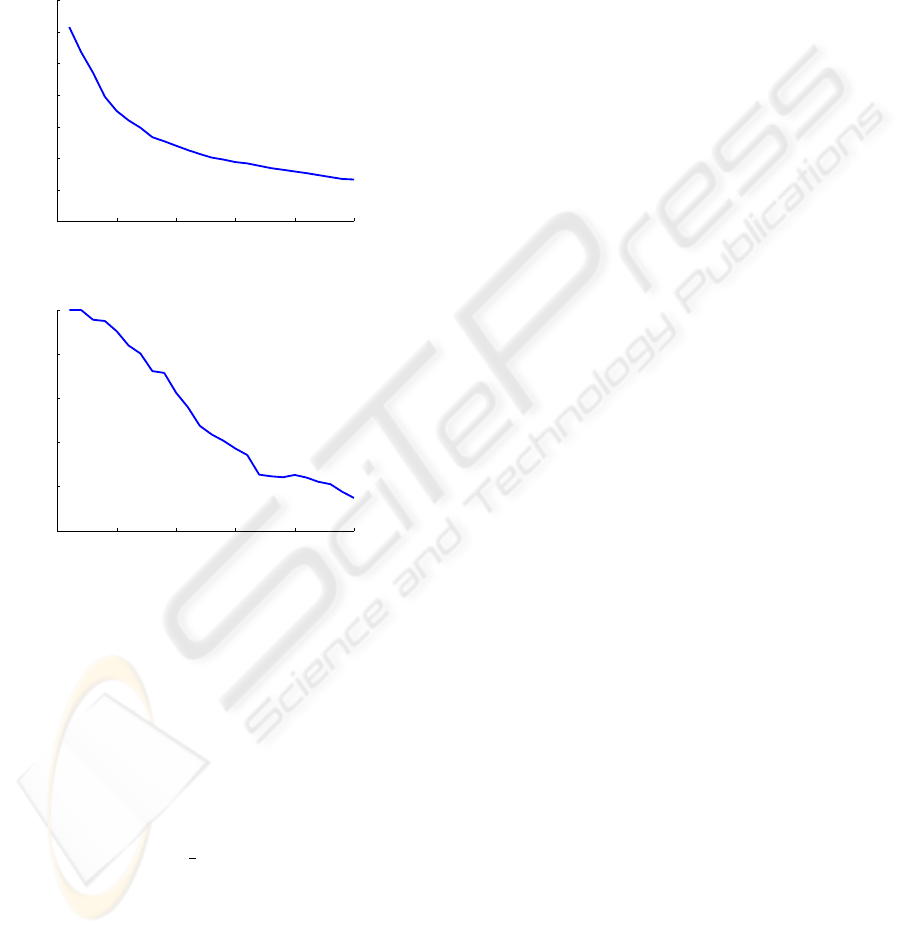
is illustrated for an image classification task (i.e., on
the ALOI database (Geusebroek et al., 2005)). From
Figure 1(a) it can be seen that for an increasing num-
ber of classes (i.e, starting from 10 up to 250) the dis-
tances between the class centers and thus the separa-
bility are decreased. As a consequence, the classifica-
tion rate is successively decreased, which is shown in
Figure 1(b).
0 50 100 150 200 250
0
500
1000
1500
2000
2500
3000
3500
number of classes
mean distances between cc
(a)
0 50 100 150 200 250
50
60
70
80
90
100
number of classes
recognition rate in %
(b)
Figure 1: Decreasing classification performance for in-
creasing number of classes: (a) mean distances between
class centers and (b) related corresponding classification
rates.
To overcome these drawbacks several approaches
were proposed that are based on implicit weighting
schemes (Zhou and Yang, 2004; Loog et al., 2001) or
the estimation of mixture models (Kim et al., 2003).
Loog et al. (Loog et al., 2001) introduced a modi-
fied Fisher criterion that is more closely related to the
classification error. For that purpose, they decompose
the c-class criterion into
1
2
c(c − 1) two-class criteria.
This allows to define weighting functions penalizing
classes that are close together, such that the contri-
bution of each pair of classes for the overall criterion
directly depends on the Bayes error between the two
classes (weighted pairwise Fisher criteria). But due
to its computational complexity and the occurrence of
the small sample size problem this approach can not
directly be applied for high-dimensional data such as
images. Thus, Zhou and Yang (Zhou and Yang, 2004)
reduce the dimension of the input data by discarding
the null-space of the between-class scatter matrix and
apply the weighted LDA approach on the thus dimen-
sion reduced data. In contrast, Kim et al. (Kim et al.,
2002; Kim et al., 2003) propose to estimate LDA mix-
ture models (especially, to cope with multi-modal dis-
tributions). The main idea is to apply PCA mixture
models (Tipping and Bishop, 1999) to cluster indi-
vidual classes first. Then, individual LDA projection
matrices are estimated and classification is done by
the standard nearest neighbor search over all projec-
tions.
The methods described above reduce the problems
resulting from the sub-optimal projection, but they
have two disadvantages. First, they are computational
very expensive. For the weighted LDA approaches
the pairwise Fisher criteria have to be estimated for
all pairs. Similarly, for the LDA mixture approach the
PCA mixture models have to be estimated in an iter-
ative way using the EM-algorithm (Dempster et al.,
1977). In both cases these computations might be
quite expensive, especially, if the number of classes
is very large. Second, these methods were only evalu-
ated for small datasets (i.e., up to 128 classes). Hence,
in this paper we propose a method that is computa-
tionally much cheaper; even for very large-scale prob-
lems!
The main idea is to reduce the complexity of the
problem by splitting the data into a pre-defined num-
ber of equal sized sub-clusters that can still be han-
dled by a single LDA model. Since, in this work we
are mainly focused on reducing the problem’s com-
plexity these clusters are selected randomly. Once the
LDA subspaces were estimated an unknown sample
can be classified by projecting it onto all subspaces.
The classification is finally done by a nearest neigh-
bor search. Since the subspaces are isometric the
Euclidean norm is equivalent over all subspaces and
the closest class center can be chosen. As shown in
the experiments, in this way the classification per-
formance can significantly be improved; especially
if the number of classes is very large. Moreover,
since smaller matrices have to be handled the com-
putational costs as well as the memory requirements
can be dramatically reduced; especially in the training
stage!
The outline of the remaining paper is as follows:
First, in Section 2 we review the standard LDA ap-
proach and introduce the multiple LDA subspace rep-
resentation. Next, experimental results are given in
Section 3. Finally, we conclude the paper in Section 4.
VISAPP 2009 - International Conference on Computer Vision Theory and Applications
300

2 MULTIPLE LDA SUBSPACES
2.1 Standard LDA
Given a dataset X = [x
1
,. .. ,x
n
] ∈ IR
m×n
of n sam-
ples, where each sample belongs to one of c classes
C
1
,. .. ,C
c
. Then, LDA computes a classification
function
g(x) = W
>
x , (1)
where W is selected as the linear projection, that min-
imizes the within-class scatter
S
w
∈ IR
m×m
=
c
∑
i=1
n
i
(µ
i
− µ)(µ
i
− µ)
>
(2)
whereas it maximizes the between-class scatter
S
b
∈ IR
m×m
=
c
∑
i=1
∑
x∈C
i
(x − µ
i
)(x − µ
i
)
>
, (3)
where µ is the mean over all samples, µ
i
is the mean
over class C
i
, and n
i
is the number of samples in class
C
i
. In fact, this projection is obtained by maximizing
the Fisher-criterion
W
opt
= argmax
W
W
>
S
b
W
W
>
S
w
W
. (4)
The optimal solution for this optimization problem is
given by the solution of the generalized eigenproblem
S
b
W = ΛS
w
W , (5)
or directly by computing the eigenvectors for S
−1
w
S
b
.
Since the rank of S
−1
w
S
b
is bounded by the rank of
S
b
there are c − 1 non-zero eigenvalues resulting in a
(c − 1)-dimensional subspace L = W
>
X ∈ IR
(c−1)×n
,
which preserves the most discriminant information.
For classification of a new sample x ∈ IR
m
the class
label ω ∈ {1, ...,c} is assigned according to the re-
sult of a nearest neighbor classification. For that pur-
pose, the Euclidean distances d of the projected sam-
ple g(x) and the class centers ν
i
= W
>
µ
i
in the LDA
space are compared:
ω = argmin
1≤i≤c
d (g(x), ν
i
) . (6)
2.2 Multiple Class LDA
To overcome the limitations of the standard LDA
approach when applying it for large-scale problems
we propose to reduce the complexity by splitting the
problem into sub-problems. This can be motivated
on basis of a theoretic criterion proposed by Mart
´
ınez
and Zhu (Mart
´
ınez and Zhu, 2005), that describes the
linear separability of classes:
e
K =
1
c − 1
c−1
∑
i=1
max
∀r≤s
u
>
r
v
s
2
. (7)
The parameter
e
K is estimated by analyzing the angle
between the eigenvectors u
r
and v
s
, obtained by solv-
ing the eigenproblem for the scatter matrices S
b
and
S
w
:
S
b
U = Λ
u
U (8)
S
w
V = Λ
v
V . (9)
In fact, it was shown that a large value
e
K, which is
equivalent to a small angle, corresponds to a high
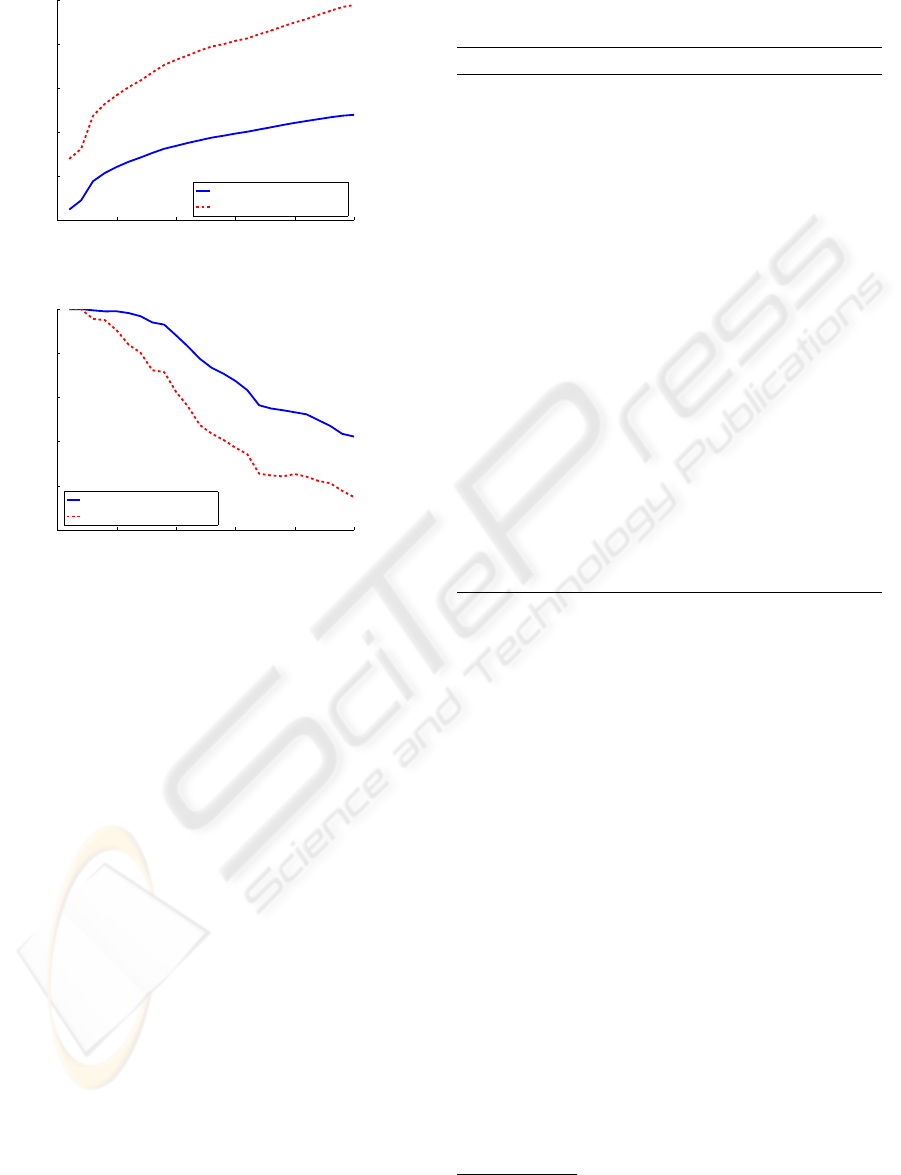
probability of incorrect classification. To investigate
the separability for an increasing number of classes
we analyzed the parameter
e
K for varying datasets of
different complexity. In particular, we considered
growing sub-sets of ALOI (in steps of ten classes)
for different levels of variability in the training data
(i.e., small versus large changes between the training
views). From Figure 2(a) it can be seen that increas-
ing the complexity of the problem (i.e., increasing the
number of classes) also increases
e
K. That is, the sepa-
rability and thus, as illustrated in Figure 2(b), the clas-
sification performance is decreased. Moreover, it can
be seen that in addition to the number of classes the
similarity between training and testing data has also a
large influence on the separability. 5
From this observation we can deduce that simpli-
fying the complexity of the problem by reducing the
number of classes increases the classification power.
Consequently, instead of building a single large sub-
space we propose to split the data into several sub-
clusters and to build multiple small (well separable)
subspaces.
More formally, given a dataset X = [x
1
,. . . ,x
n
] ∈
IR
m×n
of n samples, where each sample belongs
to one of c classes C
1
,. . . ,C
c
. First, X is ran-
domly split into k non-overlapping clusters X
j
∈
IR
m×n
j
, each consisting of l classes C
j1
,. . . ,C
jl
, such
that X = {X
1
∪ . . . ∪ X
k
}. In addition, the class
means {µ
j1
,. . . ,µ
jl
} ⊂ {µ
1
,. . . ,µ
c
} and the over-
all cluster mean µ
j
are estimated. Next, for each
cluster X
j
an (l − 1)-dimensional LDA subspace
L
j
= W
>
j
X
j
∈ IR
(l−1)×n
j
is estimated by solving the
individual eigenvalue problems
(S
−1
w j
S
b j
)W
j
= Λ
j
W
j
, (10)
EFFICIENT CLASSIFICATION FOR LARGE-SCALE PROBLEMS BY MULTIPLE LDA SUBSPACES
301
0 50 100 150 200 250
0.03
0.05
0.07
0.09
0.11
0.13
number of classes
K value
small training variation
large training variation
(a)
0 50 100 150 200 250
50
60
70
80
90
100
number of classes
recognition rate in %
small training variation
large training variation
(b)
Figure 2: Decreasing linear separability for increasing num-
ber of classes for varying complexity of the training data:
(a) Quality criterion
e
K and (b) corresponding recognition
rates.
where
S
w j
=
l
∑
i=1
∑
x∈C
ji
(x
j
− µ
ji
)(x
j
− µ
ji
)
>
(11)
S
b j
=
l
∑
i=1
n
ji
(µ
ji
− µ
j
)(µ
ji
− µ
j
)
>
. (12)
Finally, for each LDA subspace l class centers
ν
ji
∈ IR
l−1
are determined by projecting class means
µ
ji
onto the corresponding subspaces:
ν
ji
= W
>
j
µ
ji
, i = 1,... , l . (13)
Each of the k subspaces internally describes l
classes C
ji
. Thus, the class centers ν
ji
have to be
reassigned to their original labels. Since there is no
intersection of clusters (i.e., each class is assigned to
exactly one cluster) the relabeling is unique, giving
the original number of c class centers:
k
[
j=1
{ν
j1
,. . . ,ν
jl
} 7→ {ν
1
,. . . ,ν
c
} . (14)
The whole training procedure is summarized in Algo-
rithm 1.
Algorithm 1 : Multiple LDA learning.
Input: Dataset X ∈ IR
m×n
, number of sub-clusters k
and data labels ω ∈ {1,. ..,c}
Output: LDA matrices W
j
∈ IR
m×(l−1)
and class
centers {ν
1
,. . . ,ν
c
} with ν
i
∈ IR
(l−1)
1: Sample l = c/k random objects for each cluster:
{L
j
} ⊂ {1,. ..,c}, |L
j
| = l
and {L
r
} ∩ {L
s
} = {}, ∀r 6= s
2: Split the dataset:
X
j
⊂ X according to {L
j
}, X
j
∈ IR
m×n
j
3: for j = 1 to k do
4: Calculate PCA+LDA on each dataset X
j
:
W
j
∈ IR
m×(l−1)
5: Project class means onto LDA space:
ν
ji
= W
>
j
µ
ji
, i = 1,... , l
6: end for
7: Reassign sub-cluster class centers the overall
class label:
S
k
j=1
{ν
j1
,. . . ,ν
jl
} 7→ {ν
1
,. . . ,ν
c
}
Once the k LDA subspaces were estimated the
crucial step is the classification. For that purpose a
test sample x ∈ IR
m
is projected onto all k subspaces.
Since all clusters are of the same size the resulting
(Euclidean) LDA subspaces are of the same dimen-
sion. From Linear Algebra it is known that vector
spaces of the same dimension are isomorphic
1
and
that isomorphic structures are structurally identical
(see, e.g., (Strang, 2006)). Hence, the Euclidean dis-
tances in these subspaces accord and can directly be
compared. Thus, the class label ω ∈ {1,. . .,c} for an
unknown test sample x can be estimated by searching
for the closest class center over all projected spaces:
g
j
(x) = W
>
j
x (15)
ω = arg min
1≤i≤c,1≤ j≤k
d (g
j
(x),ν
i
) . (16)
3 EXPERIMENTAL RESULTS
In this section, we show the benefits of the proposed
approach. First, we discuss the typical problems that
occur when the number of classes is increasing. For
1
An isomorphism is a one-to-one map from a vector
space onto itself.
VISAPP 2009 - International Conference on Computer Vision Theory and Applications
302
that purpose, we analyze the distances between the
class centers in relation to the number of classes and
discuss the influence of how the sub-clusters are se-
lected. Next, we compare the proposed approach with
a standard LDA approach, which encompasses only
a single subspace
2
. In fact, we will show that our
method can handle large databases (even with large
variability in the appearance) considerably better than
the standard approach. Finally, we show that there is
also a benefit in terms of memory requirements and
computational costs.
The experiments were carried out on two large
publicly available databases, that were slightly
adapted:
1. The Columbia Image Database Library (COIL-
100) (Nene et al., 1996) consists of 100 objects
with 72 colored images of views from 0 to 360
degrees taken in 5 degree steps.
2. The Amsterdam Library Of Images ALOI-
1000 (Geusebroek et al., 2005) consists of 1000
objects with 72 colored images of views from 0 to
360 degrees taken in 5 degree steps. The images
contain the objects in their original size as well
as some background. To define tasks of different
complexity, we created two additional datasets:
ALOI-100, which consists of the first 100 objects,
and ALOI-250, which consists of 250 randomly
chosen objects.
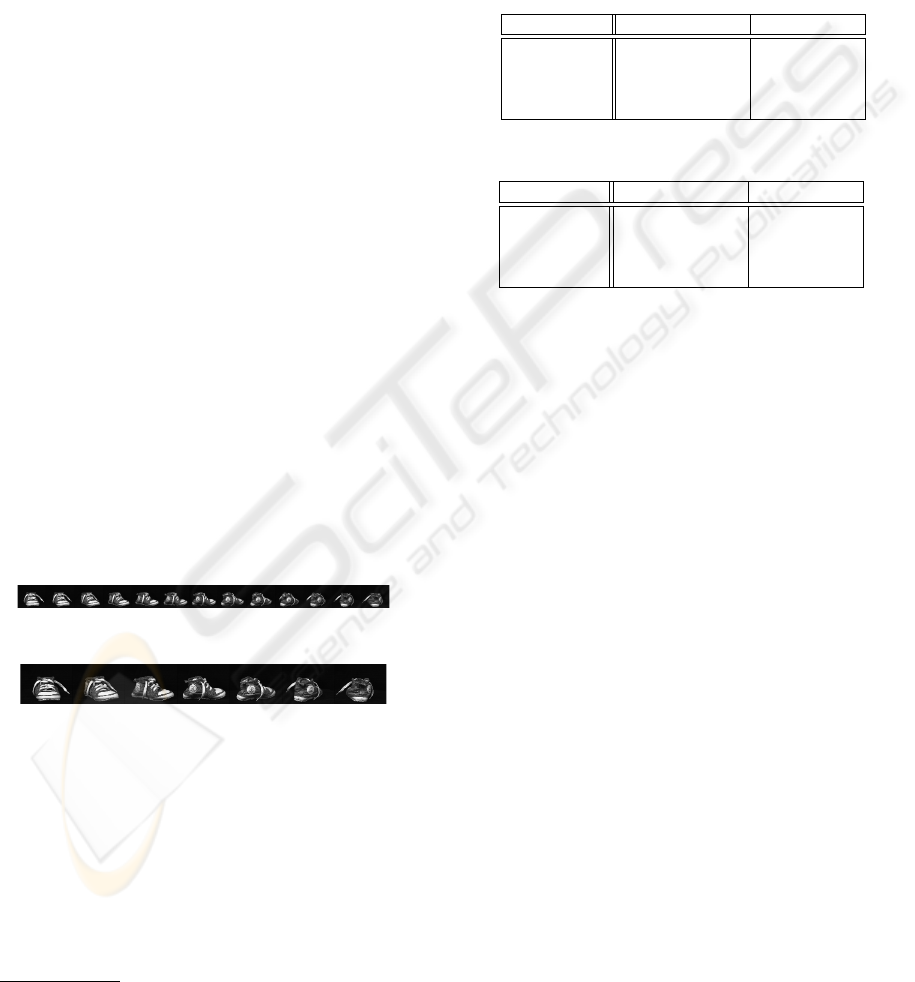
In order to emphasize the influence of data com-
plexity we used training images describing viewpoint
changes of 15
◦
and 30
◦
having two levels of difficulty
(see Figure 3). All other images were used for testing,
respectively.
(a)
(b)
Figure 3: Training images for one object of ALOI: (a) 15
◦
dataset and (b) 30
◦
dataset.
3.1 Cluster Analysis
As discussed in Section 2 an increasing number of
classes encompassed by a single subspace results in
decreasing distances of the class centers. Moreover,
the distances between the class centers and the (test)
2
We are using the PCA+LDA approach (Belhumeur
et al., 1997) for subspace construction.
samples are increasing. Both, in fact, reduce the sep-
arability between the classes. This behavior is illus-
trated in Table 1, where the mean distances between
the class centers and the mean distances between the
test data and the class centers are listed for the 15
◦
and the 30
◦
datasets.
Table 1: Mean distances between class centers and between
test data and correctly assigned class centers (single sub-
space LDA): (a) 15
◦
datasets and (b) 30
◦
datasets.
dataset center to center test to center
COIL-100 267.78 116.38
ALOI-100 479.71 88.90
ALOI-250 294.21 240.76
ALOI-1000 167.02 89.48
(a)
dataset center to center test to center
COIL-100 509.74 251.14
ALOI-100 718.27 188.71
ALOI-250 661.92 477.46
ALOI-1000 375.75 326.67
(b)
It can be seen that the mean distances between the
class centers are reduced to half when the number of
classes is decoupled. Similarly, the mean distance be-
tween the test data and the class centers is doubled.
This shows clearly that the final classifications get in-
creasingly unreliable. Thus, it is clear that smaller
clusters would give better results!
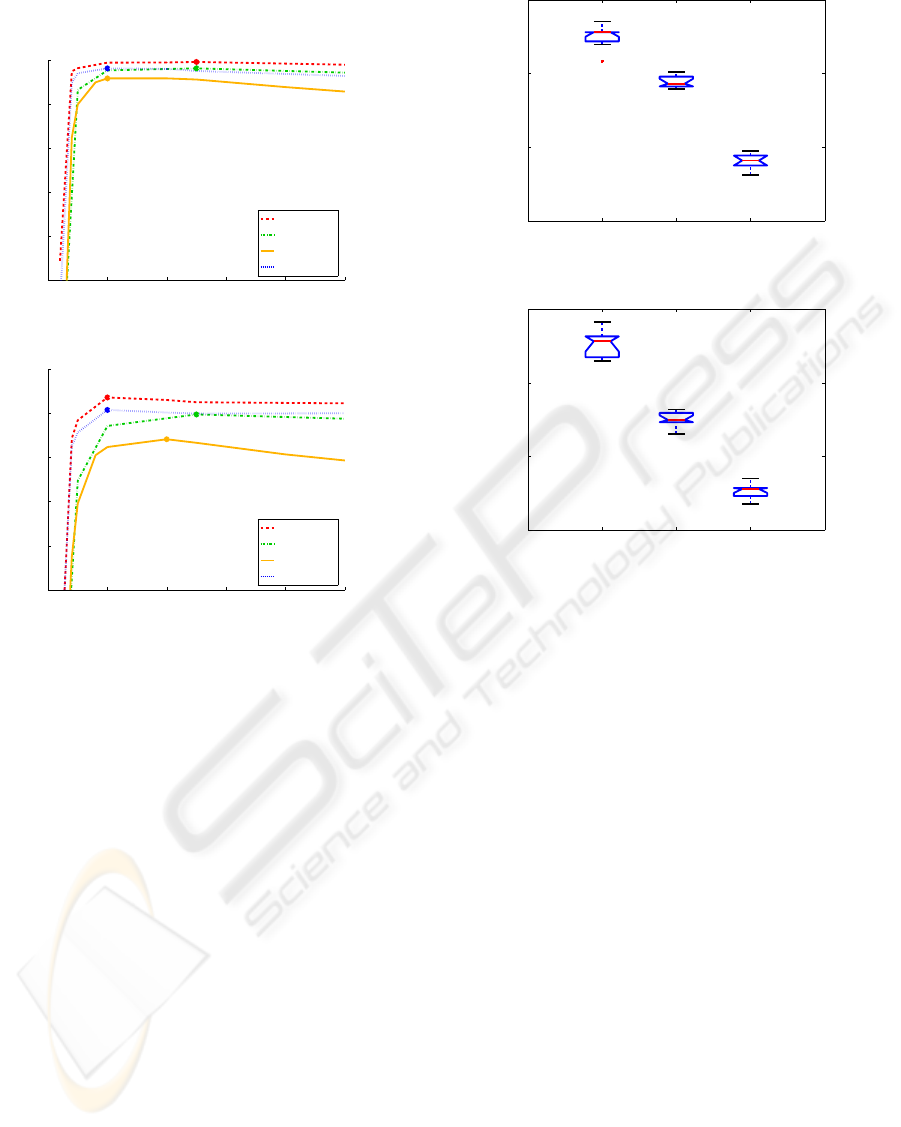
In order to build appropriate clusters we analyzed
which cluster size would give the best recognition
results. For that purpose, we divided each of the
datasets randomly into all valid sub-clusters (i.e, all
subspaces have to have the same size). For instance,
for ALOI-100 we got l ∈ {2,4, 5, 10,20,25,50}. The
obtained recognition rates for all datasets are depicted
in Figure 4. It can be seen that the maxima lie between
10 and 25 objects per cluster. Since there are no sig-
nificant differences between the classification errors
in this range the selection of l = 10 is reasonable (also
other datasets showed good performance using this
sub-cluster size). The drop of the recognition rates for
growing subspaces emphasizes the observation that a
small subspace better spans the cluster centers of the
objects, reducing the probability of a fail in classifica-
tion. On the contrary, if the number of sub-clusters is
too small the recognition is not reliable either. This re-
sults from the fact that the classes mutually influence
each other when building the subspace such that an
unknown sample has no clear class correspondence.
But if there are only two classes one class center is al-
ways favored, being affected by only one other class.
EFFICIENT CLASSIFICATION FOR LARGE-SCALE PROBLEMS BY MULTIPLE LDA SUBSPACES
303
As a result the closest distances in all clusters are sim-
ilar and a correct assignment is not possible.
0 10 20 30 40 50
50
60
70
80
90
100
number of classes per cluster
recognition rate in %
ALOI100
ALOI250
ALOI1000
COIL100
(a)
0 10 20 30 40 50
50
60
70
80
90
100
number of classes per cluster
recognition rate in %
ALOI100
ALOI250
ALOI1000
COIL100
(b)
Figure 4: Recognition rates for different cluster sizes, where
the marker indicates the highest recognition rate: (a) 15
◦
datasets and (b) 30
◦
datasets.
In this work we are mainly concerned with re-
ducing the complexity of the classification problem.
Thus, the sub-clusters were selected randomly. But in
the following we show that the selection of the clus-
ters has only little influence on the performance of
our approach. For that purpose, we randomly split the
three different datasets of ALOI into sub-clusters of
size 10 and applied the proposed multiple subspace
method. This procedure was repeated ten times; hav-
ing different clusters each time! The results are sum-
marized in Figure 5.
From the box-plots it can be seen that the vari-
ance in the recognition rates for varying selections is
quite small (i.e., approx. ±0.5% for the 15
◦
datasets
and approx. ±1.0% for the 30
◦
datasets). Thus, the
composition of the clusters has only little influence on
the recognition rate and the discrimination between
arbitrary classes is mainly sensitive to the number of
classes.
100 250 1000
94
96
98
100
recognition rate in %
number of classes
(a)
100 250 1000
80
85
90
95
recognition rate in %
number of classes
(b)
Figure 5: Box plots of the recognition rates of the ALOI
datasets by repeated random sampling of sub-clusters con-
taining 10 objects each: (a) 15
◦
datasets and (b) 30
◦
datasets.
3.2 Classification Results
The crucial step in the multiple subspace recognition
is that the assignment of clusters implicitly also re-
turns the “hidden” nearest class center. Thus, each
sub-cluster label has to be mapped to the overall class
label, which, in fact, is a simple lookup. As can
be seen from Table 2 the cluster assignment works
very well for both training scenarios (i.e., 15
◦
and 30
◦
datasets), resulting in a much higher recognition rate
than for the single LDA subspace. More precisely, the
cases, where the correct clusters are found but the ob-
jects are miss-classified, are quite rare. In addition,
in Table 2 we give a comparison of results obtained
using the proposed approach employing sub-clusters
of size 10 compared to a standard LDA approach for
four datasets of different complexity.
It can be seen that the proposed method out-
performs the single subspace LDA for all datasets
and that the recognition rate can be drastically in-
creased. Especially, for the different subsets of the
ALOI database the relative improvement of the final
recognition rate is increasing with increasing com-
VISAPP 2009 - International Conference on Computer Vision Theory and Applications
304
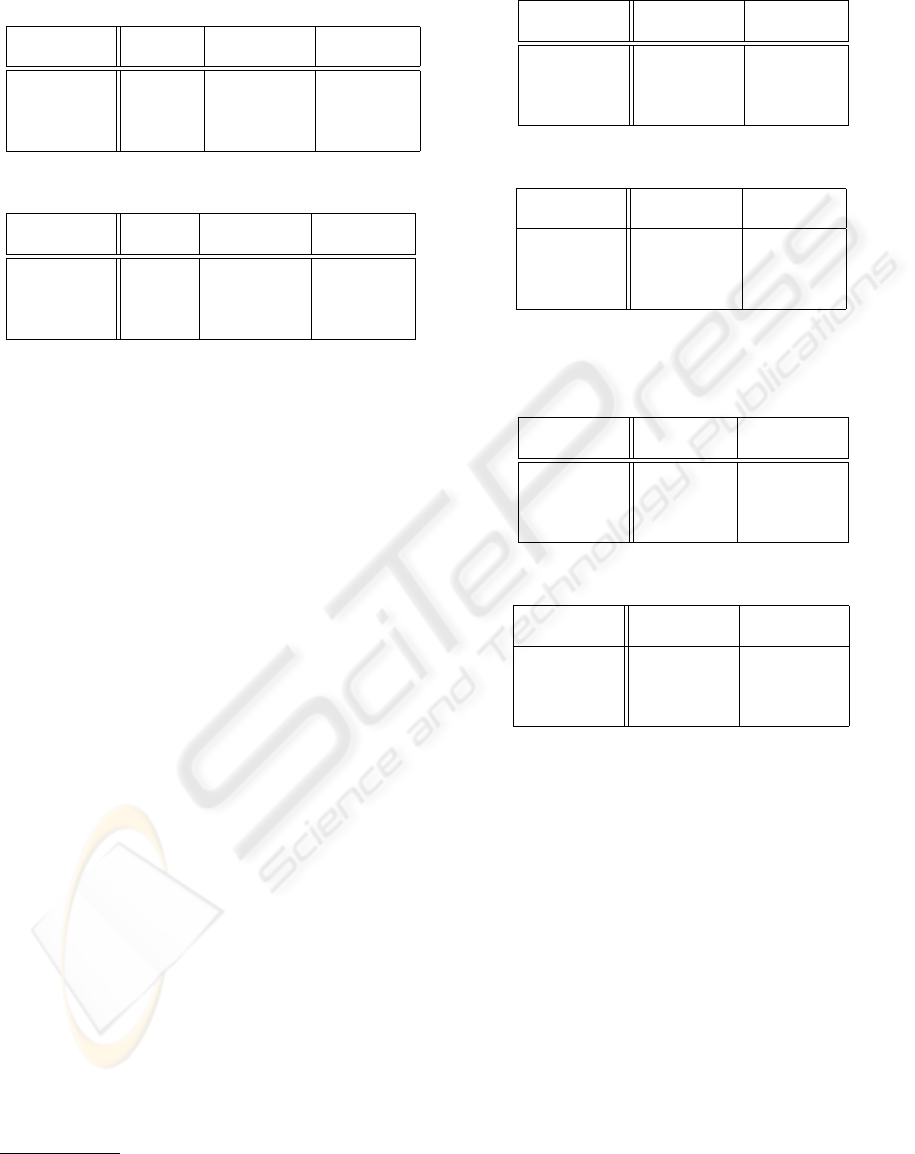
Table 2: Classification performance: correct sub-cluster and
final recognition rate (10 objects per cluster) vs. recognition
rate in full LDA space: (a) 15
◦
datasets and (b) 30
◦
datasets.
dataset
correct multiple single
cluster LDA spaces LDA space
COIL-100 98.04 % 98.04% 85.79%
ALOI-100 99.75 % 99.75% 96.25%
ALOI-250 97.58 % 97.52% 71.12%
ALOI-1000 95.77 % 95.76% 62.24%
(a)
dataset
correct multiple single
cluster LDA spaces LDA space
COIL-100 90.75% 89.75% 69.67%
ALOI-100 93.58% 93.08% 87.42%
ALOI-250 89.73% 88.77% 57.40%
ALOI-1000 84.12% 83.97% 37.31%
(b)
plexity of the task. In fact, for the ALOI-1000 we
finally achieve an improvement of 34% for the 15
◦
dataset and even 47% for the 30
◦
dataset. Similar re-
sults (i.e., a recognition rate of 94% − 98%) for such
large image datasets (i.e., ALOI-1000 ) were only re-
ported by Kim et al. (Kim et al., 2007). But the results
can not be directly compared, since the database was
adapted slightly different (i.e., only 500 classes were
considered and the training and test sets were defined
differently).
3.3 Memory Requirements and
Computation Time
An additional advantage of smaller subspaces is that
smaller matrices have to be handled, resulting in
lower memory requirements and reduced computa-
tional costs. This especially credits for the training,
which heavily depends on the eigenvalue decompo-
sition of the training data in the PCA step and of the
scatter matrices in the LDA step. This is demonstrated
in Table 3 and in Table 4, where we summarized the
computation times
3
and memory requirements for the
30
◦
datasets, respectively.
It can be seen that for increasing complexity the
relative computation time for training compared to
the standard approach is reduced. Starting from a
reduction factor 4 for COIL-100 to a factor 165(!)
for ALOI-1000 ! During evaluation the effect is less
significant since the total representation size is only
slightly reduced (i.e., from c − 1 to c − k). But still
the evaluation effort is approximately halved.
3
The experiments were carried out in MATLAB on an
Intel Xeon 3.00GHz machine with 8GB RAM.
Table 3: Computational costs for the 30
◦
datasets: (a) train-
ing and (b) testing.
dataset
multiple single
LDA spaces LDA space
COIL-100 27.66s 103.57s
ALOI-100 16.41s 105.51s
ALOI-250 41.22s 1414.24s
ALOI-1000 166.00s 27395.22s
(a)
dataset
multiple single
LDA spaces LDA space
COIL-100 3.85s 7.14s
ALOI-100 6.41s 11.64s
ALOI-250 39.13s 72.88s
ALOI-1000 426.78s 733.80s
(b)
Table 4: Memory requirements for the 30
◦
datasets:
(a) training and (b) testing.
dataset
multiple single
LDA space LDA spaces
COIL-100 138.54MB 221.68MB
ALOI-100 161.07MB 296.56MB
ALOI-250 254.38MB 655.78MB
ALOI-1000 540.52MB 3331.25MB
(a)
dataset
multiple single
LDA spaces LDA space
COIL-100 227.15MB 257.47MB
ALOI-100 215.35MB 217.90MB
ALOI-250 489.22MB 556.30MB
ALOI-1000 2089.10MB 2175.41MB
(b)
The same applies for the memory requirements
– increasing the complexity relatively decreases the
costs. In particular, for ALOI-1000 the required
memory for training was reduced from more than
3GB to 540MB by a factor 6. But there are no sig-
nificant differences for the evaluation stage since due
to the implementation all test data is kept in memory.
4 CONCLUSIONS
In this paper we presented an approach that over-
comes the main limitations when applying LDA for
a large number of classes. The main idea is to (ran-
domly) split the original data into several subsets and
to compute a separate LDA representation for each of
them. To classify a new unknown test sample it is
projected onto all subspaces, where a nearest neigh-
EFFICIENT CLASSIFICATION FOR LARGE-SCALE PROBLEMS BY MULTIPLE LDA SUBSPACES
305

bor search is applied to assign it to the correct clus-
ter and hidden class, respectively. To demonstrate
the benefits of our approach we applied it for two
large publicly available datasets (i.e., COIL-100 and
ALOI). In fact, compared to a single model LDA we
get a much better classification results, which are even
competitive for large datasets containing up to 1000(!)
classes. Moreover, since the resulting data matrices
are much smaller the memory requirements and the
computational costs are dramatically reduced. Fu-
ture work will include to apply a more sophisticated
clustering, which, in fact, would further increase the
separability and thus the classification power of the
method.
ACKNOWLEDGEMENTS
This work was supported by the FFG project AUTO-
VISTA (813395) under the FIT-IT programme, and
the Austrian Joint Research Project Cognitive Vision
under projects S9103-N04 and S9104-N04.
REFERENCES
Belhumeur, P. N., Hespanha, J. P., and Kriegman, D. J.
(1997). Eigenfaces vs. Fisherfaces: Recognition Us-
ing Class Specific Linear Projection. IEEE Trans. on
Pattern Analysis and Machine Intelligence, 19(7):711
– 720.
Dempster, A. P., Laird, N. M., and Rubin, D. B. (1977).
Maximum Likelihood from Incomplete Data via the
EM Algorithm. Royal Statistical Society, 39(1):1 –
38.
Fisher, R. A. (1936). The Use of Multiple Measurements
in Taxonomic Problems. Annals of Eugenics, 7:179–
188.
Fukunaga, K. (1990). Introduction to Statistical Pattern
Recognition. Academic Press.
Geusebroek, J. M., Burghouts, G. J., and Smeulders, A.
W. M. (2005). The Amsterdam Library of Object Im-
ages. Computer Vision, 61(1):103 – 112.
Hunt, M. (1979). A statistical approach to metrics for word
and syllable recognition. In Meeting of the Acoustical
Society of American, volume 66, pages 535 – 536.
Kim, H., Kim, D., and Bang, S. Y. (2002). Face Recognition
Using LDA Mixture Model. In Proc. Intern. Conf. on
Pattern Recognition, volume 2, pages 486 – 489.
Kim, H., Kim, D., and Bang, S. Y. (2003). Extensions
of LDA by PCA Mixture Model and Class-Wise Fea-
tures. Pattern Recognition, 36(5):1095 – 1105.
Kim, T.-K., Kittler, J., and Cipolla, R. (2007). Discrimina-
tive Learning and Recognition of Image Set Classes
Using Canonical Correlations. IEEE Trans. on Pat-
tern Analysis and Machine Intelligence, 29(6):1005 –
1018.
Loog, M., Duin, R. P. W., and Haeb-Umbach, R. (2001).
Multiclass Linear Dimension Reduction by Weighted
Pairwise Fisher Criteria. IEEE Trans. on Pattern Anal-
ysis and Machine Intelligence, 23(7):762 – 766.
Mart
´
ınez, A. M. and Zhu, M. (2005). Where are Lin-
ear Feature Extraction Methods Applicable? IEEE
Trans. on Pattern Analysis and Machine Intelligence,
27(12):1934 – 1944.
Nene, S. A., Nayar, S. K., and Murase, H. (1996). Columbia
Object Image Library (COIL-100). Technical Report
CUCS-006-96, Columbia University.
Rao, C. R. (1948). The Utilization of Multiple Measure-
ments in Problems of Biological Classification. Royal
Statistical Society – Series B, 10(2):159 – 203.
Strang, G. (2006). Linear Algebra and Its Applications.
Brooks/Cole.
Swets, D. L. and Weng, J. (1996). Using Discriminant
Eigenfeatures for Image Retrieval. IEEE Trans. on
Pattern Analysis and Machine Intelligence, 18(8):831
– 837.
Tipping, M. E. and Bishop, C. M. (1999). Mixtures of
Probabilistic Principal Component Analyzers. Neural
Computation, 11(2):443 – 482.
Zhou, D. and Yang, X. (2004). Face Recognition Using
Direct-Weighted LDA. In Proc. of the Pacific Rim
Int. Conference on Artificial Intelligence, pages 760 –
768.
VISAPP 2009 - International Conference on Computer Vision Theory and Applications
306
