
SEVERE APNOEA DETECTION USING SPEAKER
RECOGNITION TECHNIQUES
Rubén Fernández, Jose Luis Blanco, Luis A. Hernández, Eduardo López
GAPS: Signal, Systems & RadioComm. Department Universidad Politécnica de Madrid, Spain
José Alcázar
Respiratory Department. Unidad de Trastornos Respiratorios del Sueño Hospital Clínico Universitario Málaga, Spain
Doroteo T. Toledano
ATVS Biometric Recognition Group. Universidad Autonoma de Madrid, Spain
Keywords: Apnoea, Automatic Speaker Recognition techniques, GMM, Nasalization.
Abstract: The aim of this paper is to study new possibilities of using Automatic Speaker Recognition techniques
(ASR) for detection of patients with severe obstructive sleep apnoea (OSA). Early detection of severe
apnoea cases can be very useful to give priority to their early treatment optimizing the expensive and time-
consuming tests of current diagnosis methods based on full overnight sleep in a hospital. This work is part
of an on-going collaborative project between medical and signal processing communities to promote new
research efforts on automatic OSA diagnosis through speech processing technologies applied on a carefully
designed speech database of healthy subjects and apnoea patients. So far, in this contribution we present and
discuss several approaches of applying generative Gaussian Mixture Models (GMMs), generally used in
ASR systems, to model specific acoustic properties of continuous speech signals in different linguistic
contexts reflecting discriminative physiological characteristics found in OSA patients. Finally, experimental
results on the discriminative power of speaker recognition techniques adapted to severe apnoea detection are
presented. These results obtain a correct classification rate of 81.25%, representing a promising result
underlining the interest of this research framework and opening further perspectives for improvement using
more specific speech recognition technologies.
1 INTRODUCTION
Obstructive sleep apnoea (OSA) is a highly
prevalent disease (Puertas et al., 2005), affecting an
estimated 2-4% of population between the ages of
30 and 60 years. It is characterized by recurring
episodes of upper airway obstruction during sleep,
and it is usually associated with loud snoring and
increased daytime sleepiness. OSA is a serious
threat to an individual’s health if not treated (Puertas
et al., 2005). OSA is a risk factor for cardiovascular
disease (Coccagna et al., 2006), it is usually related
to traffic accidents caused by somnolent drivers
(Puertas et al., 2005; Lloberes et al., 2000), and it
can lead to a poor quality of life and impaired work
performance. A full overnight sleep study is usually
required to diagnose OSA; referred to as
polysomnography it involves the recording of
neuroelectrophisiological and cardiorespiratory
variables. Polysomnography is an expensive and
time-consuming test so patients usually have to
suffer a waiting list of several years before the test is
done (Puertas et al., 2005). At present, the most
effective and widespread treatment for OSA is nasal
CPAP (Continuous Positive Airway Pressure) which
prevents apnoea episodes providing a pneumatic
splint to the airway.
In this article we investigate the acoustical
characteristics of patients’ speech with OSA with the
purpose of relying on an automatic system for severe
apnoea voice assessment. The acoustic properties of
speakers suffering from obstructive sleep apnoea are
124
Fernández R., Blanco J., A. Hernández L., López E., Alcazar J. and T. Toledano D. (2009).
SEVERE APNOEA DETECTION USING SPEAKER RECOGNITION TECHNIQUES.
In Proceedings of the International Conference on Bio-inspired Systems and Signal Processing, pages 124-130
DOI: 10.5220/0001546601240130
Copyright
c
SciTePress

not clear, and not much research has been made on
it. However, there are some studies pointing at
possible abnormalities in phonation, articulation and
resonance (Fox & Monoson, 1989). In a previous
research, we designed and collected an apnoea
speech database (Fernández et al., 2008) based on
both, the review of previous research in this field,
and a preliminary manual contrastive study
performed on a small group of healthy subjects and
apnoea patients. This contrastive study helped us to
identify phonetically related acoustic characteristics
of patients’ speech with OSA.
In this work, we explore the possibilities for the
adaptation of Automatic Speaker Recognition
techniques (ASR) to severe apnoea cases diagnosis.
To our knowledge this represents a pioneer research
on automatic severe OSA diagnosis using signal
processing algorithms on continuous speech. The
proposed method intends to be complementary to
existing OSA diagnosis methods (i.e.
Polysomnography) and clinician perceptual
judgments, to help in an early detection of these
cases. Early severe OSA detection can enable more
efficient medical protocols, giving higher priority to
more risky cases (there is a high risk of car accident
due to somnolence in severe apnoea patients) and
thus optimizing both social benefits and medical
resources. The proposed system is based on
Gaussian Mixture Models (GMMs), which
represents the state-of-the-art for speaker recognition
(Reynolds et al., 2000).
More specifically, our work is mainly focused on
the nasality factor, since it has been traditionally
identified as an important feature in the acoustic
characteristics of apnoea speakers. The term
nasalization can refer to two different phenomena in
the context of speech; hyponasality and
hypernasality. The first type occurs if no
nasalization is produced when the speech sound
should actually be nasal. This is the case when for
example having a cold. Hypernasality is nasalization
during the production of non-nasal (voiced oral)
sounds. The interested reader can find an excellent
reference work in (Pruthi, 2007). Up to now no
signal processing and pattern recognition techniques
have been applied to the analysis hyponasal or
hypernasal continuous speech in OSA patients,
therefore this will represent one of the aims of our
research.
The rest of this paper is organized as follows:
Section 2 addresses the physiological and acoustic
characteristics in OSA patients. The speech database
used in our experimental work is described in
Section 3. Section 4 explores the possibilities of
using GMM approaches to study and model
nasalization in OSA patient’s speech. Application of
speaker recognition technologies for automatic
severe apnoea detection is presented in Section 5.
Finally, some conclusions and future research are
given in Section 6.
2 PHYSIOLOGICAL &
ACOUSTIC
CHARACTERISTICS IN OSA
SPEAKERS
Nowadays is still not clear neither the
articulatory/physiologically settings nor the acoustic
characteristics of speech in apnoea speakers. Most of
the more valuable information in this field can be
found in Fox and Monoson work (Fox & Monoson,,
1989) where a perceptual study with skilled judges
was presented comparing voices from apnoea
patients and a control group (referred to healthy
subjects). This study showed that although
differences between both groups of speakers were
found, acoustic cues for these differences are
somewhat contradictory and unclear. What seemed
to be clear was that apnoea group had abnormal
resonances that might be due to altered structure or
function of the upper airway, and theoretically, this
anomaly should result not only in a respiratory but
also in a speech dysfunction. Consequently, the
presence of speech disorder in a OSA population
should be expected, and it could include
abnormalities in articulation, phonation and
resonance:
• Articulatory Anomalies: Fox and Monoson
stated that neuromotor dysfunction could be
found in a sleep apnoea population as a “lack of
regulated innervations to the breathing
musculature or upper airway muscle hypotonus”
This dysfunction is normally related to speech
disorders, especially dysarthria. There are
several types of dysarthria, resulting in various
different acoustic features. All types of
dysarthria affect the articulation of consonants
and vowels causing the slurring of speech.
Another common feature in apnoea patients is
hypernasality and problems with respiration.
• Phonation Anomalies: The phonation
anomalies may be due to the fact that the heavy
snoring of sleep apnoea patients can cause the
inflammation in the upper respiratory system and
affect the vocal cords.
SEVERE APNOEA DETECTION USING SPEAKER RECOGNITION TECHNIQUES
125

• Resonance Anomalies: The analysis of
resonance characteristics for the sleep apnoea
group in (Fox & Monoson, 1989) did not yield
any clear conclusion. These authors only
conclude that resonance abnormalities in apnoea
patients could be perceived as hyponasality or
hypernasality. It is only recently that resonance
disorder affecting speech sound quality has been
associated with vocal tract damping features
distinct from airflow in balance between the oral
and nasal cavities. The term applied to this
speech disorder is “cul-de-sac” resonance and is
used for a type of hyponasality.
2.1 Initial Contrastive Acoustic Study
A manual contrastive study of an initial version of
our apnoea speech database was made. A similar
revision can be found in (Fiz et al, 1993) where an
acoustic spectral analysis was applied to sustained
vowels to detect possible OSA cases. Nevertheless,
this study doesn’t investigate all the possible
acoustic characteristics in apnoea patients’ voice
because the use of sustained vowels excludes the
study of other acoustic clues present in continuous
speech and measures based on the comparison
between different linguistic contexts (Parsa &
Jamieson, 2001)..
For our preliminary study, a group of 16
speakers, eight in the apnoea group and eight in the
control group, were recorded. All the speakers
uttered a same group of 25 phonetically balanced
sentences; they were extracted from the phonetic
corpus of Albayzin database (Moreno et al., 1993), a
resource for speech recognition technology in
Spanish. The contrastive study was performed by
visual comparison of frequency representations
(mainly spectrographic, pitch, energy and formant
analysis) of apnoea and control group speakers.
Following some conclusions of previous research
on acoustic characteristics of apnoea speakers we
checked nasality feature. The existence and the size
of one extra low frequency formant was studied
(Glass & Zue, 1985) as indicator of nasalization, but
no perceptual differences between the groups could
be found. As discussed in (Fox & Monoson, 1989),
this fact could be explained by the perceptual
difficulty in classifying the apnoea speakers’ voice
as hyponasal or hypernasal disorder. However,
studies on specific linguistic contexts were also
made and differences in the variation in nasalization
degree between different linguistic contexts (nasal
and non-nasal context) of both groups were found,
there being a tendency for the apnoea speakers to
have smaller differences between those contexts.
This is indeed very interesting. A hypothesis has
been that apnoea speakers might have an overall
higher nasality level due to velopharyngeal
dysfunction, and that the differences between oral
would be small, because the oral vowels would also
be nasalized. One explanation could be that the
control of the velopharyngeal mechanism is lower
for the apnoea speakers, which could lead to
difficulties in making changes of nasality, although
the absolute nasalization might be either high or low
Another interesting conclusion of our study was,
related to resonance anomalies, when we compare
the distance between the second and third formant
for the /i/ vowel, clear differences between the
apnoea and control groups were found. Apnoea
speakers showed a higher distance and this was
especially clear in diphthongs where /i/ was stressed,
for example in the Spanish word “Suiza” ('suj θa).
According to (Hidalgo & Quillis, 2002) the position
of the third formant might be related to the degree of
velopharyngeal opening. Lowering of velum gives
rise to higher frequencies of the third formant.
3 APNOEA DATABASE
The database collection was performed in the
Respiratory Department at Hospital Clínico
Universitario of Málaga, Spain. The database was
composed of about 80 male subjects; half of them
with severe sleep apnoea (AHI > 30), and the other
half healthy subjects or with mild OSA (AHI < 10).
Subjects in both groups have similar physical
characteristics such as age and body mass index.
Furthermore, speech material for the apnoea group
was recorded and collected in two different sessions:
one just before being diagnosed and the other after
several months under CPAP treatment. The analysis
of speech characteristics in these two sessions will
allow studying the evolution of apnoea patient’s
voice characteristics after the treatment.
3.1 Speech and Image Collection
Speech signal was recorded with a sampling
frequency of 48 kHz in an acoustically isolated
booth. Recording equipment was a standard laptop
computer equipped with a SP500 Plantronics
headset microphone that includes A/D conversion
and digital data exchange through USB-port.
Additionally, for each subject in the database,
two facial images (frontal and lateral views) were
collected under controlled illumination conditions
BIOSIGNALS 2009 - International Conference on Bio-inspired Systems and Signal Processing
126

and over a white flat background. A conventional
digital camera was used to obtain images in a 24-bit
RGB format, without compression and with a
2272x1704 resolution. We decide to collect visual
information because OSA is associated to a variable
combination of different anatomic factors and a
visual exam of the patient is suggested as first step
in the examination of a subject with clinical
suspicion of OSA (Puertas et al., 2005), valuing the
morphotype (i.e. obesity, short neck, etc.) and facial
features (i.e. malocclusions referred to bad bites,
etc.). To our knowledge, no research has been made
on finding evidences that could relate facial features
extracted through image processing of patients’ face
pictures to severe apnoea cases diagnosis. Thus we
decided to include both frontal and lateral pictures of
each patient’s face making it possible to research on
this challenging topic.
3.2 Speech Corpus
The speech corpus consists in four sentences
repeated three times and a sustained vowel /a/ also
repeated three times. The four sentences were
designed trying to cover all the relevant linguistic
contexts where physiological OSA features could
have higher impact on specific acoustic
characteristics of particular phonemes. Particular
emphasis has been put on:
• Sentence design that allows intra-speaker
variation measurements; that is to measure
differential voice features for each speaker, as,
for example, the nasalization degree between
vowels inside and outside nasal contexts.
• Continuous voiced sounds to measure irregular
phonation patterns related to muscular fatigue of
apnoea patients.
• Voiced sound in the context of guttural
phonemes to analyse the specific impact of
possible articulatory dysfunctions in the
pharyngeal region.
• A broad range of vowel sounds to allow the
accurate modelling of the articulation space and
other measures related to our preliminary
contrastive study.
All sentences where designed to exhibit a similar
melodic structure, and speakers where requested to
read them following this rhythmic structure. We
hope this controlled rhythmic recording procedure
could help in avoiding non-relevant inter-speaker
linguistic variability. Each sentence is presented in
the following paragraphs where the melodic groups
have been underlined.
1. Francia, Suiza y Hungría
ya hicieron
causa común. ('fraN θja 'suj θa i uŋ 'gri a
ya j 'θje roŋ 'kaw sa ko 'mun).
2. Julián no vio la manga roja
que ellos
buscan, en ningún almacén.(xu 'ljan no
'βjo la 'maŋ ga 'řo xa ke 'e λoz 'βus kan en
niŋ 'gun al ma 'ken).
3. Juan no puso la taza rota
que tanto le
gusta en el aljibe. (xwan no 'pu so la 'ta θa
'řo ta ke 'taN to le 'γus ta en el al 'xi βe).
4. Miguel y Manu llamarán entre ocho y
nueve y media. (mi 'γel i 'ma nu λa ma 'ran
'eN tre 'o t∫o i 'nwe βe i 'me ðja).
First phrase includes stressed vowels /i/ in
diphthongs where (according to our preliminary
contrastive study, see 2.1) differences between the
second and third formant could be distinctive in
apnoea speakers. Second and third phrases, both
negatives, have similar grammatical and intonation
structure. They could be useful to make contrastive
studies of vowels in different linguistic contexts.
Some examples of these contrastive pairs are: a
nasal context, “manga roja” ('maŋ ga 'řo xa) versus
a neutral context, “taza rota” ('ta θa 'řo ta). As we
mention in previous sections, these contrastive
analyses could be indeed very interesting to confirm
that apnoea speakers might have an overall higher
nasality level and smaller intra-speaker differences
between non-nasal and nasal vowels due to
velopharyngeal dysfunction. Fourth phrase includes
a relatively long sentence mainly composed of
voiced sounds read as one single melodic group in
order to discover possible phonation abnormalities
during the sustained generation of voiced sounds.
The three repetitions of the sustained vowel /a/,
including onset and offset, could be used to study
phonation measures (i.e. jitter and shimmer) that
detect the variations in amplitude and frequency of
the speakers, but in a more controlled way.
4 GMM FOR OSA VOICE
MODELLING
In this section we present an initial experimentation
directed to evaluate the capabilities of using
Gaussian Mixture Models techniques (GMM) to
model perceptual acoustic characteristics described
in previous research (Fox & Monoson, 1989) and
corroborated in our initial contrastive study.
In particular, as our speech database was
designed to allow a detailed contrastive analysis of
SEVERE APNOEA DETECTION USING SPEAKER RECOGNITION TECHNIQUES
127
vowels in oral and nasal phonetic contexts, we
focussed on reporting perceptual differences related
to resonance anomalies and perceived as
hyponasality or hypernasality. To that purpose,
GMM-based approach techniques were applied to
confirm these differences in nasalization degree
between different linguistic contexts, as was already
described in Section 2 and was revealed in the initial
contrastive study.
4.1 GMM Training and Testing
Protocol
Gaussian Mixture Models (GMMs) and adaptation
algorithms are effective and efficient pattern
recognition techniques suitable for sparse speech
data modelling in Automatic Speaker Recognition
systems (Reynolds et al., 2000) that we will apply
for apnoea voice modelling. In our experimental
framework, the ASR open source tool BECARS
(Blouet et al., 2004) was used. Details on
parameterization, model training and classification
phases for the BECARS baseline system are the
following:
• Parameterization consists in extracting
information from speech signal (in our case, 39
MEL frequency cepstral coefficients –MFCC-,
delta MFCCs and delta-delta MFCCs).
• GMMs for apnoea and control groups were
trained as follows. First, a universal background
model (UBM) was trained on a subcorpus of
Albayzin Database (Moreno et al., 1993), thus
entirely separated from the apnoea speech
database. Next, speech from apnoea and control
group speakers was used to train the apnoea and
control group GMM models. Both models were
trained using MAP adaptation from the UBM.
Only means were adapted (as classically done in
speaker verification). This technique increases
robustness of the models, especially when little
speech material is available. Obviously, speech
data from speakers for the model training was
not included in the test set.
For testing purposes, in order to increase the
number of tests and thus to improve the statistical
relevance of our results, the standard leave-x-out
testing protocol was used. This protocol consists in
discarding x speakers from the experimental set,
training some models on the remaining data and
testing with that x speakers. This scheme is
replicated until reaching a sufficient number of tests.
4.2 OSA Resonance Anomalies Study
using GMMs
With the aim of testing the capabilities of using
GMM technique to perform contrastive analysis on
perceived resonance anomalies, two GMMs for each
apnoea and healthy speaker were modelled using
speech from nasalized and non-nasalized vowels.
Both, nasal and non-nasal GMM models were
trained using a similar approach described in section
4.1; MAP adaptation from a generic vowel UBM
model trained using Albayzin. These two nasal/non-
nasal GMM models were used to quantify the
acoustic differences between nasal and non-nasal
contexts for both apnoea and control groups. The
smaller difference between nasal/non-nasal GMM
models, the more similar are both nasalized and non-
nasalized vowels; thus revealing the presence of
resonance anomalies. As distance measure between
nasal/non-nasal GMM models, a fast approximation
of the Kullback-Leibler (KL) divergence for
Gaussian Mixture Models was used (Do, 2003). This
distance is used in ASR to define cohorts or groups
of speakers producing similar sounds.
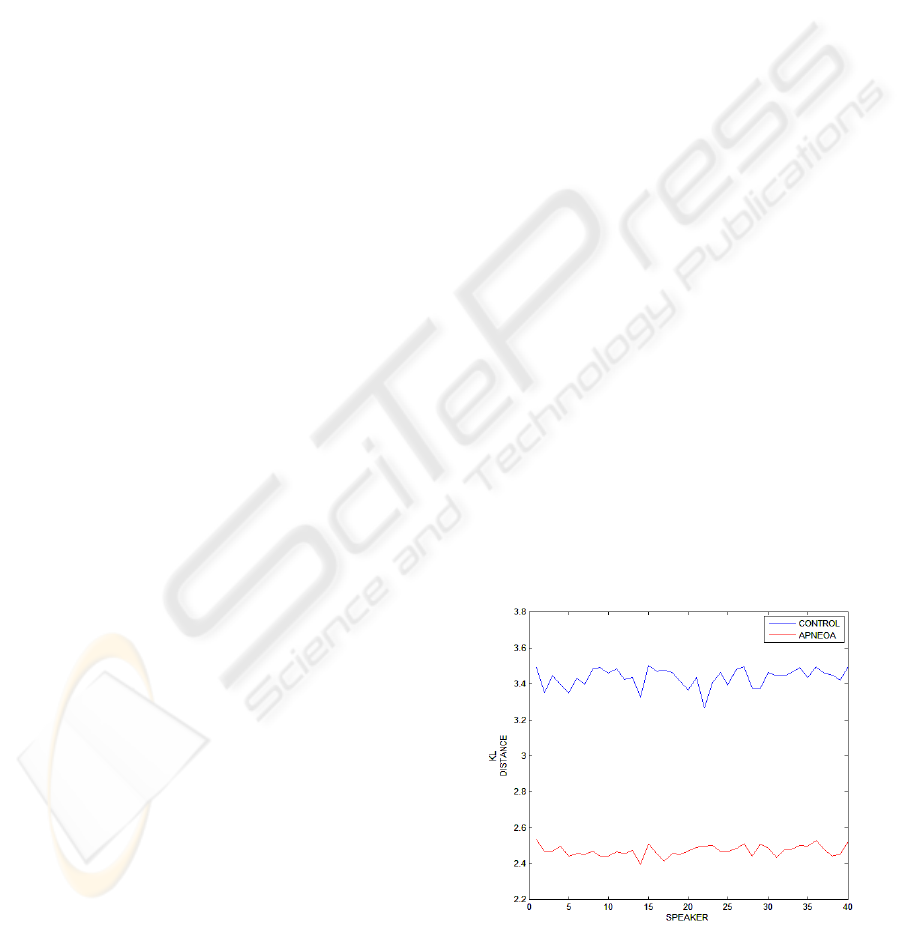
As can be seen in Figure 1, significant
differences in the nasal/non-nasal GMM distances
were found for control and apnoea groups. This
result clearly shows that acoustic differences
between oral and nasal vowels are smaller in apnoea
speakers and confirms the trend to an overall higher
nasality level revealed in previous research. As a
result, GMM approach appears as an appropriate and
suitable speech technique for further research on
modelling and detecting severe apnoea speakers.
Figure 1: Kullback distances differences between
nasal and non-nasal models for apnoea and control
speakers.
BIOSIGNALS 2009 - International Conference on Bio-inspired Systems and Signal Processing
128

5 GMM-BASED SPEAKER
RECOGNITION TECHNIQUES
FOR SEVERE APNOEA
DETECTION
As we have seen in the previous section, GMM
approach is able to model some of the already
described resonance abnormalities perceived in
apnoea speakers. Now, this experimental set-up was
intended to test the potential of applying standard
ASR techniques to the automatic diagnosis of
apnoea disease. A speaker verification system is a
supervised classification system able to discriminate
speech signals into two classes (genuine and
impostor). In our case, the classes will not
correspond to a given speaker, but a sleep apnoea
class and a control class (referred to healthy
subjects). This method is suitable for keeping track
the evolution of voice dysfunction among the
patients, is easy-to-use, quick, non-invasive for the
patients and affordable for the clinicians. The
proposed method is not expected to replace the
existing OSA diagnosis methods, but to help in an
early detection of severe apnoea cases.
Following a similar approach already used for
other pathological voice assessment studies
(Fredouille et al., 2005), GMM models representing
the apnoea and control classes were built as follows:
• The pathological and control GMM models
were trained from the generic UBM model
thanks to the MAP adaptation technique using
standard leave-x-out technique, in a similar
method as described above (Section 4).
• During the apnoea/non-apnoea detection phase,
an input speech signal corresponding to the
utterance of a speaker to be diagnosed is
presented to the system. The parameterised
speech is then processed with each apnoea and
control GMM model generating two likelihood
scores. From these two scores an
apnoea/control decision is made.
In these initial experiments the task of control and
apnoea voice classification has been investigated.
Table 1 provides the correct classification rates
obtained. An overall correct classification of 81.25
% is reached on this task.
Table 1: Correct Classification Rate.
Correct
Classi.
Rate in %
Control
Group
Apnoea
Group
Overall
77,50 %
(31/40)
85 %
(34/40)
81,25 %
(65/80)
Table 2 shows the statistical measures of the
performance for the same task (Fisher's exact test
p<0.0001 revealed statistically significant). Results
are presented in terms of Sensitivity: proportion of
positives which are correctly identified as such;
Specificity: proportion of negatives which are
correctly identified; Positive Predictive Value:
proportion of patients with positive test results who
are correctly diagnosed; Negative Predictive Value:
proportion of patients with negative test results who
are correctly diagnosed.
Table 2: Sensitivity, Specificity, Positive Predictive Value
and Negative Predictive Value.
Sensitivity Specificity
Positive
Predictive
Value
Negative
Predictive
Value
77,50 %
(31/40)
85 %
(34/40)
83,78 %
(31/37)
79,06 %
(34/43)
Considering the correct classification rates
achieved, there are some aspects to comment. The
results are encouraging and it seems that apnoea
information may be caught by a GMM based-
approach, even with few training speech. These
promising results have been obtained without
particular attention to the choice of acoustic
parameters used, so best results can be expected with
a representation of the audio data optimized for
pathology discrimination. Evidently, these
experiments have to be validated with a higher
population, but the results have already given us a
preliminary notion of the discriminative power of
this approach for the automatic diagnosis of severe
apnoea cases.
6 CONCLUSIONS AND FUTURE
RESEARCH
In this paper the acoustic properties of speakers with
severe obstructive sleep apnoea (OSA) and the
adaptation of standard ASR techniques for detection
and modelling of these patients have been presented.
This study represents a pioneer research in the field
SEVERE APNOEA DETECTION USING SPEAKER RECOGNITION TECHNIQUES
129

of automatic diagnosis of OSA disease.. Preliminary
experimental results on the speech database
collected using state-of-the-art GMM speaker
recognition techniques shows that it is worth
continuing the research on this area. Related to
nasality factor as an important feature in the acoustic
characteristics of apnoea speakers, GMM approach
have confirmed that there are significant differences
between apnoea and control group on the relative
nasalization degree between different linguistic
contexts. Therefore, future research will be focused
on exploiting this information in order to use it for
the automatic apnoea diagnosis. Furthermore, best
results can be expected with a representation of the
audio data optimized for pathology discrimination
On the other hand, and bearing in mind the
speech database design criteria, we propose the use
of other acoustic measures usually applied over
pathological voices (jitter, HNR, etc.). These
techniques could also be applied over different
linguistic and phonetic contexts, and could be fussed
to GMM approach to improve our initial
discrimination results.
ACKNOWLEDGEMENTS
The activities described in this paper were funded by
the Spanish Ministry of Science and Technology as
part of the TEC2006-13170-C02-01 project. The
authors would like to thank the volunteers at
Hospital Clínico Universitario of Málaga, Spain, and
to Guillermo Portillo who made the speech and
image data collection possible.
REFERENCES
Blouet, R., Mokbel, C., Mokbel, H., Sanchez Soto, E.,
Chollet, G., & Greige, H. (2004). BECARS: a Free
Software for Speaker Verification. In Proceedings of
The Speaker and Language Recognition Workshop,
ODYSSEY, pp 145-148.
Coccagna, G., Pollini, A., & Provini, F. (2006).
Cardiovascular disorders and obstructive sleep apnea
syndrome. In Clinical and Experimental Hypertension
Vol. 28:217–24.
Do, M. N., (2003) Fast approximation of Kullback-Leibler
distance for dependence trees and Hidden Markov
Models. IEEE Signal Processing Letter 10, 115-118.
Fernandez R., Hernández L. A., López E., Alcázar J.,
Portillo G., & Toledano D. T. (2008). Design of a
Multimodal Database for Research on Automatic
Detection of Severe Apnoea Cases. In Proceedings of
6th Language Resources and Evaluation Conference.
LREC, Marrakech.
Fiz, J.A., Morera, J., Abad, J., Belsulnces, A., Haro, M.,
Fiz, J.I., Jane, R., Caminal, P., & Rodenstein, D.
(1993). Acoustic analysis of vowel emission in
obstructive sleep apnea. In Chest Journal; 104: 1093 –
1096.
Fox, A.W., & Monoson, P.K. (1993). Speech dysfunction
of obstructive sleep apnea. A discriminant analysis of
its descriptors. In Chest Journal; 96(3): 589-595.
Fredouille, C., Pouchoulin, G., Bonastre, J.F., Azzarello,
M., Giovanni, A., & Guio, A. (2005). Application of
Automatic Speaker Recognition techniques to
pathological voice assessment (dysphonia). In
Proceeding of 9th European Conference on Speech
Communication and Technology, Interspeech 2005,
Lisboa, p. 149-152.
Glass, J. , & Zue, V. (1985). Detection of nasalized
vowels in American English. In Proceedings of
Acoustics, Speech, and Signal Processing, IEEE
International Conference on ICASSP, Volume: 10, p.
1569- 1572.
Hidalgo, A., & Quilis, M. (2002). Fonética y fonología
españolas. Editorial Tirant blanch.
Lloberes, P., Levy, G., Descals, C., et al. (2000). Self-
reported sleepiness while driving as a risk factor for
traffic accidents in patients with obstructive sleep
apnoea syndrome and in non-apnoeic snorers. In
Respiratory Medicine 94: 971–6.
Moreno, A., Poch, D., Bonafonte, A., Lleida, E., Llisterri,
J., Mariño, J.B., & Naude, C. (1993). ALBAYZIN
Speech Database: Design of the Phonetic Corpus. In
Proceedings of Eurospecch 93. Berlin, Germany, 21-
23. Vol. 1 pp. 175-178.
Parsa, V., & Jamieson, D. G. (2001). Acoustic
discrimination of pathological voice : Sustained
vowels versus continuous speech. In Journal of
Speech, Language, and Hearing Research ISSN 1092-
4388, vol. 44, no2, pp. 327-339 (1 p.1/4).
Pruthi T. (2007) Analysis, vocal-tract modeling and
automatic detection of vowel nasalization. Doctor
Thesis at the University of Maryland.
Puertas, F.J., Pin, G., María, J.M., & Durán, J. (2005).
Documento de consenso Nacional sobre el síndrome
de Apneas-hipopneas del sueño (SAHS). Grupo
Español De Sueño (GES).
Reynolds, D.A., Quatieri, T.F., & Dunn, R.B. (2000).
Speaker verification using adapted gaussian mixture
models. In Digital Signal Processing 10: 19-41.
BIOSIGNALS 2009 - International Conference on Bio-inspired Systems and Signal Processing
130
