
CHROMOSOME REGION RECOGNITION
WITH LOCAL BAND PATTERNS
Toru Abe
Cyberscience Center, Tohoku University, Sendai, Japan
Chieko Hamada
Graduate School of Information Sciences, Tohoku University, Sendai, Japan
Tetsuo Kinoshita
Cyberscience Center, Tohoku University, Sendai, Japan
Keywords:
Chromosome image analysis, Region extraction, Region classification, Local band pattern, Subregion search.
Abstract:
To make the visual examination of a chromosome image for various chromosome abnormalities, individual
chromosome regions have to be extracted from the subject image and classified into the distinct chromosome
types. To improve the accuracy and flexibility in this process, we propose a subregion (local band pattern)
based method for recognizing chromosome regions in the image. This method regards each chromosome
region as a series of subregions, and iterates a search for subregions in the image consecutively. Consequently,
chromosome region classification is performed simultaneously with its extraction for each subregion. Since the
dimensions and intensities of chromosome regions vary with every image, effective subregion searches require
templates whose dimensions and intensities correspond with those of chromosome regions in the image. To
develop an effective subregion search, we also propose a method for adjusting the dimensions of templates to
those of chromosome regions in the image and adapting the intensities in the image to those of the templates.
1 INTRODUCTION
The examination of chromosome images for various
chromosome abnormalities plays an important role in
many clinical practices, including treatment and pre-
vention of genetic disorders, radiation dosimetry, tox-
icology, etc (Carothers and Piper, 1994). To make the
visual examination of a chromosome image, individ-
ual chromosome regions have to be extracted from the
subject image and classified into the distinct chromo-
some types in advance.
To improve the accuracy and flexibility in this
process, we propose a subregion (local band pattern)
based method for recognizing individualchromosome
regions in an image. This method regards each chro-
mosome region as a series of subregions, and iterates
a search for subregions in the subject image consec-
utively. As a result, chromosome region classifica-
tion is performed simultaneously with its extraction
for each subregion. Since the dimensions and intensi-
ties of chromosome regions vary with every image, to
achieve effective subregion searches, the dimensions
and intensities of templates for subregion searches
are required to correspond with those of chromosome
regions in the subject image. To develop an effec-
tive chromosome subregion search, we also propose
a method for adjusting the dimensions (widths and
lengths) of templates to those of chromosome regions
in the image and adapting the intensities in the image
to those of the templates. Furthermore, to show the
effectiveness of the proposed method, we also present
the results of subregion search experiments on chro-
mosome images.
2 CHROMOSOME IMAGE
EXAMINATION
This section explains the general procedures for ex-
amining chromosome images and the difficulties in
those procedures.
49
Abe T., Hamada C. and Kinoshita T. (2009).
CHROMOSOME REGION RECOGNITION WITH LOCAL BAND PATTERNS.
In Proceedings of the International Conference on Bio-inspired Systems and Signal Processing, pages 49-56
DOI: 10.5220/0001534500490056
Copyright
c
SciTePress
2.1 Procedures for Examining
Every cell nucleus in a normal human being contains
46 chromosomes consisting of 44 autosomes and two
sex chromosomes. The autosomes are composed of
22 homologous pairs of chromosomes, and by con-
vention, numbered from 1 to 22. The sex chromo-
somes are referred to as X and Y. A normal human fe-
male has two X chromosomes, while a normal human
male has an X and a Y chromosome. Each chromo-
some has a narrow part, which is called a centromere,
and it divides the entire region into two parts. The
shorter part is called a short arm and the longer part is
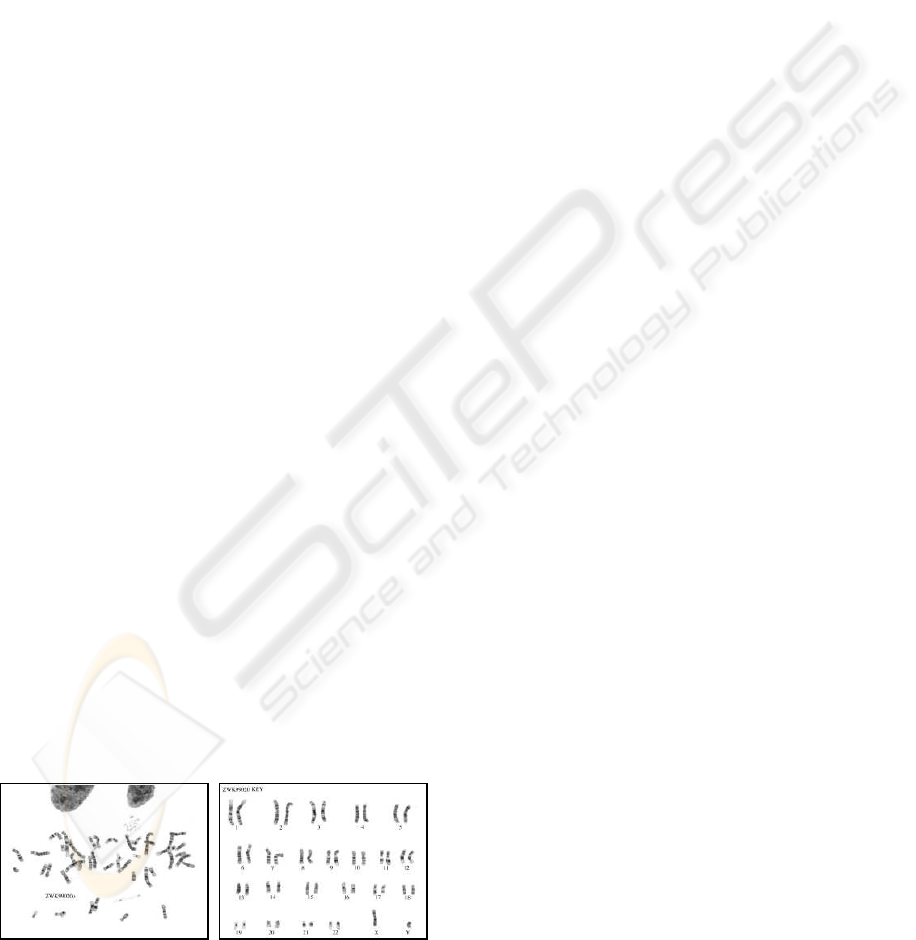
called a long arm. With proper staining methods, such
as Giemsa staining (G-staining) method, a character-
istic series of light and dark bands appears along the
longitudinal axis of a chromosome (Figure 1 (a)). The
band appearance on a chromosome is called a band
pattern, and it is unique to each type of chromosome.
Usually the examination of a chromosome image
requires the following procedures (Graham and Piper,
1994):
1. Staining a set of chromosomes and capturing its
image.
2. Extracting individual chromosome regions from
the image.
3. Classifying the chromosome regions into the 24
types (1, 2, ..., 22, X, and Y).
4. Inspecting the region appearances for chromo-
some abnormalities.
To make the visual examination of a chromosome
image, individual chromosome regions are extracted
from the subject image, and the extracted regions
are classified into the 24 distinct chromosome types
(Figure 1 (b)). The dimensions of a chromosome
change with the stage in a cell division, and the inten-
sities of it change with staining conditions, therefore
the dimensions and intensities of a chromosome re-
gion vary with every image. Meanwhile, the relative
length, the relative centromere position, and the band
(a) (b)
Figure 1: (a) chromosome image, (b) classification re-
sult (ZooWeb, 2003).
pattern of each chromosome type vary little with ev-
ery image. For this reason, the latter features are used
for the classification (Harnden and Klinger, 1985).
According to the classification result, abnormal-
ities of number, where there are one or more entire
chromosomes additional to or missing from the nor-
mal complement, can be detected. From the region
appearances (the band pattern on each chromosome
region), abnormalities of structure, where part of the
bands are lost (deletion), repeated (duplication), or
shifted (translocation), can be examined visually.
2.2 Difficulties in Examining
The existing methods perform chromosome region
extractions apart from chromosome region classifica-
tions, and their classification procedures suppose that
individual chromosome regions are extracted accu-
rately from a subject image beforehand (Groen et al.,
1989; Wu et al., 2005). However, chromosome re-
gions in the image frequently touch or overlap each
other, and have some parts difficult to distinguish
them from the background. Consequently, the ac-
curate extraction of individual chromosome regions
from the image is not an easy procedure.
Although extracted regions can be classified into
several chromosome groups according to the relative
lengths and the relative centromere positions of them,
to discriminate between all 24 chromosome types,
the use of band patterns is required in the classifi-
cation. The classification methods using band pat-
terns are generally categorized into two approaches:
one is a global approach, and the other is a local
approach (Graham and Piper, 1994; Carothers and
Piper, 1994; Wu et al., 2005). In the global approach,
the band pattern on an entire region (the longitudi-
nal profile of intensity in an extracted region) is de-
termined, and a chromosome type is assigned to the
region by comparing its band pattern with reference
band patterns (Piper and Granum, 1989; Wu et al.,
2005). Therefore, when aberrant bands appear partly
on a region because of various reasons (region extrac-
tion failure, region overlap, chromosome abnormali-
ties, etc.), it is difficult to assign a chromosome type
correctly. In the local approach, local features such
as particular bands are determined in a region, and
they are used for the classification. This approach
can partially reduce the aberrant band influence on
the classification accuracy (Groen et al., 1989; Gra-
ham and Piper, 1994; Moradi and Setarehdan, 2006).
However, it is reported that the local approaches are
inferior to the global approaches in the classification
accuracy (Wu et al., 2005). The conceivable reasons
for that are as follows:
BIOSIGNALS 2009 - International Conference on Bio-inspired Systems and Signal Processing
50
• It is difficult to determine local features accurately
in a chromosome region.
• Compared to the global approaches, the local ap-
proaches use fewer features for the classification.
3 CHROMOSOME REGION
RECOGNITION WITH LOCAL
BAND PATTERNS
To overcome the problems in the existing methods,
we propose a subregion based method for recogniz-
ing individual chromosome regions in an image. This
method regards each chromosome region as a series
of subregions, and iterates a search for subregions in
the subject image consecutively.
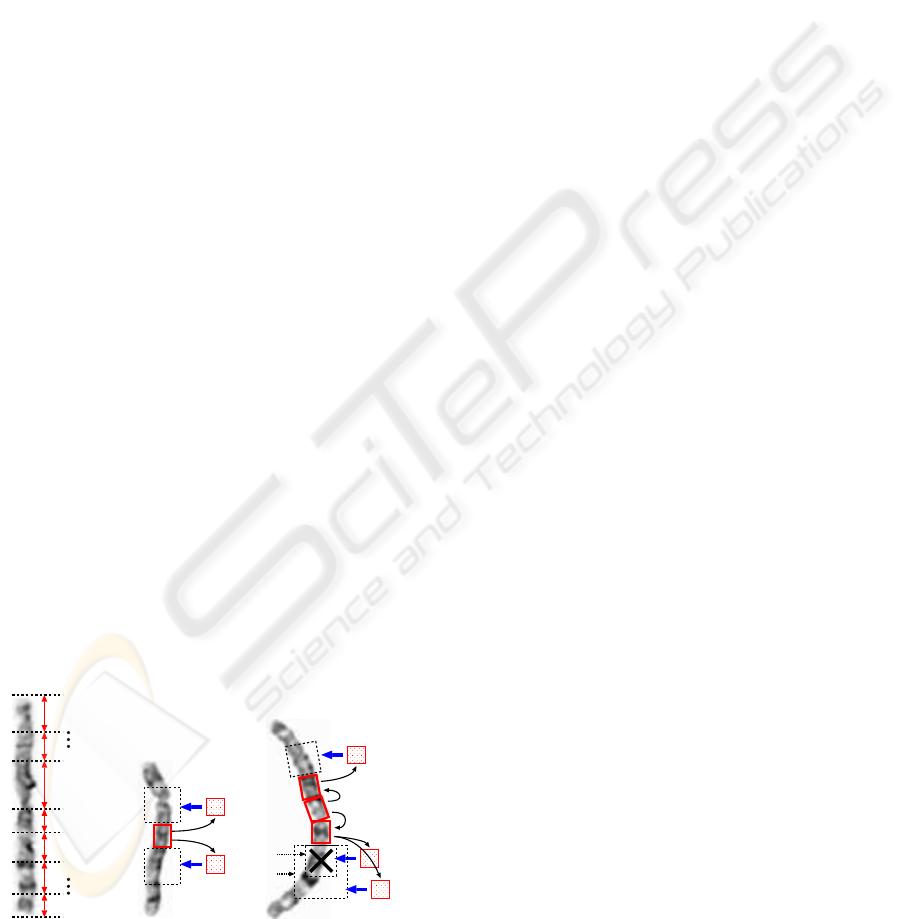
In the method, a reference band pattern is prepared
for every chromosome type. Each reference band pat-
tern for an entire chromosome region is divided into
several parts, and they are used as the templates for
extracting and classifying the chromosome region. In
the following, the divided parts are referred to as lo-
cal band patters, and the m th local band pattern on the
chromosome type i is denoted by lbp
(i)
m
(Figure 2 (a)).
Firstly, the subject image is searched for the subre-
gion corresponding to a local band pattern (template).
If a subregion corresponding to lbp
(i)
m
is detected, sec-
ondly, the neighborhood of the detected subregion is
searched for the next subregion corresponding to the
adjacent lbp
(i)
m−1
or lbp
(i)
m+1
(Figure 2 (b)). By iterat-
ing the search for subregion consecutively, with the
first detected subregion as the starting point, one sub-
region after another is detected, and the entire region
of a chromosome is determined in the image.
When a subregion corresponding to lbp
( j)
n+1
is de-
lbp
(i)
m
lbp
(i)
m+1
lbp
(i)
m−1
reference band pattern on chromosome i
local band patterns
(a)
lbp
(i)
m
lbp
(i)
m+1
lbp
(i)
m−1
(b)
lbp
(j)
n
lbp
(j)
n+2
lbp
(j)
n−2
lbp
(j)
n+1
lbp
(j)
n−1
lbp
(j)
n+3
NH1
NH2
(c)
Figure 2: (a) local band patterns, (b) extraction and classifi-
cation with local band patterns, (c) control of template and
search area.
tected and lbp
( j)
n+2
cannot be found in the neighbor-
hood NH1, it is surmised that the aberrations (chro-
mosome region overlaps, chromosome abnormalities,
etc.) occur in NH1 (Figure 2 (c)). To deal with this
difficulty and complete the search for the entire chro-
mosome region, if the adjacent local band pattern can-
not be found in the neighborhood, the template and
search area are changed. For example, in Figure 2 (c),
the template is changed from lbp
( j)
n+2
to lbp
( j)
n+3
, and
the search area is extended from NH1 to NH2.
By taking these approaches, the following advan-
tages are expected in this method:
• As the consecutive search for a subregion, simul-
taneously with the extraction, the classification is
performed on part of a chromosome region, and
the results of preceding searches are utilized for
the following searches.
• By controlling the template and search area, the
consecutive searches integrate features in the sub-
regions while reducing aberrant band influence.
4 ADJUSTING TEMPLATE
DIMENSIONS AND ADAPTING
SUBJECT IMAGE INTENSITIES
A subregion search is made by scanning a subject
image with a template and seeking in the image for
subregions where the mean-squared-error (MSE) to
the template are sufficiently small. To achieve ef-
fective subregion searches, the dimensions and inten-
sities of templates are required to correspond with
those of chromosome regions in the image. This sec-
tion presents a methodfor adjusting the dimensions of
templates to those of chromosome regions in the im-
age and adapting the intensities in the image to those
of the templates.
4.1 Adjusting Template Dimensions
While the dimensions of chromosome regions vary
with every image, the relative length of each chro-
mosome type varies little from one image to another
and the widths of chromosome regions are similar in
each image. The proposed method binarizes an im-
age by the intensities of pixels, and then determines
the width W of chromosome regions and the sum of
chromosome region lengths (total length L) in the bi-
narized image. The determined W and L are used for
adjusting the dimensions of templates.
Let p
c
and p
b
represent pixels corresponding to
the chromosome regions and the background in the
CHROMOSOME REGION RECOGNITION WITH LOCAL BAND PATTERNS
51

d
2
d
1
d
0
d
7
0
1
2
3
4
5
6
7
π/4
p
c
chromosome
region
(a)
θ
t
p
c
d
2
d
0
w
t
= w
t
’
(b)
p
c
w
t
w’
t
d
2
d
0
θ
t
(c)
Figure 3: Region width at boundary p
c
.
binarized image, respectively. To determine W, as
shown in Figure 3 (a), from every p
c
bordered on
the background, the Euclidean distances d
t
to the
other boundary are measured in eight directions (t =
0,1,... ,7). With d
t
and d
t+2
, the estimated width w
t
and its direction θ
t
are calculated at p
c
by
w
t
= d
t
× d
t+2
q
d
2
t
+ d
2
t+2
, (1)
θ
t
= tan
−1
(d
t
/d
t+2
) + t × π/4, (2)
where d
8
= d
0
and d
9
= d
1
. For calculating stabil-
ity, d
t
and d
t+2
greater than a threshold Td are used
for computing (1) and (2). In addition to w
t
, from p
c
to the other boundary in the direction θ
t
, the actual
measurement w
′
t
is taken. As shown in Figure 3 (b),
where both boundaries are straight and parallel to
each other, w
t
and w
′
t
are both equal to the true width
of the chromosomeregion. However, as shown in Fig-
ure 3 (c), where boundaries curve or they aren’t par-
allel to each other, w
t
and w
′
t
are different and they
may differ from the true width. Therefore, the pro-
posed method accepts w
′
t
as the reliable width at p
c
only when e
t
= |w
t
− w
′
t
| is less than a threshold Te.
If more than one reliable w
′
t
is accepted at a pixel p
c
,
the width w
′
t
with the smallest e
t
is chosen as the re-
gion width at p
c
. By choosing w
′
t
at each p
r
bordered
on the background and counting the occurrence fre-
quency for every value of chosen w
′
t
, the most fre-
quently occurred value is determined as the width W
of chromosome regions in the image. Thus, by choos-
ing reliable w
′
t
and using them for counting the occur-
rence frequency, the proposed method can determine
the chromosome region width W stably.
The sum of chromosome region areas in the im-
age can be estimated as the total number S of pix-
els p
c
in its binarized image, and it is approximated
by the product of the region width W and the to-
tal region length L. Therefore, L can be determined
by L = S/W. Suppose that templates for subregion
searches are made from an reference image I
R
, and
let I
S
represent the subject image. In the proposed
method, to adjust the dimensions of templates:
• the width and total length of chromosome regions
x
y
subject image: I
S
0
template: T
V
U
v
u
0
θ
(x, y)
(a)
overlap with p
c
(chromosome
regions)
chromosome
region
template
O
b
O
c
overlap with p
b
(background)
(b)
Figure 4: Subregion search with a template.
are determined in both I
R
and I
S
(they are denoted
by W
R
, L
R
, W
S
, and L
S
, respectively),
• the width of the templates are set to W
S
, and the
length of each template is multiplied by L
S
/L
R
.
4.2 Adapting Subject Image Intensities
Let I
S
(x,y) and T(u, v) represent the intensities at
(x,y) in the subject image and at (u,v) in the tem-
plate, respectively. As shown in Figure 4 (a), when
the template is set at (x,y) and rotated by θ in the sub-
ject image, the MSE e
2
at (x,y) is computed by
e
2
(x,y) =
1
UV
U−1
∑
u=0
V−1
∑
v=0
I
S
(x
′
,y
′
) − T(u,v)
2
, (3)
x
′
= x+ ucosθ− vsinθ, (4)
y
′
= y+ usinθ + vcosθ, (5)
where U and V are the width and length of the tem-
plate, respectively. The rotation angle θ is set to mini-
mize e
2
(x,y). The intensities of chromosome regions
change with every image, and they vary locally in an
image according to staining conditions. To achieve
effective subregion searches, the proposed method
adapts the intensities in the subject image so that the
MSE e
2
(x,y) to the template is reduced, and then uses
the adapted MSE ˜e
2
(x,y) for the subregion search.
As shown in Figure 4 (b), the region of a template
set in the subject image consists of two parts: one
part O
b
overlaps with the background, and the other
part O
c
overlaps with the chromosome regions in the
image. O
b
and O
c
can be determined from the pix-
els corresponding to the background p
b
and chromo-
some regions p
c
in the binarized subject image. The
adapted MSE ˜e
2
at (x,y) is determined by
˜e
2
(x,y) =
1
UV
˜
E
2
b
(x,y) +
˜
E
2
c
(x,y)
, (6)
˜
E
2
b
(x,y) =
∑
(u,v)∈O
b
I
S
(x
′
,y
′
) − T(u,v)
2
, (7)
˜
E
2
c
(x,y) =
∑
(u,v)∈O
c
αI
S
(x
′
,y
′
) + β − T(u,v)
2
, (8)
BIOSIGNALS 2009 - International Conference on Bio-inspired Systems and Signal Processing
52
where the sums of squared-error
˜
E
2
b
(x,y) and
˜
E
2
c
(x,y)
are computed in O
b
and O
c
, respectively. The in-
tensities are similar almost everywhere in the back-
ground, and it is necessary that
˜
E
2
b
(x,y) is supplied
to ˜e
2
(x,y) as a penalty. Accordingly,
˜
E
2
b
(x,y) is com-
puted from raw intensities I
S
(x
′
,y
′
) in the subject im-
age, although
˜
E
2
c
(x,y) is computed from adapted in-
tensities αI
S
(x
′
,y
′
) + β. For every subregion, con-
stants α and β are set to minimize
˜
E
2
c
(x,y), and they
are determined by
α =
|O
c
|
∑
(u,v)∈O
c
I
S
(x
′
,y
′
)T(u,v)
−
∑
(u,v)∈O
c
I
S
(x
′
,y
′
)
∑
(u,v)∈O
c
T(u, v)
|O
c
|
∑
(u,v)∈O
c
I
2
S
(x
′
,y
′
) −
∑
(u,v)∈O
c
I
S
(x
′
,y
′
)
!
2
,
(9)
β =
1
|O
c
|
∑
(u,v)∈O
c
T(u,v) − a
∑
(u,v)∈O
c
I
S
(x
′
,y
′
)
!
,
(10)
where |O
c
| is the number of pixels in O
c
. If α not ex-
ceeding 0 is determined for any subregion, such sub-
region is excluded from the subregion search because
the band pattern of it is reverse to that of the template.
5 EXPERIMENTS
To demonstrate the effectiveness of the proposed
method for adjusting template dimensions and adapt-
ing subject image intensities, we have carried out sub-
region search experiments on chromosome images.
5.1 Chromosome Images
Experiments were carried out on the chromosome
images that are opened to public by the website
of the Wisconsin State Laboratory of Hygiene and
ZooWeb (ZooWeb, 2003). This site provides not only
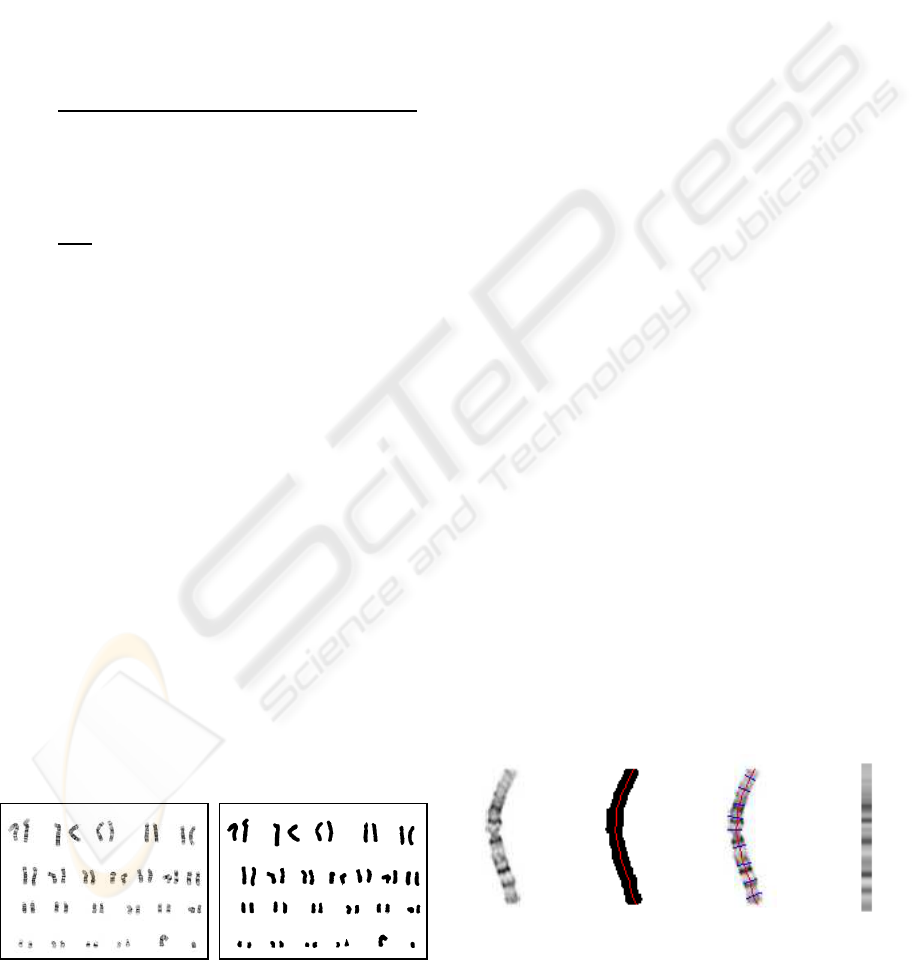
(a) (b)
Figure 5: (a) classification result, (b) binarized image.
original chromosome images but also their classifica-
tion results. Examples of the original chromosome
image and its classification result are shown in Fig-
ure 1. Although the proposed method can be applied
to the original chromosome images, it is difficult to
evaluate the subregion search results in them. There-
fore, the experiments were conducted on the classifi-
cation results, where every chromosome region was
extracted, classified, and arranged in standard order.
Figure 5 (a) and (b) show examples of the clas-
sification result and its binarized image. Thirty-one
classification results were used in the experiments.
They consist of 19 female and 12 male chromosome
images. This set includes 9 normal chromosome im-
ages (46 chromosomes in each image) and 22 numer-
ical abnormal chromosome images (2 images with 45
chromosomes and 20 images with 47 chromosomes).
Each image is 768×576 pixels in size, and charac-
ters in it are removed beforehand. To conduct cross-
validation, the images were divided into two sets A
(16 images) and B (15 images) (when one set was
used as subject images, the other set was used as ref-
erence images and employed for making templates).
5.2 Templates
To make templates for subregion searches, firstly,
chromosome regions were extracted from the refer-
ence images in a chosen set, and the intensity profile
was acquired in each extracted region. Secondary, for
each chromosome type, the average intensity profile
was made from the acquired profiles, and it was used
as the reference band pattern. Finally, templates were
made by dividing the reference band patterns.
As shown in Figure 6 (a) and (b), to acquire the
intensity profile in a chromosome region, the medial
axis is determined in each extracted region. On the
determined medial axis, average intensities are taken
perpendicularly to the medial axis (Figure 6 (c)), and
they are used as an intensity profile (Figure 6 (d)).
For each chromosome type i, intensity profiles
(a) (b) (c) (d)
Figure 6: (a) chromosome region, (b) extracted region and
medial axis, (c) average intensities perpendicularly to the
medial axis, (d) intensity profile of the chromosome region.
CHROMOSOME REGION RECOGNITION WITH LOCAL BAND PATTERNS
53
chromosome type 1
lbp
(1)
chromosome type 2
lbp
(2)
chromosome type 3
lbp
(3)
chromosome type 4
lbp
(4)
chromosome type 5
lbp
(5)
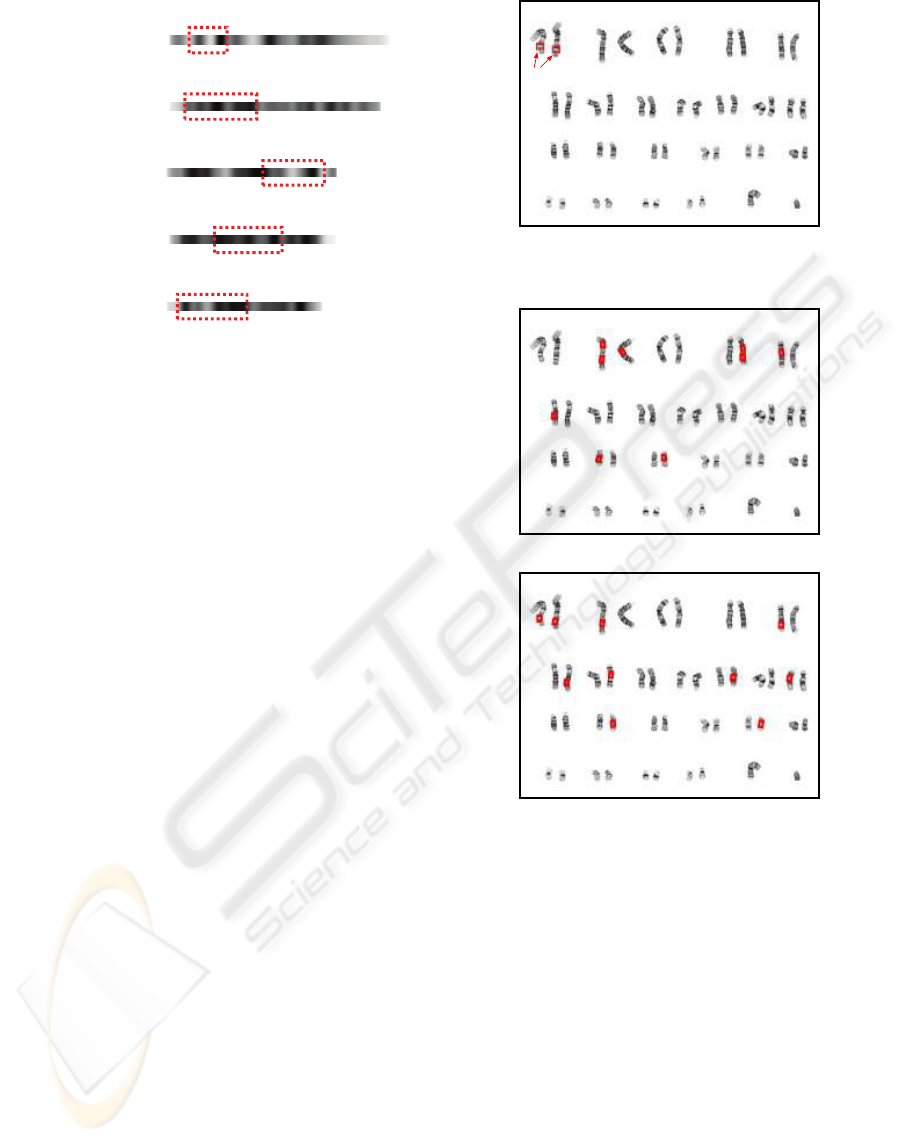
Figure 7: Examples of templates used in the experiments.
P
(i)
k
(k = 1,2,. .., K
(i)
) are made. Since region ex-
traction and medial axis determination may fail for
some chromosome regions, the number K
(i)
of in-
tensity profiles differs depending on the chromosome
type i. In each i, the longest profile P
(i)∗
= P
(i)
l
is
determined, the lengths of other profiles P
(i)
k
(k 6= l)
are extended to that of P
(i)∗
, and the average profile is
made from all P
(i)
k
. The average profile is used as a
reference band pattern of chromosome type i.
By dividing the reference band patterns into local
band patterns (lbp), templates for subregion searches
are made. To adjust the dimensions of a template for
the chromosome type i, the width W
R
and the total
length L
R
of chromosome regions are determined in
the reference image where P
(i)∗
is acquired. Figure 7
shows examples of the templates made from set A and
used in the experiments. In the experiments:
• For the chromosome types 1, 2, ..., 5, a single
template was made each in every set.
• Thresholds were set as Td = 3pixels and Te =
2pixels in estimating W
R
.
• The mean and variance of intensity in each tem-
plate were set to 100 and 50
2
, respectively.
5.3 Experimental Results
The following four type methods of searching subre-
gion were applied the subject images:
SRS1 without adjusting template dimensions and
without adapting subject image intensities,
SRS2 without adjusting template dimensions and
with adapting subject image intensities,
SRS3 with adjusting template dimensions and
without adapting subject image intensities,
C
Figure 8: Examples of the correct subregions in a subject
image.
1
2
3
4
5
6
7
8
9
10
(a)
2
3
4
5
6
7
8
9
10
1
(b)
Figure 9: Examples of the subregion search results: (a) with
SRS1, (b) with SRS4.
SRS4 (the proposed method)
with adjusting template dimensions and
with adapting subject image intensities.
To evaluate their results, precision P and recall R were
used. They are defined by
P = |D∩C|/|D|, (11)
R = |D∩C|/|C|, (12)
where D is a set of detected subregions and C is a
set of correct subregions (subregions corresponding
to a template) in an subject image. |D| and |C| denote
the number of subregions in D and C, respectively. P
and R were computed for each subject image, and the
averages of them were calculated for each method.
BIOSIGNALS 2009 - International Conference on Bio-inspired Systems and Signal Processing
54
0.6
0.8
1.0
a
ll (R)
SRS1
SRS2
SRS3
SRS4 (proposed method)
0.0
0.2
0.4
0 100 200 300 400 500 600 700 800 900 1000
rec
a
MSE
Figure 10: The average R at different thresholds of MSE.
0.6
0.8
1.0
a
ll (R)
0.0
0.2
0.4
0 20 40 60 80 100 120 140 160 180 200
rec
a
order
SRS1
SRS2
SRS3
SRS4 (proposed method)
Figure 11: The average R at different thresholds of order.
In the experiments, detected subregions D for a
template were defined as follows:
• subregions in a subject image are sorted by their
MSEs to the template in ascending order,
• if the MSE or the order of a subregion is less than
or within a specified threshold, this region is de-
cided as ‘detected.’
For each template, the correct subregions C were set
manually in every subject image (Figure 8).
Figure 9 (a) and (b) show examples of the subre-
gion search results with SRS1 and SRS4, respectively.
The numbers on the figures denote the order of each
subregion. These results were obtained by using the
same template whose correct subregions correspond
to those on Figure 8.
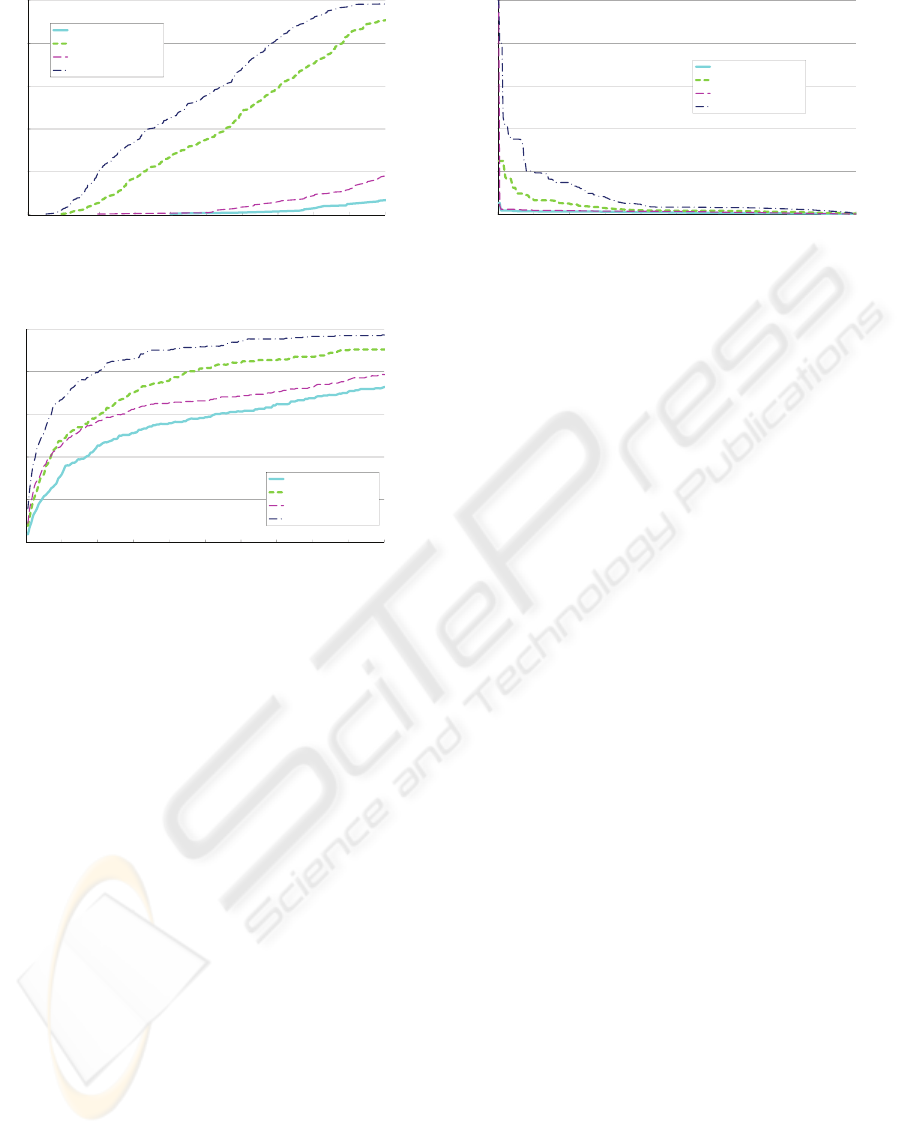
The averages of P and R were computed by vary-
ing the specified thresholds. Figure 10 shows the av-
erage R for all methods (SRS1, 2, 3, 4) at different
thresholds of MSE, and Figure 11 shows the average
R at different thresholds of order. Figure 12 shows P
at different R, where R was changed by varying the
threshold of MSE.
These results show that adjusting the dimensions
of templates and adapting the intensities in a subject
image improve the accuracy (precision and recall) in
0.6
0.8
1.0
c
ision (P)
SRS1
SRS2
SRS3
SRS4 ( d th d)
0.0
0.2
0.4
0.0 0.1 0.2 0.3 0.4 0.5 0.6 0.7 0.8 0.9 1.0
pre
c
recall (R)
SRS4
(
propose
d
me
th
o
d)
Figure 12: The average P at different the average R.
subregion searches, especially the proposed method,
which uses both the approaches, improves the accu-
racy considerably. Consequently, it is expected that
the proposed method can achieve subregion searches
effectively.
6 CONCLUSIONS
In this paper, to improve the accuracy and flexibility
in this process, we have proposed a local band pattern
based method for recognizing individual chromosome
regions in an image, and to develop an efficient chro-
mosome subregion search, we also have proposed the
method for making the dimensions and intensities of
templates correspond with those of chromosome re-
gions in a subject image. By adjusting the dimen-
sions of the templates to those of chromosome regions
in the subject image and adapting the intensities in
the subject image to those of the templates, the pro-
posed method can improve the accuracy in subregion
searches.
To achieve an effective recognition of individual
chromosome regions in the subject image, we plan to
develop following methods:
• A method for determining effective subregion
search templates in each reference band pattern.
• A method for extracting and classifying a chro-
mosome regions in the subject image efficiently.
• A method for recognizing a complement of chro-
mosome regions in the subject image effectively.
REFERENCES
Carothers, A. and Piper, J. (1994). Computer-aided classi-
fication of human chromosomes: a review. Statistics
Computing, 4:161–171.
Graham, J. and Piper, J. (1994). Automatic karyotype anal-
ysis. Meth. Mol. Biol., 29:141–185.
CHROMOSOME REGION RECOGNITION WITH LOCAL BAND PATTERNS
55

Groen, F. C. A., ten Kate, T. K., Smeulders, A. W. M., and
Young, I. T. (1989). Human chromosome classifica-
tion based on local band descriptors. Pattern Recognit.
Lett., 9:211–222.
Harnden, D. G. and Klinger, H. P., editors (1985).
ISCN1985: An international system for human cyto-
genetic nomenclature (1985). S. Karger AG.
Moradi, M. and Setarehdan, S. K. (2006). New features
for automatic classification of human chromosomes:
a feasibility study. Pattern Recognit. Lett., 27:19–28.
Piper, J. and Granum, E. (1989). On fully automatic feature
measurement for banded chromosome classification.
Cytometry, 10:242–255.
Wu, Q., Liu, Z., Chen, T., Xiong, Z., and Castleman, K. R.
(2005). Subspace-based prototyping and classification
of chromosome images. IEEE Trans. Pattern Anal.
Machine Intell., 14:1277–1287.
ZooWeb (2003). — Karyotypes home page. http://worms.
zoology.wisc.edu/zooweb/Phelps/karyotype.html.
BIOSIGNALS 2009 - International Conference on Bio-inspired Systems and Signal Processing
56
