
MICROCOMPUTERIZED SYSTEM TO ASSESS THE
PERFORMANCE OF LUNG VENTILATORS
Daniel Marinho Silva
Biomedical Engineering Institute, Federal University of Santa Catarina, 88040 – 900, Florianópolis, SC, Brazil
Maurício Campelo Tavares
Biomedical Engineering Laboratory, Catholic University of Pelotas, campus I, 96010-000, Pelotas, RS, Brazil
Raimes Moraes
Electrical Engineering Department, Federal University of Santa Catarina, 88040 – 900, Florianópolis, SC, Brazil
Keywords: IEC 60601-2-12, NBR 13763, Bluetooth, Clinical engineering, Maintenance.
Abstract: Lung ventilators may harm patients if they are not properly calibrated. Therefore, they must be periodically
assessed to verify if the supplied volume and pressure match the ventilatory settings. This paper presents a
system based on a microcomputer to assess the performance of lung ventilators. The hardware of the
developed system contains three modules: transducer, conditioning and acquisition. The transducer module
converts, to electrical signals, the pressure and flow waveforms supplied to a lung simulator by a lung
ventilator. It also supplies digital measurements of temperature and relative humidity (RH). The
conditioning module amplifies and filters the pressure and flow signals. The acquisition module reads the
digital measurements (temperature and RH) and carries out the analog to digital conversion of the
conditioning module outputs, sending these data to the microcomputer via radio-frequency. Software
written in C++ shows the acquired waveforms on the PC screen and calculates the parameters required by
the IEC 60601-2-12. Data on the lung ventilator model, the sampled waveforms and the calculated
parameters are stored in a database, allowing the equipment follow-up. Comparative result of tests carried
out with the developed system and with commercial equipment is presented.
1 INTRODUCTION
Lung ventilators (LVs) supply air to patients that are
unable to breathe spontaneously, for instance, due to
chronic obstructive pulmonary disease, acute lung
injury, anesthesia or neurological disorder.
Therefore, they are widely used in intensive therapy
units (Pierce, 1995).
The LVs are built according to the IEC 60601-2-
12 that establishes the requirements needed to
minimize patients and operator risks (International
Electrotechnical Commission, 2001).
Since the LVs are used in critical clinical
situations, they must be periodically assessed to
verify if their performances were not degraded over
time, that is, if the supplied values match the
ventilatory settings on the LV. Besides, lungs may
be harmed by high airway pressure and high tidal
volume (Ricard et al., 2003; Wrigge et al., 2004;
Fernández-Pérez et al., 2006).
Therefore, it is very important to implement a
quality control program for LVs in order to avoid
patient injury.
Nevertheless, quality control programs in
developing countries are hampered by the high cost
of performance analyzers. Very often, heavy taxes
make the importation of these analyzers prohibitive,
preventing proper maintenance.
This work describes a lower cost LV analyzer
based on a PC microcomputer. It consists of an
electronic device to sample pressure, flow,
temperature and humidity. The sampled data are
sent, via radio-frequency, to a computer where the
waveforms are shown in real time. Parameters to
161
Marinho Silva D., Campelo Tavares M. and Moraes R. (2009).
MICROCOMPUTERIZED SYSTEM TO ASSESS THE PERFORMANCE OF LUNG VENTILATORS.
In Proceedings of the International Conference on Biomedical Electronics and Devices, pages 161-166
DOI: 10.5220/0001432101610166
Copyright
c
SciTePress
evaluate the LV are calculated. All data are stored in
a database.
2 MATERIALS AND METHODS
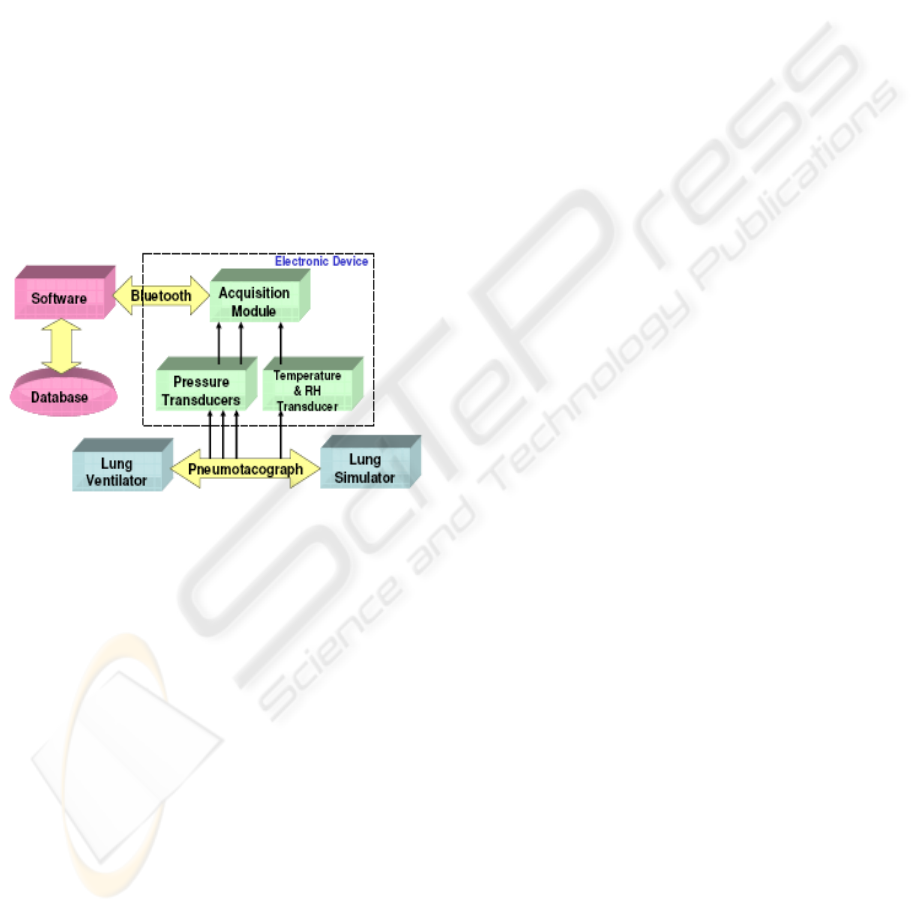
The Figure 1 depicts a block diagram of the
developed system and shows how it is connected to
the LV and lung simulator (LS). The LS acts as a
physiological load (resistance and compliance) for
the LV under assessment.
The developed system consists of an electronic
device that periodically measures the temperature
and relative humidity (RH) of the air inside the duct
that connects the LV to the LS as well as the flow
and the pressure waveforms generated by the LV.
The acquired data are sent to a PC microcomputer
via radio frequency (RF). The PC shows the sampled
data on the screen as well as parameters required by
the IEC 60601-2-12.
Figure 1: Block diagram of the system developed to assess
LV performance. It also shows how the system is
connected to the LV and LS.
The next sections describe each block of the
developed system.
2.1 Transducer Module
The transducer used to measure temperature and
relative humidity (RH) is the SHT75 (Sensirion Inc,
2007). It measures temperature from -40 to 123.8°C
(accuracy: ±0.5°C; resolution: 0.01°C) and RH from
0 to 100%RH (accuracy: ±1.8%RH; resolution:
0.03%RH). These transducers have a calibration
certificate issued by the manufacturer.
Due to its small size (0.42 x 4.88 x 2.5 mm), it is
possible to insert the transducer into the air duct that
connects the LV to the LS.
The SHT75 yields the measurements in digital
format (14 bits) via a 2-wire protocol. This is a
bidirectional protocol that allows the sensor to
receive data such as commands to carry out the
measurements.
Before connecting the LV to the LS, the sensor is
exposed to the environment, allowing the system to
register the local temperature and RH.
To sample the flow and pressure produced by the
LV, two DC030NDC4 pressure transducers are used
(Honeywell Inc., 2008). The DC030NDC4 measures
the differential pressure applied to its inputs in a
range of ±76.2cmH
2
O. It has a sensitivity of
52.36mV/cmH
2
O, producing a voltage output of
2.25V ± 2.0V.
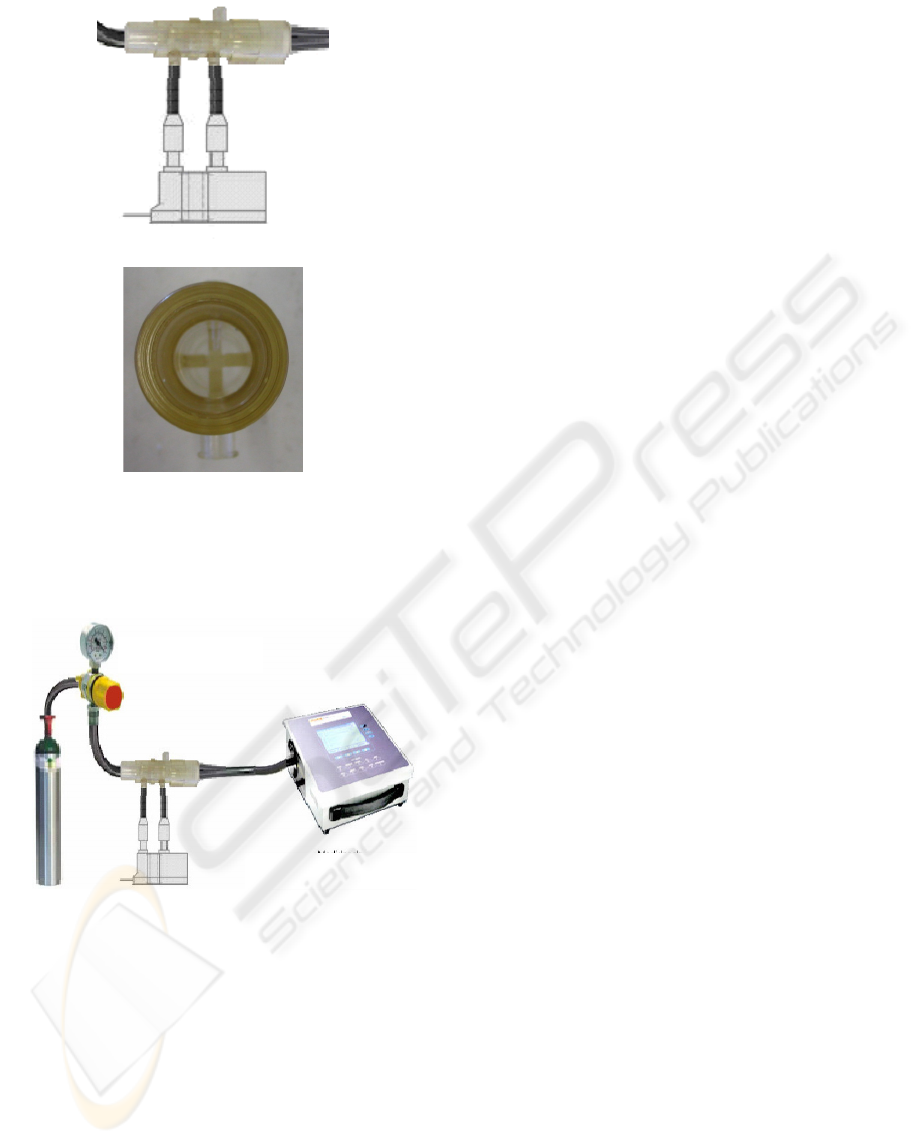
An acrylic apparatus containing an obstacle is
placed between the LV and LS to create resistance to
the gas flow (pneumotacograph - PT). The pressure
drop across the resistance, measured by one of the
transducers, is proportional to the flow velocity
(Doeblin, 1990). The Figure 2 shows how the
transducer inputs are connected to the PT apertures
as well as a front view of the flow resistance. The
pressure drop is positive for inspiratory flow and
negative for expiratory flow.
To relate the A/D converter voltage input (that is,
the amplified and filtered differential pressure
transducer voltage output) to flow, 40 different flow
rates (20 positive and 20 negative) were applied to
the PT and to a calibrated flow meter (Fluke
Biomedical VT-Plus; uncertainty of ±1,1l/min for
the -70 to +70l/min range). They were connected in
series to allow the comparison of their
measurements. An illustration of the experimental
setup is shown in Figure 3. A polynomial of seventh
order was fitted to the experimental points (voltage
input versus flow rate measured by the calibrated
meter) to allow inferring measures for flow rates not
evaluated. Using the polynomial, the flow
measurements obtained with the developed system
have an uncertainty of ±4.4l/min.
The second transducer, connected to a third
aperture of the acrylic device, measures the
difference between the atmospheric pressure and the
one within the air duct.
To calibrate this transducer, 35 pressure values
(from 0 to 37.1cmH
2
O) were applied to the
transducer and, in parallel, to a calibrated meter
(Fluke Biomedical BP-Pump 2; uncertainty:
±0.2cmH
2
O for a range from 0 to 120cmH
2
O). The
conditioned voltage output of the transducer (as
supplied to an A/D input) and the pressure readings
obtained from the calibrated meter were annotated.
From these values, a first order polynomial
between voltage and pressure was obtained.
BIODEVICES 2009 - International Conference on Biomedical Electronics and Devices
162
(a)
(b)
Figure 2: Diagram that shows how the pressure transducer
is connected to sample the flow waveform (a). Below (b),
there is a front view of the air resistance that provides a
pressure drop proportional to the flow velocity.
Figure 3: Experimental setup to calibrate the flow
measurements obtained with the developed system.
2.2 Conditioning Module
The electrical outputs of the pressure transducers
require further processing before being sampled.
Both signals are applied to second order Butterworth
low pass filters that have cut-off frequencies of
40Hz. For the expected ranges (pressure: 0 to
40cmH
2
O; flow: −70 to +70l/min), the output
amplitudes are adjusted to the input range of the
acquisition module (0 to 2.5V). For that, they are
amplified and shifted to positive values. The
achieved resolution is 50.0mV·(cmH
2
O)
−1
for the
pressure and 17.9mV·(l/min)
−1
for the flow.
2.3 Acquisition Module
A microcontroller (ADuC841, Analog Devices,
2003) samples the flow, pressure, temperature and
RH. The ADuC841 is an optimized single-cycle 20
MHz 8052 core that has an 8-channel analog input
multiplexer that feeds a 420 kSPS 12-bit ADC.
In this development, the ADuC841 timer is
programmed to sample the flow and pressure
waveforms at 160SPS.
For each set of 480 flow and pressure samples
acquired (3s), the microcontroller gets
measurements of temperature and RH from the
SHT75.
Since cables could cause difficulties for the
equipment handling, the sampled data are sent to the
computer via RF. For that, Bluetooth protocol was
chosen since it operates on the ISM band and does
not produce interferences in medical equipment
(Jones and Conway, 2005; Wallin and Wajntraub,
2004). The Bluetooth module employed is the KC-
21 (KCwirefree, 2007), configured for a 115.2kbps
transmission rate. The ADuC841 communicates
with the KC-21 via its serial interface. A transceiver
(SN74LVC1T45, Texas Instruments) was used to
convert the ADuC841 TTL levels to the low voltage
logic (3.3V) used in the KC-21 bus.
2.4 PC Software
The software, developed in C++ for Windows®,
receives data from the electronic device described
above and calculates parameters that are stored in a
database.
The communication between the PC and the
device is established by means of another Bluetooth
module (KC-210) inserted into a USB port
(Kcwirefree, 2006).
When the user starts the program, a form is
launched to be filled up with data on the LV
(manufacturer, serial number, model and others).
This form also receives information on the
environment under which the test is being performed
(temperature, RH, atmospheric pressure, measured
power supply) as well as on the qualitative
assessment of the equipment (maintenance condition
of power cord, switches, alarms and others).
All inserted data is stored into an open source
relational database system (PostgreSQL -
http://www.postgresql.org/) that has native
programming interfaces for C++.
Pneumotachograp
Calibrated
Regulating Valve
Gas Source Pressure
MICROCOMPUTERIZED SYSTEM TO ASSESS THE PERFORMANCE OF LUNG VENTILATORS
163

The database implemented has two tables: one to
keep the information on the LV assessed and another
to store the test data.
Using two tables, different tests carried out with
the same LV can be stored on the database without
the need of reinserting data for each test performed.
By gathering the data on a same database, the
operator can promptly identify any performance
change since the previous results are available.
After registering the equipment in the database, it
is necessary to click on a button to proceed to the
next form page where the LV operating settings are
typed. This second form also requires information
on the range and resolution of the meters available in
the LV control panel.
Another button is shown that, when clicked on,
sends a command to the acquisition module to start
the data sampling.
The software was developed according to the test
procedure adopted by this laboratory (Tolotti, 2004).
The LV is switched on to work in volume cycled
mode during 40 minutes. After that, three set of
measurements carried out at intervals of 5 minutes
are recorded.
From the received flow waveform, the software
computes the volume supplied to the LS. Three
curves (pressure, flow and volume) are shown on the
screen in real time while temperature and RH
measurements are updated at 3s intervals. To
accomplish that, the software employs the graphic
library Graphics32 that provides fast operations with
pixels and graphic primitives
(http://www.graphics32.org/).
At the end of each respiratory cycle, the software
calculates the following indexes: breathing
frequency (BF), inspiratory time (IT), expiratory
time (ET), inspiratory/expiratory ratio (IER), peak
inspiratory pressure (PIP), positive end-expiratory
pressure
(PEEP), mean airway pressure (MAP), peak
inspiratory flow (PIF), peak expiratory flow (PEF),
tidal volume (Vt) and minute volume (Vm).
After 5 minutes, the software automatically
records the values of all these parameters into the
database and warns the operator by means of a pop-
up window. When this occurs, the operator has to
read the LV meters and type these measurements to
be stored. This procedure is repeated twice at 5
minute intervals.
All these parameters and the three curves (one
minute interval) are stored into the database.
The Figure 4 gives an example of the waveforms
plotted on the screen as well as the fields filled up
with the data on the LV and indexes calculated by
the software.
A LV belonging to a public hospital was tested
using the developed system and a calibrated
commercial analyzer.
The test was carried out according to the
procedure proposed by Tolotti (2004). The LV was
working in volume-cycled mode (10 breaths/minute;
IER: 1:2; PEEP: 4cmH
2
O; Vt: 500ml).
3 RESULTS
Table 1 shows the average of three sets of
measurements obtained with developed system (DS)
and with a calibrated commercial analyzer (CA).
The relative error was calculated using the CA
values as reference. Since the flow resistance may
affect the results, it was not acceptable to connect
the two equipments in series to the LV and LS.
Therefore, the measurements were separately carried
out with each analyzer.
Table 1: Average of three set of measurements obtained
with the developed system (DS) and the commercial
analyzer (CA). For the other acronyms, refer to the text.
Indexes
Averaged
Measurements
(CA)
Averaged
Measurements
(DS)
Relative
Error
BF(min
-1
) 10 10 0.00%
IT(s) 2.023 2.05 1.33%
ET(s) 3.963 3.953 −0.25%
IER 1:1.953 1:1.93 1.19%
PPI (cmH
2
O) 27.2 26.957 −0.89%
MAP(cmH
2
O) 8.8 8.843 0.50%
PEEP(cmH
2
O) 4.03 3.94 −2.23%
PEF(l/min) 48.34 54.89 13.54%
PIF(l/min) 20.61 20.63 0.10%
Vt(ml) 552.53 551.33 −0.22%
Vm(l/min) 5.537 5.517 −0.36%
Figure 4 exemplifies how the measurements and
sampled waveforms are obtained.
BIODEVICES 2009 - International Conference on Biomedical Electronics and Devices
164
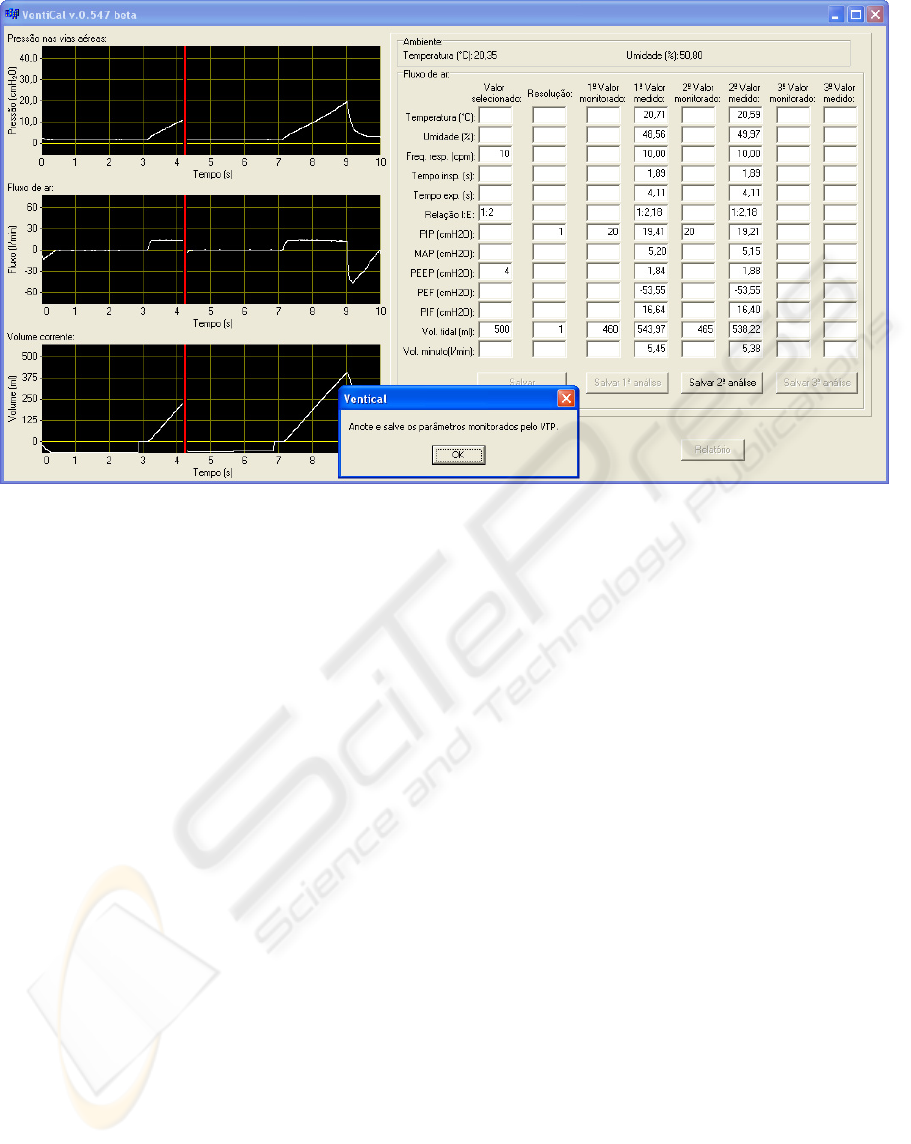
Figure 4: Screen presented by the developed software after performing a second set of measurements. A pop-up window
asks to insert the LV meters readings. In the first column, the operator has to inform the LV settings and, in the second one,
the resolution of the available LV meters. The fourth, sixth and eighth columns will be automatically filled up by the
measured and calculated indexes. Each one is obtained 5 minutes apart from each other. The third, fifth and seventh are
filled by the operator with the readings from the available LV meters. The indexes, from the first to last row, are:
Temperature, RH, BR(min
-1
), IE, IT, ET, IER, PIP, MAP, PEEP, PEF, PIF, Vt, Vm. The presented curves from top to
bottom are: pressure, flow and volume. The red line is a cursor that shows where the previously acquired waveforms are
being overwritten by the new samples.
4 DISCUSSION
Table 1 points out that, except for the PEF value, the
developed system has a good performance.
The error for the PEF can be explained by the
differences between the mechanical resistances of
both systems. During the expiratory phase, the LV
just opens a valve to empty the LS without
controlling the flow. Therefore, if the analyzers have
different flow resistances, they will produce
different PEF measurements. It should be mentioned
that the IEC 60601-2-12 does not establish a flow
resistance value for the analyzers. Therefore, to
analyze the LV performance over the time based on
this index, a same analyzer model shall be used.
5 CONCLUSIONS
A micro-computerized system to analyze the
performance of lung ventilators was successfully
implemented.
It has some better characteristics when compared
to commercial equipments.
A database is integrated to the analysis software.
For each test carried out, it is possible to store the
date, sampled waveforms and measurements under
the same equipment record. Therefore, it is easy to
follow up the LV performance along the time.
Besides, the database can provide information on the
life expectancy and the average number of repairs
for a given LV model, assisting the purchase of new
equipments.
RF communication between the acquisition
module and microcomputer provides comfort to the
operator. The computer can be placed by the LV
control panel to facilitate the registration of its meter
readings as required by the adopted procedure.
As the equipment interface and indexes
calculation are provided by the microcomputer
(usually available to the clinical engineering staff),
the hardware module has lower design complexity
when compared to similar analyzers and, therefore,
lower cost.
MICROCOMPUTERIZED SYSTEM TO ASSESS THE PERFORMANCE OF LUNG VENTILATORS
165

ACKNOWLEDGEMENTS
The authors thank CNPq (507363/2004-3) and
FAPESC (CON14598/2005-0) for financial support.
REFERENCES
Analog Devices 2003, ADuC841/ADuC842/ADuC843
microcConverter 12-Bit ADCs and DACs with
embedded high speed 62-kB Flash MCU datasheet.
USA.
Doeblin, E. O., 1990. Measurement Systems: application
and design. Chapter 7, McGraw-Hill, Singapore.
Fernández-Pérez, E. R., Keegan, M. T., Brown, D. R.;
Hubmayr, R. D., Ognjen G. 2006. Intraoperative Tidal
Volume as a Risk Factor for Respiratory Failure after
PneumonectomyAnesthesiology, 105: 14-18.
Honeywell Inc., 2008. DC030NDC datasheet.
http://sensing.honeywell.com/index.cfm?ci_id=14030
1&la_id=1&pr_id=82004
International Electrotechnical Commission, 2001. IEC
60601-2-12: Medical electrical equipment – Part 2-12:
Particular requirements for the safety of lung
ventilators – Critical care ventilators. Switzerland.
Jones, R. P., Conway D. H, 2005. The effect of
electromagnetic interference from mobile
communication on the performance of intensive care
ventilator, European Journal of Anaesthesiology; 22:
578–583.
Kcwirefree, 2006. KC-210 embedded bluetooth USB
serial adapter datasheet. USA.
Kcwirefree, 2007. KC-21 OEM bluetooth module
datasheet. USA.
Pierce, L. N. B., 1995. Guide to Mechanical Ventilation
and Intensive Respiratory Care, W. B. Saunders
Company, USA.
Ricard, J. D., Dreyfuss, D., Saumon, G., 2003. Ventilator-
induced lung injury, Eur Respir J, 22: Suppl. 42, 2s–
9s.
Sensirion, 2007. SHT1x / SHT7x humidity & temperature
sensor datasheet v3.01, Switzerland.
Tolotti, A. A., 2004. Desenvolvimento de procedimento
para realização de ensaio de desempenho em
ventiladores pulmonares, Monograph, Clinical
Engineering Graduate Course, Federal University of
Santa Catarina, Florianópolis, Brazil.
Wallin, M. K. E. B., Wajntraub S., 2004. Evaluation of
Bluetooth as a Replacement for Cables in intensive
Care and Surgery, Anesth Analg; 98:763–767.
Wrigge, H., Uhlig, U., Zinserling, J. , Behrends-Callsen,
E., Ottersbach, G., Fischer, M., Uhlig, S., Putensen,
C., 2004. The Effects of Different Ventilatory Settings
on Pulmonary and Systemic Inflammatory Responses
During Major Surgery, Anesthesia & Analgesia, 98:
775-781.
BIODEVICES 2009 - International Conference on Biomedical Electronics and Devices
166
