
PERFORMANCE CONSIDERATIONS ON ADMISSION CONTROL
FOR MULTIMEDIA SERVICES
Brikena Statovci-Halimi and Harmen R. van As
Institute of Broadband Communications, Technical University of Vienna, Favoritenstrasse 9/388, A-1040 Vienna, Austria
Keywords:
Quality of Service, Admission Control.
Abstract:
Admission control represents a convenient mechanism to provide high-quality communication by ensuring
resource availability. This paper gives on overview on different measurement-based admission control algo-
rithms suitable to be applied in multimedia service environments. A new estimator used for the measurement
process is introduced, which dynamically changes the time window used for measurements. The performance
metrics of interest within the performance analysis are made up of average utilization, packet loss and per-
centage of admitted flows.
1 INTRODUCTION
Network management techniques have been of inter-
est to the networking research community for a long
time. They involve both data control and maintain-
ing a general controlled state throughout the network
by providing QoS guarantees. The provision of QoS-
controlled service requires the coordinated use of ad-
mission control, traffic access control, packetschedul-
ing, and buffer management. Other techniques in-
clude flow and congestion control and QoS routing.
Within service management, admission control
provides a mean in fulfilling the contracted service
level agreement (SLA) between the user and the net-
work provider. As a preventive congestion avoidance
mechanism, it attempts to make best use of the finite
link capacity across a network by admitting a new
flow of data into a network without impacting the
guarantees of existing data flows. It can be realized
in several ways. Generally we differentiate between
distributed and centralized approaches. The admis-
sion decision of distributed approaches can be based
on particular parameters of signalling messages (e.g.
peak rate or mean rate) or on measurements.
A particular method for realizing an admission
control decision is by performing measurements upon
arrival of a new admission request. These schemes
usually comprise of two phases - the measurement
phase performed by the estimator and the admission
phase performed by the policy rules. Several ap-
proaches have been investigated to date and were re-
ported in some valuable contributions such as (Jamin
et al., 1997), (Breslau et al., 2000), (Kelly, 2000),
(Casetti et al., 1996).
This paper provides a performance analysis on
measurement-based admission control for multime-
dia services. In Section 2 an overview of several es-
timators and admission policy schemes are presented.
Section 3 introduces a dynamic estimator, as well as
its performance analysis. Finally, Section 4 gives
some concluding remarks.
2 MEASUREMENT-BASED
ADMISSION CONTROL
There are several admission control approaches in the
literature, and no standardized method for the use on
a particular network. Data packet measurement-based
admission control (also referred to as passive MBAC)
is a group of admission control algorithms, which
usually measures the actual traffic load and performs
the AC function using the estimation value based on
the current measured traffic volume. For this pur-
pose the authors of (Jamin et al., 1997) have evalu-
ated different AC algorithms and compared their per-
formance. Further, (Casetti et al., 1996) describes an
adaptive admission control algorithm based on mea-
surements, which is the base for our observations.
A measurement-based admission control algo-
rithm can be divided into a measurement-based es-
timator and an admission policy component. The pol-
384
Statovci-Halimi B. and R. van As H. (2008).
PERFORMANCE CONSIDERATIONS ON ADMISSION CONTROL FOR MULTIMEDIA SERVICES.
In Proceedings of the International Conference on Signal Processing and Multimedia Applications, pages 384-387
DOI: 10.5220/0001938003840387
Copyright
c
SciTePress

icy of an algorithm is the procedure to follow at flow
admission, whereas the role of the estimator is to sup-
ply the information required for the admission deci-
sion based on measurements.
2.1 Policy Algorithms
The measured sum algorithm (MS) uses measurement
to estimate the load of existing traffic. Let µ be the
link bandwidth, α the new flow requesting admission,
and r
α
the rate requested by flow α. The new flow is
admitted if the following test succeeds:
ˆ
ν+ r
α
< cµ (1)
where c is a user-defined utilization target and
0 < c < 1. The measured load of existing traffic is
denoted with
ˆ
ν. Upon admission of a new flow, the
load estimate is increased using:
ˆ
ν
′
=
ˆ
ν+ r
α
(2)
A measurement-based approach is doomed to fail
at very high utilization when delay violations become
exceedingly large. It is thus necessary to identify a
utilization target and require that the algorithm strives
to keep link utilization below this level.
The acceptance region algorithms compute an ac-
ceptance region that maximizes the reward of utiliza-
tion against the penalty of packet loss. These algo-
rithms are based on Chernoff bounds. Given link
bandwidth, switch buffer space, a flow’s token bucket
filter parameters, the flow’s burstiness, and desired
probability of actual load exceeding bound, an accep-
tance region can be computed for a specific set of flow
types, beyond which no more flow of those particular
types should be accepted.
Based on different combinations of measured and
declared parameters, four related techniques based
upon Chernoff bounds are presented in (Gibbens and
F.P.Kelly, 1997). The availability and ease of mea-
surement extractions (e.g., per-flow vs. aggregate)
and the need for a priori traffic declarations (e.g., av-
erage rate as well as peak rate) will each affect the
relative practicability of the four approaches, namely:
tangent at peak (ACTP), tangent at arbitrary location,
tangent at slope one, tangent at origin (ACTO). Table
1 illustrates basic features of these four algorithms.
For a better overview let us illustrate the compu-
tation of the effective bandwidth requirement of the
traffic aggregate (all classes added together) for the
tangent at slope one algorithm:
ˆ
ν = X +
C
4
K−1
∑
k=0
p
2
k
n
k
(3)
where,
ˆ
ν is the estimate for traffic load, K is the
number of different flow types, n
k
is the number of
Table 1: Characteristics of acceptance region schemes.
Acceptance region Measurement Per-class
scheme declaration
Tangent at peak Per-class Peak rate
measurements
Number of connections
per class
Tangent at Per-class Peak rate,
arbitrary location measurements
Number of connections Average rate
per class
Tangent at Aggregate (line) Peak rate
slope one measurements
Tangent at origin Aggregate (line) Peak rate
Tangent at origin measurements
individual flows of a particular type, p
k
represents the
peak-rate for a particular flow type, X is the measured
aggregate utilization, andC is a scaling factor. For ad-
mission decision this estimated aggregate load should
be smaller or equal to link capacity µ.
The Hoeffding bounds scheme is in fact the com-
putation base for the equivalent bandwidth algorithm
(Guerin et al., 1991). It sets a probability threshold on
the sum of the source transmission rates.
C(ε) = r
S
+
s
ln(1/ε)
∑
K
k
p
2
k
2
(4)
where, C(ε) represents the equivalent bandwidth,
r
S
is the average aggregate arrival rate, p
k
is the peak
rate, ε is the target loss rate and k is the number of
flows. When a new flow α requests admission, the
admission control check is then based on this crite-
rion:
C(ε) + p
α
≤ µ (5)
2.2 Estimators
In order to be able to maintain a level of service or
guarantee of QoS, the algorithm must have available
an estimate of current resource requirements, typi-
cally bandwidth requirements. Bandwidth estimation
may be based upon predictive traffic models, mea-
surements, or a combination of both. Those based on
measurements are of interest for this study.
As shown in Figure 1 an average load is computed
for every sampling period S with the time window
estimator, where S represents an integer number of
stochastic packet transmission times. At the end of
a measurement window T, which is an integer num-
ber of sampling periods S, the highest average en-
countered within the window is used as the load es-
timate for next window T. Additionally, whenever a
new flow is admitted to the network, the estimate is
increased according to the advertised flow informa-
tion (e.g., peak rate of the requesting flow), and the
window is restarted. The estimate is also increased
PERFORMANCE CONSIDERATIONS ON ADMISSION CONTROL FOR MULTIMEDIA SERVICES
385
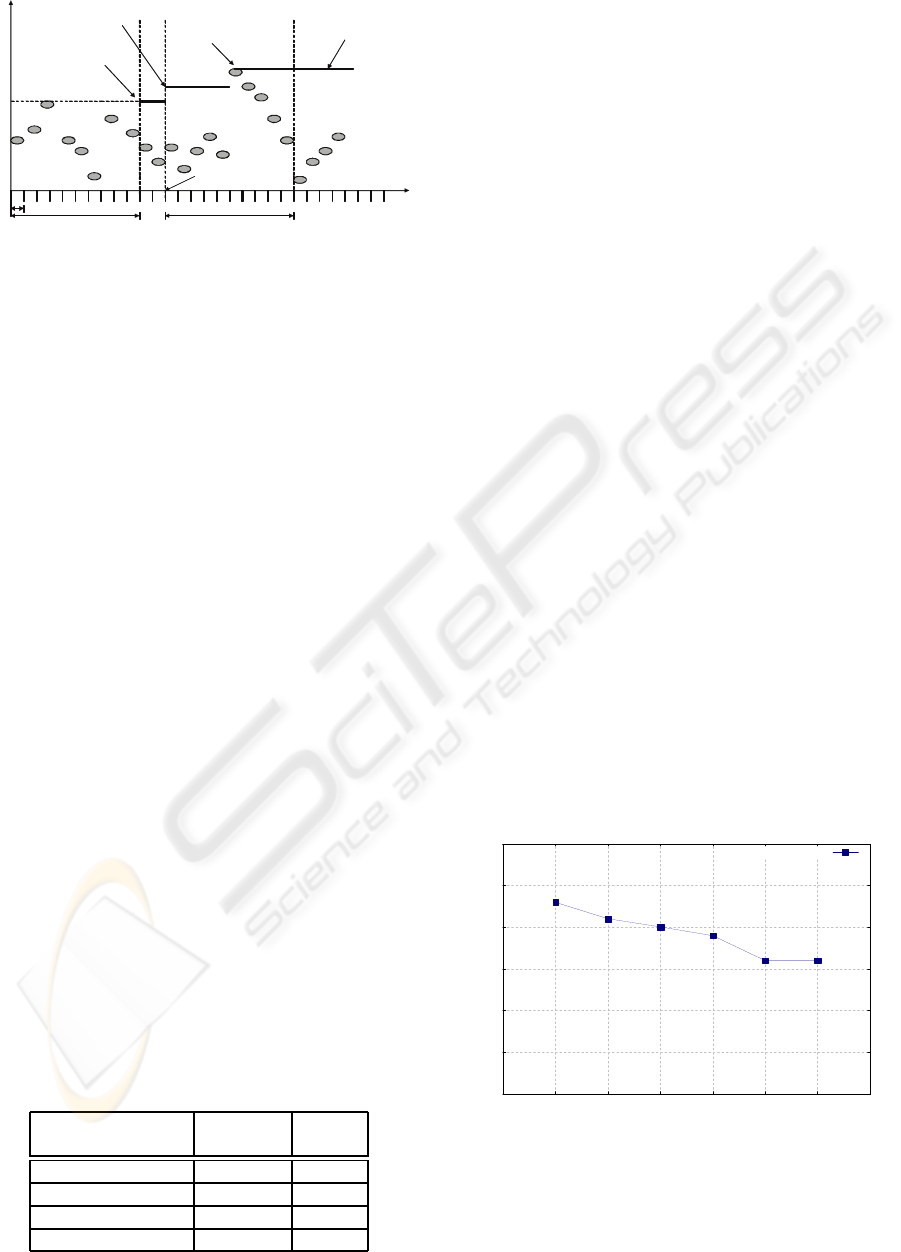
S
T T
Load = max sample
in previous window
New flow
Sample above
estimate
Rate
estimate
SS
time
load
Restart T
Figure 1: Time-window measurement of network load.
immediately if a newly measured average is higher
than the current estimate.
As the name suggests, the point samples measure-
ment mechanism used with the acceptance region al-
gorithm takes an average load sample every sampling
period S.
For exponential averaging, an estimate of the av-
erage arrival rate can be used instead of instantaneous
bandwidth to compute admission decision with the
Hoeffding bounds approach. The average arrival rate
r
α
is measured once every sampling period S. The
average arrival rate in then computed using an infi-
nite impulse response function with weight w (e.g.,
0.002):
ˆ
ν
′
= (1− w)
ˆ
ν
′
+ wr
α
(6)
where, r
α
is the average arrival rate,
ˆ
ν represents
the measured load of existing traffic, S is the sampling
period, and w is the weight.
2.3 Performance Comparison
Table 2 provides the number of transmitted vs.
dropped packets for different estimator - policy pairs.
This comparison as well as the analysis on output
utilization from (Statovci-Halimi, 2008a), prove the
measurement sum algorithm to reveal the best perfor-
mance at least cost. The conclusion on least cost is
based on the simplicity of this algorithm in compari-
son to the other three evaluated ones. This algorithm
is used together with the time-window estimator.
Table 2: Transmitted and dropped packets.
Admission control Transmitted Dropped
algorithms packets packets
ACTP with PointSample 26217923 150
ACTO with PointSample 25906454 35
HB with ExpAvg 26993894 2038
MS with TimeWindow 26127938 120
3 A DYNAMIC TIME-WINDOW
ESTIMATOR
The idea of our estimator is the dynamic adjustment
of the time window size to the changing traffic re-
quirements. The main principle of this algorithm is
based on the attempt of avoiding the use fixed-length
measurement windows, as traffic characteristics are
usually unknown or can vary. By means of enlarging
or shrinking the measurement window, the adaptation
to the changing traffic conditions can be provided, so
as to obtain a more or less conservative admission
process (Statovci-Halimi, 2008b).
The algorithm comprises two phases. The first
phase represents the measurement procedure. In or-
der to increase link utilization, the length of the mea-
surement window is here continually shrunk with a
factor f
small
, until the amount of traffic generated by
accepted requirements reaches a trigger value, which
is smaller than the output link capacity. As a reaction,
the algorithm then enlarges the measurement window
with a factor f
large
until the measured rate drops be-
low the trigger, at which point the window can be
shrunk again. This process changes according to the
variable traffic conditions. The second phase of the
algorithm the outputs of the first phase in order to ad-
just the trigger value according to traffic fluctuations.
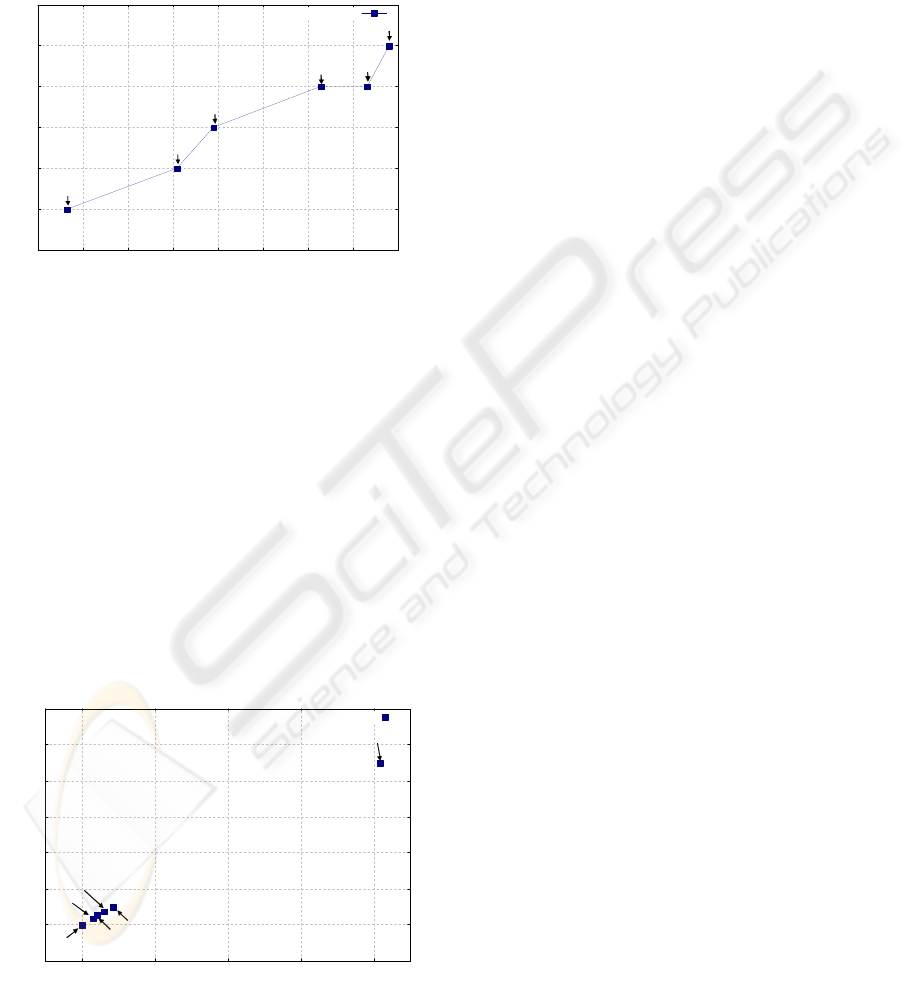
3.1 Simulation Results
For evaluation purposes network simulations are per-
formed with ns-2, using three source models. Ac-
cording to conclusions of (Statovci-Halimi, 2008a),
our dynamic estimator is used in combination with
the measured sum algorithm.
60
65
70
75
80
85
90
0 1 2 3 4 5 6 7
Utilization [%]
Time Window
Time Window
Figure 2: Dependency of utilization from time window.
The simulation environment comprises a two-
node topology, and the total number of flows is 9986.
The voice over IP traffic uses an exponential ON/OFF
SIGMAP 2008 - International Conference on Signal Processing and Multimedia Applications
386
source with transmission peak rate of 64kbit/s, packet
size of 200 and idle time of 325ms. Video traffic is
simulated by and exponential ON/OFF source with an
inter arrival time of 0.1s, exponential holding time of
100s, and video holding time 300s. Background traf-
fic is also applied to the network.
81
82
83
84
85
86
87
8150 8200 8250 8300 8350 8400 8450 8500 8550
Percentage of admitted flows [%]
Number of admitted flows
Time Window
T = 6
T = 4
T = 1
T = 3
T = 5
T = 2
Figure 3: Percentage of admitted flows.
The performance of the algorithm is evaluated by
measuring the actual link utilization and drop rate.
These metrics are measured starting after an initial
warm-up period of 1600s. Figure 2 clearly illustrates
the impact that the time window length has on the av-
erage utilization. A larger time window causes a de-
crease of the average utilization.
Figures 3 and 4 prove together an interesting
property of the algorithm. For time window T = 4,
loss rate is equal to zero, whereas for a time window
equal to the sample time S, i.e. T = 1, the loss rate
is very high, as to much resources are spent for often
measurement and decision process.
-20
0
20
40
60
80
100
120
0 1000 2000 3000 4000
Loss rate [x10-6]
Number of packet drops
Time Window
T = 6
T = 4
T = 1
T = 3
T = 5
T = 2
Figure 4: Loss rate for different T lengths.
4 CONCLUSIONS
This paper introduces a dynamic time windowestima-
tor, which is based on load measurements and adjust-
ment of the time window size. In general, a smaller
measurement window T yields a higher utilization at
higher loss rate and a larger T keeps more reliable loss
rates at the expense of utilization level. The source
burstiness also gives differences in this context. Ex-
treme traffic fluctuation is more difficult to handle un-
der tight guarantees, so the tradeoff between accuracy
and automate configuration is a relevant factor when
deciding upon the implemented approach.
ACKNOWLEDGEMENTS
The work described in this paper was carried out with
the partial support of the BONE-project (”Building
the Future Optical Network in Europe”), a Network
of Excellence funded by the European Commission
through the 7th ICT-Framework Programme.
REFERENCES
Breslau, L., Knightly, E., Shenker, S., Stoica, I., and Zhang,
H. (2000). Endpoint Admission Control: Architec-
tural Issues and Performance. Stockholm, Sweden.
Casetti, C., Kurose, J., and Towsley, D. (1996). An Adaptive
Algorithm for Measurement–Based Admission Con-
trol in Integrated Services Packet Networks. In 5th
Int. Workshop on Protocols for High Speed Networks,
pages 13–28, Antipolis, France.
Gibbens, R. and F.P.Kelly (1997). Measurement–based
Connection Admission Control. In 15th International
Teletraffic Congress (ITC15), volume 2b, pages 879 –
888, Washington DC, USA.
Guerin, R., Ahmadi, H., and Naghshineh, M. (1991).
Equivalent capacity and its application to nadwidth
allocation in high-speed networks. IEEE Journal in
Selected Areas in Communications, 9(3):378–387.
Jamin, S., Danzig, P., Shenker, S., and Zhang, L. (1997).
A Measurement–Based Admission Control Algorithm
for Integrated Services Packet Networks. IEEE/ACM
Transactions on Networking, 5(1):56–70.
Kelly, F. (2000). Distributed Admission Control. IEEE
Journal on Selected Areas in Communications,
18(12):2617 – 2628.
Statovci-Halimi, B. (2008a). Performance Comparison of
Measurement-Based Admission Control. In 13th Eu-
ropean Conf. on Network and Optical Communica-
tions, Krems, Austria.
Statovci-Halimi, B. (2008b). Support of IP Multi-Services
Through Admission Control. In First ITU-T Kalei-
doscope Academis Conference, pages 407 – 414,
Geneva, Switzerland.
PERFORMANCE CONSIDERATIONS ON ADMISSION CONTROL FOR MULTIMEDIA SERVICES
387
