
MAKING USE OF MOBILE DEVICES IN E-COMMERCE
Overcoming Organizational Barriers through User Participation
Jan vom Brocke, Bettina Thurnher
Martin Hilti Chair of Information Systems and Business Process Management (IS&BPM)
University of Liechtenstein, Vaduz, Liechtenstein
Dietmar Winkler
Institute of Software Technology and Interactive Systems
Vienna University of Technology, Vienna, Austria
Keywords: Mobile Devices, Business Process Management, User Participation, Organisational Change.
Abstract: Mobile devices offer great potentials for the design of business processes. However, realizing these
potentials in practice is still problematic. While technologies are nowadays widely available, the problems
still lie in the management of organizational change. In this paper, we analyze the contribution of user
participation to the successful implementation of mobile business processes. We present the results of five
case studies conducted in the IT-Service sector. The work gives empirical evidence that user participation
(a) leads to reduced adoption and transition barriers and (b) improvements of business metrics.
1 INTRODUCTION
Mobile devices in information and communication
technology have raised great expectations during the
past years (Wang et al., 2005; Gumpp & Pousttchi,
2005). Following the discussion in academia and
industry, expectations go far beyond cost cutting. In
particular new business models (and hence new
ways of market reach) are inspired by mobile
devices. This is grounded by a number of recent
studies (cf. Kornak et al. 2004; Basole 2005; ; 2007).
In more detail, the potentials of mobile devices for
business process management include (a) the release
of workforce from desktop IT-Systems, (b)
replacement of paper-based processes, and (c) access
to corporate resources and automated online
information request (cf. Basole, 2005; Basole &
Rouse, 2007).
In practice, however, the successful implementation
of mobile business processes is still a serious
problem. Previous research has argued that
successful adoption and implementation of any
emerging devices, such as mobile devices, often
requires fundamental changes of a company’s
organisation (cf. Taylor & McAdam, 2004; Rouse,
2006). In fact, although mobile technology is widely
available nowadays, most projects fail in
establishing sustainable business processes that are
efficiently applied in the business processes of a
company. In our research, we focus on the role of
user participation when implementing mobile
business processes. According to research in
software- and usability engineering (e.g., Gibson
1977; Nielsen 1993; Barki & Hartwick, 1989,
Nielsen, 2003; Thurnher 2007, etc.) user
participation is expected to have a positive effect on
the efficient use of mobile devices in practice.
However, little empirical research is available that
looks at the effects of user participation in
introducing mobile devices. In particular, also the
costs of user participation have to be taken into
account and weighed against potential benefits.
From a normative perspective (cf. Hartman et al.,
2000; Ward & Peppard, 2002), different levels of
user participation have to be distinguished and
analysed regarding their value contribution in a
specific organisational context.
With this paper, we present the results of five case
studies in the IT service sector. In these studies, we
analysed the impact of user participation in different
projects on introducing mobile devices from 2005 to
2007. We anticipate that user participation within
168
vom Brocke J., Thurnher B. and Winkler D. (2008).
MAKING USE OF MOBILE DEVICES IN E-COMMERCE - Overcoming Organizational Barriers through User Participation.
In Proceedings of the Tenth International Conference on Enterprise Information Systems - SAIC, pages 168-173
DOI: 10.5220/0001713501680173
Copyright
c
SciTePress
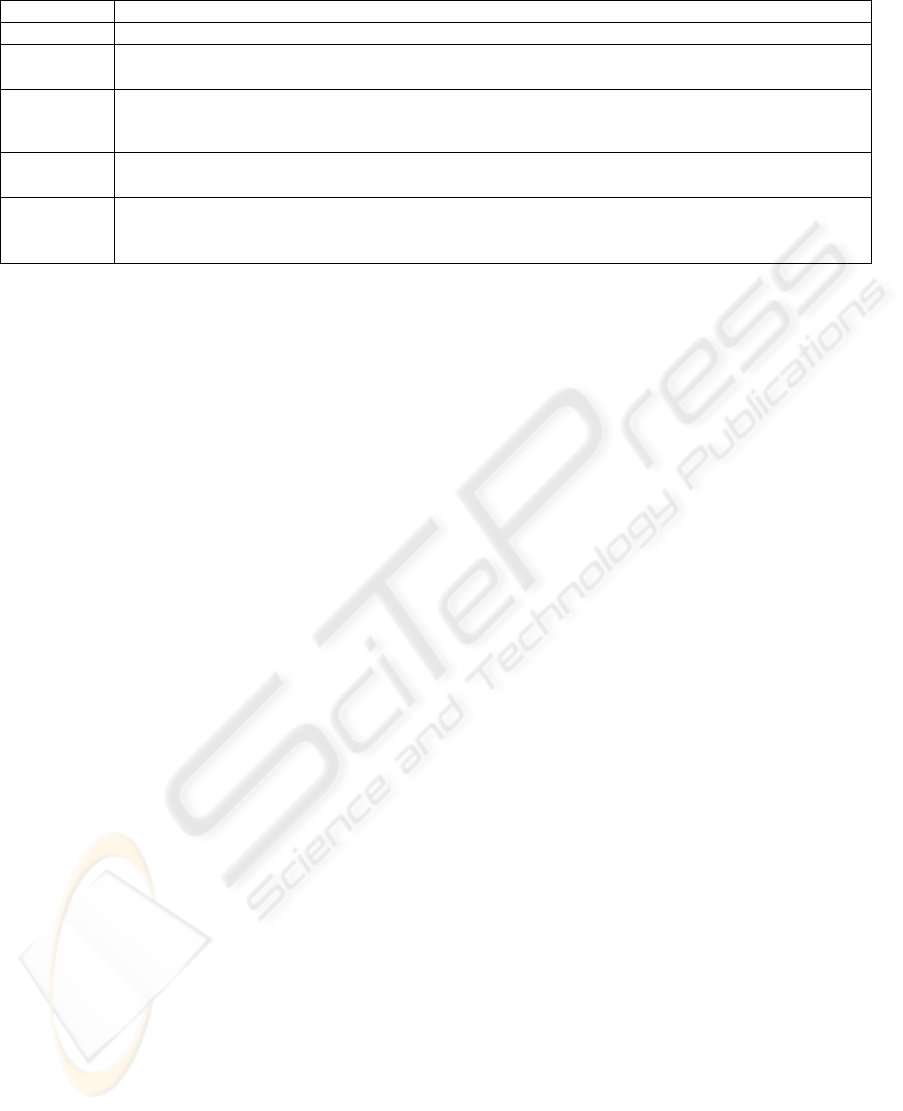
Table 1: KPI Definition and Measurement Approach.
KPI Definition
Time to Bill Duration [in days] from task completion to invoice submission.
SLA-Rate Service Success Rate [in %] is defined as the ratio of the duration from service request to fulfilment
of the request related to the agreed (in the customer contract) SLA.
Paper-
handling
time
Paper handling time [in days] is the duration from task completion until the submission of
performance data (working-, driving-time and number of used spare-parts) to head-office.
Payback
Period
The payback period [in years] is defined as the amortization time of mobile tool integration
(development and deployment costs) vs. reduced cost through mobile tool usage.
Tool
Acceptance
Attitudes towards usage and intentions to use the technology. This includes adoption and transition
barriers from the paper-based to the mobile tool supported process. Tools acceptance is based on
interviews and mapped to a nominal scale [1 .. low, 2 .. high end user acceptance]
the development process of a mobile tool leads to
faster adoption and acceptance of mobile devices.
We investigate different degrees of user
participation and report on their value contribution
by means of key performance indicators. The results
are presented as follows: In chapter 2 related work in
the field of mobile devices is reflected, particularly
distinguishing different levels of user participation.
On that basis the research design applied in our work
is introduced in chapter 3. The major findings of our
work are presented in chapter 4 and further
discussed in chapter 5. We conclude with a summary
and an outlook to future research given in chapter 6.
2 RELATED WORK
The Standish Group investigated a set of industry
projects (365 industrial responses involving more
then 8300 applications) and the main reasons for
project failure. The most important reasons for
project interruption were: (1) lack of management
support and (2) a lack of user involvement (Standish
Group, 2001). Obviously, strong user participation
during mobile tool development is necessary to fulfil
individual requirements of the target user group and
to address the need of the mobile devices within
business processes. The investigation of positive
impacts of user involvement and user participation
on system acceptance has been done extensively
within the ICT literature over the last 30 years of
ICT research, e.g., (Kaasinen, 2005; Nielsen, 2003;
Pedersen, 2002; Ives & Olson, 1986; Lucas 1974).
The terms user participation and user involvement
are often used inter-changeably in the Information
System literature. However, in other disciplines, the
concepts are accorded separately and have distinct
meanings (Barki & Hartwick, 1989). In order to
address this anomaly, Barki and Hartwick argue that
the term user participation be utilized to refer to
development-related activities and behaviours of
users and their representatives during the
development process, and that user involvement be
used to refer to the subjective psychological state
that reflects the level of importance and personal
relevance of the information system to users. These
researchers also argue that user participation is one
of the more important concepts, of user involvement.
User participation leads to increased system
acceptance by: (a) developing realistic expectations
about system capabilities (Gibson, 1977), (b)
providing an arena for bargaining and conflict
resolution about design issues, Leading to system
ownership by users (Robey & Farrow 1982) (c)
decreasing user resistance to change (Lucas, 1974)
(d) committing users to the system (Lucas, 1974).
Whereas the importance of user participation has
been pointed out in the literature in the last decades
(e.g., Lucas, 1974; Barki & Hartwick, 1989, Nielsen,
1999; Nielsen, 2003; Pousttchi & Thurnher 2007)
the integration of users within the software
development processes is still not considered
entirely throughout the industry and especially
within the IT-Service sector. The development of
tools is possible without user participation in the
design process – but deployment will be more
cumbersome due to adoption and acceptance barriers
amongst end users (Henneman, 1999). Whereas
linking usability considerations and user
participation to the impact on business metrics have
been investigated, e.g., by Nielsen, 2003; in depth
investigations targeted at mobile applications in the
IT-Service sector are missing so far. Nielsen (2003)
stated in his report that he estimates "… spending
about 10% of a project's budget on usability
activities doubles usability”.
The next section describes the research design,
the case study companies and the KPIs which have
been investigated.
MAKING USE OF MOBILE DEVICES IN E-COMMERCE - Overcoming Organizational Barriers through User
Participation
169
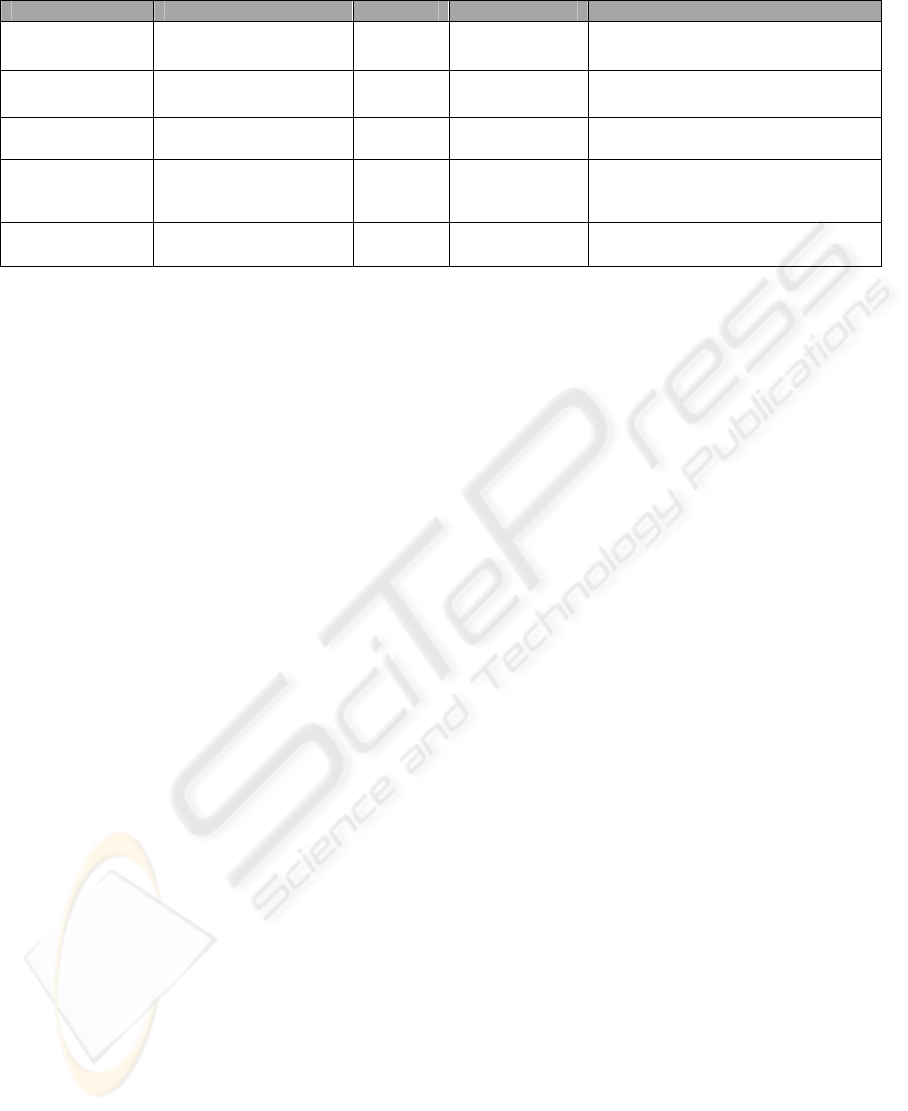
Table 2: Case Studies Description.
Company Provided Service # users Country Degree of User Participation
1)Telecommunica
tion Service
Technical customer
service
Large
(12,000)
Germany Little involvement; mainly in device
selection and testing
2)Municipal
Utility Company
Technical customer
service
Medium
(1,000)
Germany User participation in all phases
3)IT-Service
Provider
Technical customer
service
Small
(40)
Austria User participation in all phases
4)Toll Collection
& Railway
Maintenance
Technical customer
service
Mini
(7)
Austria Little user involvement; mainly in
the device selection phase
5)Machine
Construction
Technical customer
service
Large
(3,500)
Germany User participation in all phases
3 RESEARCH DESIGN
To investigate the impact of user participation and
KPIs within mobile business processes, we applied
case study research as it is appropriate for examining
practice-based problems, since it allows a researcher
to capture the knowledge of practitioners and
investigate business impact of methods or systems
(Anda, 2003; Benbasat et al., 1987; Creswell, 2002;
Eisenhardt, 1989). Where there is no ideal number
of cases which should be investigated in case study
research, Eisenhardt suggests conducting four to ten
case studies: “With fewer than four case studies it is
often difficult to generate theory with much
complexity and its empirical grounding is likely to
be unconvincing, unless the case has several mini-
cases”. (1989 p. 545) With more than ten cases it
becomes difficult to cope with the complexity and
saturation degree is already achieved (cf. Eisenhardt,
1989). Within this paper 5 case studies have been
undertaken in order to meet the suggestions of
Eisenhardt (1989) from a research perspective.
The studies were carried out in the IT-Service
sector. A basic IT-Service process starts with a
service request from the customer. Those requests
are classified according to predefined Service Level
Agreements (SLAs) with the customer. Dispatching
of the service requests is then arranged by the
dispatching/head-office department of the IT-
Service company. Then service technicians execute
service tasks (e.g., repair, installation and
maintenance of office machines). IT-Service
technicians are, e.g., engineers who work on the
customers’ side. Technicians are called either
periodically (e.g., continuous support for a set of
devices) or on-demand if unexpected events occur
e.g., machine break-down). After service task
execution the technicians have to capture and
transmit job related data (e.g., working- and driving
time, number of used spare parts). In the paper-
based process this has been done on a paper-form
which was transmitted to a desktop-system
(normally at the end of a working week by the
technician or head-office staff). When job data was
available head-office/finance department could start
with the billing process (prepare and send bill to the
customer). Through the application of mobile
devices an improvement of KPIs within the mobile
business process is expected. The KPIs under
investigation are depicted in Table 1. Despite the
numerous above mentioned value propositions and
the need of including the end user within software
development of mobile devices - within industry
projects user involvement is still not applied widely
(e.g., Nielsen 1993; Barki & Hartwick 1989;
Thurnher 2007) . In order to investigate and clarify
the value contribution of user participation within
the development process of mobile solutions we
formulated the following research questions (RQ).
RQ: What impact does user participation - in the
development phase of mobile tools - have on
business process key performance indicators after
deployment?
Expecting an improvement on the identified
KPIs, we focus on the degree of change (KPI
improvement). For instance, we expect a correlation
regarding the degree of user participation and
positive impact on KPIs.
For data gathering CEO, CTO, project managers
and end users of the mobile application were
questioned with semi-structured questionnaires in
face-to-face or via telephone interviews. Interviews
lasted 1 hour to 1.5 hours. The interviewees of the
case studies were selected based on their role in the
organization and their level of experience with
existing system and processes. Moreover,
interviewees were selected according to their
functions within the mobile application project (El-
Amrani et al., 2006).
Table 2 provides an overview of the case study
companies and shows the varying degrees of user
ICEIS 2008 - International Conference on Enterprise Information Systems
170

participation within the mobile tool development
process. Moreover, it depicts that the companies are
comparable in terms of their provided service but
vary in their location (Austria/Germany) and the
number of IT-Service technicians (# users). All five
case studies were longitudinal studies in the IT-
Service sector within different industries and lasted
from 6 to 15 months. Interviews were transcripted
and fed back to the interviewees in order to reduce
possible errors and clarify misunderstandings. We
applied a semi-structured questionnaires (30
questions) in face-to-face or phone interviews. In
total we conducted 14 interviews; 6 persons had a
business - and 8 a technical background. 10
interviews were face-to face interviews and 4
telephone interviews.
In the following section major findings of our
work will be summarized.
4 FINDINGS
It was notable, that KPI improvements in percent
reached similar values in all case study companies
e.g., paper-handling time, time to bill, etc. before
and after mobile tool integration. Findings related to
our RQ are:
RQ: What impact does user participation - in the
development phase of mobile tools – have on
business process key performance indicators after
deployment?
We could observe that a higher degree of user
participation led to a faster / higher improvement of
KPIs and vice versa within companies with a lower
degree of user participation (e.g., only device
selection phase) a lower acceptance rate and a
smaller improvement of KPIs (e.g., longer payback
period) could be identified. The business process
improvement values are mainly given in percent as
absolute numbers referred to company sensitive
data.
In the following paragraphs further information
on the results will be given referring to each of the
key performance indicators listed in Table 1. Time
to Bill: As head-office staff has faster (directly after
job completion or at the end of a working day) job
data access the time to bill could be reduced
considerably by 75 to 50%, including single item
billing and total accounts. In the case study
companies (case 2, 3 and 5) with user participation
in all phases of mobile tool development the time to
bill increased by approx. 75% (e.g. from 21 working
days down to 5 working days). SLA-Rate: The
SLA-rate increased by 30 to 40%. This means that in
30 to 40% of all service cases the technician can
execute the job within the agreed SLA-time period
(e.g., within 24 hours after service request receipt).
This is due to improved information e.g., the service
order, problem description and spare-part
availability, as well as customer reachability. Again
in companies with a higher degree of user
participation the improvement was 40% whereas in
case 1 and 4 it only reached a 30% improvement.
Paper-handling time: The reduced paper-handling
time for the technicians was approx. 55-80% (from
30 minutes for job data capturing per job down to 5
minutes). This was due to the fact that double data
entry could be eliminated completely (entering the
paper-based form into a desktop-system). This
improvement was observed in all case study
companies whereas transition time (switching from
the paper-based to the mobile tool supported
process) was considerably longer in those cases with
lower degrees of user participation (2-3 months: case
2, 3 and 5; versus 6 months: case 1 and 4). Payback
Period: The payback period in the Telecom
Company was 2.5 years and in the Utility- and IT
Service Company was 1.5 years. In the Toll
Collection Company it took 1.6 years. And in the
Machine Construction Company only 1.3 years.
Shorter payback periods were observed in cases with
a high degree of user participation. During the
interviews we found this was due to smoother
adoption and transition phases of the mobile tool
supported workflow. The time for double process
execution, paper-based and mobile was reduced by
about 6 months in cases with user participation in all
development phases. Tool acceptance: Tool
acceptance varied in the case study companies
according to the degree of user participation versus
user involvement. We could observe that, the higher
the degree of user participation in the development
process of the mobile tool, the higher the acceptance
and intension of mobile tool usage after deployment.
In case study companies with little user involvement
tool acceptance and workflow change were
cumbersome. In Case Study Company 2, 3 and 5 we
observed a high user participation and high user
acceptance, while in Case Study Company 1 and 4
we observed little user involvement and low user
acceptance. Table 3 provides an overview of the
Case Study findings. Values are indicated in a
Likert-Scale (user participation, acceptance): 1 =
low; 5 = high and improvement values in per cent
(%). The Time to Bill is indicated in days,
comparing the former paper-based process duration
in days to the mobile tool supported duration.
MAKING USE OF MOBILE DEVICES IN E-COMMERCE - Overcoming Organizational Barriers through User
Participation
171

Table 3: Findings.
Company 1) Telco 2) Utility 3) IT-Service 4) Toll Coll. 5) Mach. Const.
User Participation 1 4 5 2 5
Time to Bill (days) 4 5 14 3 11
SLA-Rate (%) 25% 35% 45% 20% 40%
Paper-handling (%) 55% 70% 80% 60% 75%
Payback period (years) 2.5 1.5 1.5 1.6 1.3
Acceptance 2 4 5 1 4
From the results in Table 3 it can be concluded
that the higher the user participation in the
development was, the higher was tool acceptance.
Higher acceptance lead to faster transition times
(changing from the paper-based to the mobile tool
supported process) and that impacted KPIs
positively e.g., lead to higher improvements in the
Time to Bill.
Some ideas on the contribution these results
might add to research will be discussed in the
following chapter.
5 DISCUSSION
The findings presented in this paper provide
valuable insights in the field of mobility supported
business process and the role of user participation.
However, we are aware that the case study
approaches suffers from a number of shortcomings.
In order to overcome the limitations of case
study research a rich description of the context of the
study is provided, which can be used for
generalization to similar settings. For the research
purpose of this paper a single case study would not
have been appropriate due to several problems
linked to this research approach. Lee stats four major
problems of case study research (a) “making
controlled observations”, (b) “making controlled
deductions“, (c) “allowing for replicability” and (d)
“allowing for generalizability” (Eisenhardt, 1989).
The major strength of case study research is the
possibility of studying a phenomenon in depth in a
realistic (work) context. Weaknesses are related to a
lack of control, which leads to problems with
generalizing the results. Moreover, the data collected
may be interpreted in different ways, and the
intervention of the researcher may affect the
organization studied. Therefore, it may be difficult
to analyze causes of the observations made in the
study. Several practical challenges face the
researcher when undertaking a case study. For
example, it may be difficult for the organization to
find time to participate, and they may be unwilling
to give the researcher access to all their projects.
This may lead to a bias in the selection of projects
and cases studied. The organization may expect
quick and easily applicable results, which may run
counter to the goals and practice of the research
(Anda, 2003). In order to overcome the limitations
of case study research a rich description of the
context of the study is provided, which can be used
for generalization to similar settings.
6 CONCLUSIONS
With this paper we presented the results from five
industry case studies analysing the impact of user
participation on the success of introducing mobile
devices in business processes. In our examination
within the IT-Service sector 2 out of the 5
companies had a low degree of user participation. 3
companies had user participation within all phases of
mobile tool development and business process
redesign. The study gives evidence that user
participation within the development process of
mobile tools (a) leads to reduced adoption and
transition barriers as well as (b) improvements of
business metrics, especially the return on
investment.
These findings may provide a basis for further
research on the issue of managing organisational
change driven by innovative technologies. Working
with the results, however, we should consider that
the nature of case study research brings along some
limitations. In particular, we should be aware that
the results may be different when addressing other
context situations. Further research will therefore
focus on studies in diverse industry settings to foster
the generalizability of the results.
REFERENCES
Anda B., “Empirical studies of construction and
application of use case models,” PhD Thesis,
University of Oslo, 2003.
Barki H. and Hartwick J., “Rethinking the concept of user
involvement,” MIS Quarterly, Vol. 13, No. 1, pp. 53–
63, 1989.
ICEIS 2008 - International Conference on Enterprise Information Systems
172

Basole R. and Rouse W. B., Towards the Mobile
Enterprise: Readiness and Transformation. IDEA
Group Publishing, 2007.
Basole R., “Mobilizing the enterprise: A conceptual model
of transformational value and enterprise readiness,” in
Proceedings of the 2005 American Society for
Engineering Management Conference, Virginia
Beach, VA, 2005.
Benbasat I., Goldstein D. K., and Mead M., “The case
research strategy in studies of information systems,”
MIS Quarterly, Vol. 11, No. 3, pp. 369–386, 1987.
Creswell J. W., Research Design: Qualitative,
Quantitative, and Mixed Methods Approaches, 2nd ed.
Sage Publications, Inc., 7 2002.
Eisenhardt K. M., “Building theories from case study
research,” Academy of Management Review, Vol. 14,
No. 4, pp. 532–550, 1989.
El-Amrani R., Rowe F., and Geffroy-Maronnat B., “The
effects of enterprise resource planning implementation
strategy on cross-functionality”, Information Systems
Journal, Vol. 16, No. 1, pp. 79–104, January 2006.
Gibson H. L., “Determining user involvement,” Journal of
System Management, pp.
20–22, 1977.
Gumpp A. and Pousttchi K., “The Mobility-M-Framework
for application of mobile technology in business
processes,” in GI Jahrestagung (2), ser. LNI, Cremers
A. B., Manthey R., Martini P., and Steinhage V., Eds.,
Vol. 68. GI, 2005, pp. 523–527.
Hartman A., Sifonis J. G., and Kador J., Net Ready:
Strategies for Success in the
E-Conomy. McGraw-Hill, 2000.
Henneman R. L., “Design for usability: Process, skills,
and tools,” Journal of Information Knowledge System
Management, Vol. 1, No. 1, pp. 133–144, 1999.
Hofstede G., Cultures and Organizations - Software of the
Mind. Intercultural Cooperation and Its Importance
for Survival: Software for the Mind. Mcgraw-
HillProfessional, 1991.
ITIL , “Einführung in ITIL,” Tech. Rep., 2005.
Ives B. and Olson M. H., “User Involvement and MIS
Success: A review of Research”, Management
Science, Vol. 30, No. 5, pp. 586–603, 1984.
Kaasinen E., User acceptance of mobile services - value,
ease of use, trust and ease of adoption. VTT
Publications, 2005.
Keen P. G. W., “Information system and organizational
change,” Communications of the ACM, Vol. 24, No. 1,
pp. 24–33, 1981.
Kornak A., Teutloff J., and Welin-Berger M., Enterprise
Guide to Gaining Business Value from Mobile
Technologies. Wiley, 2004.
Lucas H. C., “Systems quality, user reaction and the use of
information systems,” Management Informatics, Vol.
3, No. 4, pp. 207–212, 1974.
Nielsen J., “Usability return on investment,” Nielsen
Norman Group Report,
http://www.nngroup.com/reports/roi/, Report, 2003.
Nielsen J., Usability Engineering. New York: AP
Professional, 1993.
Pedersen P., Methlie L., and Thorbjrnsen H.,
“Understanding mobile commerce enduser adoption: a
triangulation perspective and suggestions for an
exploratory service evaluation framework,” in HICSS-
35, Hawaii, US, 2002, pp. 1–8.
Pousttchi K. and Thurnher B., “Adoption and impact of
mobile-integrated business processes - comparison of
existing frameworks and analysis of their
generalization potential,” in Proceedings of
Internationale Tagung Wirtschaftsinformatik,
Oberweis A., Weinhardt C., Gimpel H., Koschmider
A., Pankratius V., and Schnizler B., Eds.
eOrganisation: Service-, Prozess-, Market-
Engineering. 8. Internationale Tagung
Wirtschaftsinformatik. Bd. 1, Karlsruhe, 2007, pp.
273–290.
Robey D. and Farrow D., “User involvement in
information system development: A conflict model
and empirical test,” Management Science, Vol. 1, pp.
73–85, 1982.
Rouse W. B., Enterprise Transformation: Understanding
and Enabling Fundamental Change, Wiley Series in
Systems Engineering and Management ed. Wiley-
Interscience, 2006.
The Standish Group, “Chaos report,” online, 2001.
Wang Y., van de Kar E., Meijer G., and Hunteler M.,
“Improving business processes with mobile workforce
solutions,” ICMB, Vol. 1, pp. 94–102, 2005.
Ward J. and Peppard J., Strategic Planning for
Information Systems. John Wiley & Sons, 2002.
MAKING USE OF MOBILE DEVICES IN E-COMMERCE - Overcoming Organizational Barriers through User
Participation
173
