
A USER INTERFACE FOR EXPLOITING WEB COMMUNITIES
IN SEARCHING THE WEB
Kemal Efe, Alp V. Asutay
Center for Advanced Computer Studies, University of Louisiana Lafayette, LA 70504, U.S.A.
Arun Lakhotia
Center for Advanced Computer Studies, University of Louisiana Lafayette, LA 70504, U.S.A.
Keywords: Web navigation, interaction styles for data mining, graphical user interfaces, screen design, prototyping,
theory and methods.
Abstract: We have implemented a novel user interface for Internet search engines that allows users to visualize the
graph neighborhoods of search results returned. When the required information is not in the returned result
set, it is likely that there is a path from one or more of the returned documents to another document that has
the required information. Our proposed interface allows exploring these paths. We performed experiments
to measure users’ level of success in finding desired information. Given equal time to perform a set of
search tasks, on average, the users of our interface were able to find twice as many of the required
documents as the users of a traditional interface, using the same underlying search engine. We also found
that, on average, users of the proposed interface tried 31% fewer queries per search task.
1 INTRODUCTION
Existing search engines predominantly use the
query-response paradigm for information retrieval.
For a variety of reasons, documents with the
required information may be ranked low, and users
may fail to reach required information despite many
attempts of revised query submissions. Additional
interface tools are needed for users to take control of
the search direction instead of relying on the
algorithms used by the search engine alone.
This paper describes the user interface of a
search engine that we designed, built, and user-
tested. In this system, a user can start with an initial
list of search results and explore the graph
neighborhoods of returned documents by using
interface controls provided. Our user experiments
with the proposed interface yielded highly
encouraging results.
A basic result of earlier research on link-based
information retrieval algorithms such as HITS
(
Kleinberg, 1999) is that topically related documents
are clustered in tightly knit communities in the web
graph (see Figure 1). If the list of search results
contains any subset of members from a community,
it is likely that other members of the same
community are also relevant. The initial result list
provides good starting points to explore the web
graph since the listed entries can be used as entry
points to their communities. If users are provided
with the right set of tools, they can reach desired
documents on a subject more easily by following the
graph links rather than by reformulating and
resubmitting queries iteratively.
Figure 1: The structure of a typical web community.
The proposed interface enables visualizing the
graph neighborhoods in multiple levels of resolution,
switch between different levels, and trace the links
backward and forward to explore a selected region.
114
Efe K., V. Asutay A. and Lakhotia A. (2008).
A USER INTERFACE FOR EXPLOITING WEB COMMUNITIES IN SEARCHING THE WEB.
In Proceedings of the Fourth International Conference on Web Information Systems and Technologies, pages 114-121
DOI: 10.5220/0001530001140121
Copyright
c
SciTePress

2 RELATED WORK
Most users of Internet search engines write short
queries which tend to generate high hit counts. In
addition, there are a large number of documents on
the web that are really relevant to a user query in
some sense or other. Besides retrieval algorithms,
search engines rely on a variety of additional
mechanisms to aid users. Once a list of top hits is
determined, a further step of clustering the results
(e.g. as in Vivisimo.com) can aid users to focus on
the sub-clusters of interest.
The LightHouse project (Leouski and Allan,
2000) displays clusters of search results graphically,
with each item in the search results represented by a
sphere. The Mapuccino (a.k.a. WebCutter) system
(Maarek et al., 1997) displays the link structure at a
web site selected by user with page ranks displayed
at each node. Other similar examples include the
WebCiao (Chen & Koutsofios, 1997) Web Mapper
(www.web-mapper.com), and WebView (Cockburn,
1999). Differently, the Hy+ system (Hasan et al.,
1995) displays a graph representing the portion of a
web site explored by a user.
The PadPrints system (Hightower, et al., 1998)
displays the visited pages in a tree structure so that
users can easily locate a page visited before. The
WebMap project (Doemel, 1994) and the
ViewBuilder project (Mukherjea and Foley, 1995)
are general-purpose graphic tools for visualizing
web graphs. In particular, ViewBuilder allows
alternative methods of displaying the history graph,
including hierarchical clusters, content-based
clusters, and link-based clusters.
Figure 2: Document Space graph and Index Space graph.
Other interesting systems include the Hogdex
system (http://www.hogdex.com), Gnovies (http://
www.gnovies.com), and TouchGraph (http://
www.touchgraph.com). TouchGraph is a powerful
Java graphics tool that has been applied to a number
of Internet visualisation projects, including
GoogleBrowser which displays a graph of similar
pages as defined by Google “similar pages” criterion
(http://www.touchgraph.com/tggoogleBrowser.html.
None of these interfaces give the user much
more control than what is already available through
a standard search engine. In particular, they don’t
provide any tools for the user to guide the search
engine in the right direction.
3 PROPOSED SEARCH MODEL
The concept of web graph is well understood in the
literature. The nodes of the web graph represent web
pages. The edges on the web graph represent
Hyperlinks on web pages. We call this graph the
“document space graph,” or DSG.
As our search engine indexes and saves web
pages, it creates another graph that we call “index
space graph,” or ISG. In this graph, each node
represents Meta data saved about a web page. This
Meta data comprises the usual information (e.g. page
title, description, etc.) displayed about a web page
when the page is included in a search results list.
The edges in ISG are copied from DSG. Figure 2
illustrates the relationship between ISG and DSG.
An important difference between the two graphs
is that edges in DSG are directed in only one way
from the citing page to the cited page. These edges
allow a surfer to move from one page to another
page that it cites, but not in the opposite direction. In
ISG, all edges are directed both ways to allow
moving between two nodes in either direction with
equal ease.
3.1 Surfing the Index Space Graph
In the proposed system, a user initially starts by
entering a search query and retrieves a list of search
results. Each entry in this list is essentially a node
from the ISG. Each entry is associated with a set of
outgoing links and a set of incoming links that
enable surfing the ISG. Figure 3 represents the
immediate the web neighbourhood of a node, where
the “start node” represents one of the listed items in
the search results list.
In implementation, the ISG is stored in two
database tables: a nodes table and a links table.
Since a link is specified by its “head” URL and its
“tail” URL, the outgoing links and incoming link of
a node are retrieved easily. If displayed along with
other information about a web page (we discuss
display methods in more detail in Section IV), these
A USER INTERFACE FOR EXPLOITING WEB COMMUNITIES IN SEARCHING THE WEB
115

two sets of links allow a surfer to explore the ISG
effectively, going backward or forward as needed.
During a search, a single step of backward or
forward move may not be enough. A user may wish
to repeat this process an arbitrary number of times,
and explore a large region in ISG. Figure 4
represents the wider neighbourhood of a node that
can be explored by starting with the “start node” of
Figure 3. This wider neighbourhood is defined by
iteratively considering the immediate neighbours of
the start node as new “start nodes.”
Figure 3: Web neighbourhood of a document in ISG.
Figure 4: Extended neighbourhood of a document.
3.2 Surfing the Two-Level Graph
During a search, a user can also switch between ISG
and DSG graphs at will. After locating an entry in
the initial search results list that looks like it might
contain the desired information, a user can select the
corresponding document. This moves the user from
a node in ISG to a document in DSG. Once on DSG,
the user looses the ability to move backward from a
cited page to a citing page. If the required
information is nearby, the user may be able to reach
it after a few clicks. If this turns out to be a wrong
move, the user needs a mechanism to switch back to
ISG. Clicking the “back” button of the web browser
is one way, but often insufficient. Instead of the last
point of departure at the ISG, user may wish to move
to a different neighbourhood, for example a set of
documents similar to the current page.
To implement this feature, a tool bar associated
with the web browser can be used to submit a query
to the search engine that will retrieve a list of related
pages; e.g. by using an algorithm such as the one
proposed by Dean & Henzinger, (1999).
3.3 Orientation Support
During exploration in ISG, users need to be able to
orient themselves so as to return to a prior decision
point and try alternative paths. To provide
orientation, the interface must gracefully scale the
neighborhood displayed where the complexity and
comprehension meet at a satisfactory level for the
user. Rendering a large graph may make the display
incomprehensible. On the other hand, rendering only
the immediate neighborhood of a document will not
let users to identify their position. The neighborhood
moves as the user moves on the ISG so the user will
only be aware of the current locality. The system
must also construct a trace, and provide clues of
different paths to reach that position. The user must
be able to select the previously explored
neighborhoods or distant regions that are at least two
steps away backward or forward.
Figure 5: Multi Level Search Interface.
The trade-off between scalability and
comprehension can be resolved if the interface
provides multiple scales of resolution where levels
are rendered starting from an abstract representation
with an option to retrieve detailed representation of
WEBIST 2008 - International Conference on Web Information Systems and Technologies
116

selected regions. There needs to be a cross
communication between levels to pass the ISG state
information.
Figure 5 describes the hierarchy starting from the
base (page) level up to the third level. The third level
is the conceptual path in the mind of a user. The
second level is the ISG, where the interface renders
all the neighborhood nodes created incrementally so
far. The interface also shows the current vicinity of
the user as a clue for orientation. In the first level
interface, user sees the immediate neighborhood
around the selected node. Each circle in the second
level is associated with a region rendered in the first
level.
In the proposed system, the interaction state of a
user is characterized by his/her current orientation,
which is defined by the currently selected node and
trace history. When switching between different
levels of abstraction, state information needs to be
cross-communicated. Whenever the user surfs
backward, forward or jumps to a particular node on
the ISG, orientation has to be modified in all the
levels of the hierarchy.
When a user selects a particular region on the
second level interface, the first level interface
renders that region. The cross communication in that
case is a “zoom in” operation that commands the
lower level interface to render that particular region.
In a similar manner, user can switch from the first
level interface to the base level. The base level is
rendered when the ISG node is selected using either
first level interface or second level interface. The
hierarchic structure of the multi-level model does
not require a zoom-out operation because the outer-
level neighborhood is continuously rendered at a
dedicated region of the screen.
4 IMPLEMENTATION
4.1 Display Structure
As explained, our proposed navigation model is
based on tracing the edges of a graph structure. The
main question here is what method of display to use
so that users can effectively trace the graph
structure. There is a trade off
between using text and
graphics in terms of the ability to convey
information. Graphical interfaces are useful for
visualising topical relationships between documents,
but there is a loss of information that can be carried
by words more effectively. Often, information
carried by text is difficult to codify in a graphic
display.
From the ergonomics point of view, users need
not know that they are tracing the edges of an
underlying graph structure. Graphs or other
mathematical representations may not appeal to
users with insufficient analytical skills to interpret or
comprehend displayed objects. On the other hand,
text-based display methods are inherently poor for
effective navigation since inter-node relationships
are harder to represent without the aid of graphics.
As a compromise, in the implemented system we
provide a text-based interface and a graphical
interface. The user initially starts with the text-based
interface, and if needed, switches to the graphics-
based interface to explore the web neighbourhood of
a node in detail.
4.1.1 Text-based Neighbourhood Support
In the text-based interface our design uses the
traditional components for each entry in the result
list. In addition, we added new controls to allow
moving from an ISG node to one of its graph
neighbours. We also added an image or logo derived
from the web page being represented by the entry.
The purpose of these images is to provide a mental
hook for the users so that they can easily remember
a familiar web site when they see it again among the
search results.
Figure 6: Screen-shot of a sample entry in search results.
Here the task is to convey the basic idea of
Figure 3 about each entry without using a graph
explicitly. We do this by associating each entry in
the search results with two sets of hyper links as
shown in Figure 6: one set of Hyperlinks for the
pages cited by the entry, another set for the pages
that cite the entry. The nodes in these sets are also
represented by images derived from their
corresponding pages. Due to limited screen space we
limit the number of graph neighbours in each set to
six, selected after sorting them by their relevance to
A USER INTERFACE FOR EXPLOITING WEB COMMUNITIES IN SEARCHING THE WEB
117

the user query. When clicked, these Hyperlinks
retrieve their corresponding web pages. This moves
the user from ISG to DSG.
There needs to be a mechanism for users to stay
in the ISG and continue exploring the
neighbourhood without moving to DSG as in Figure
3. This requires a basic step of moving from an ISG
node to a neighbouring ISG node with both nodes
and their neighbourhoods displayed. With a text-
based interface this is difficult to achieve. Besides
scalability (the ability to repeat the same display
method for subsequent moves), comprehensibility of
inter-node relationships is difficult to maintain.
Therefore, we decided on an indirect method for
moving between ISG nodes as follows: Associated
with each entry, we provide two Hyperlinks labelled
“links-to” and “cited-by,” which retrieve
corresponding sets of nodes, as implied by their
names. For example, clicking on “cited by” in
Figure 6 retrieves the list of web sites cited by the
Hallmark web site. Each item in the retrieved list is
associated with its own “links-to” and “cited-by”
Hyperlinks. This mechanism allows moving from
one ISG node to another ISG node, repeating this
process an unlimited number of times.
4.1.2 Graphical Neighbourhood Support
Associated with each item in the search results list,
we provide a Hyperlink labeled “Explore Graph.”
This Hyperlink opens a new search interface as
shown in Figure 7. Space restrictions don't permit
including a screen shot large enough to meaningfully
represent all its features, so we show a schematic
drawing in Figure 7 of available components in it. In
this window, display area is divided into three
regions that contain the four components below:
1. Bird’s-Eye View: The bird’s-eye view displays the
largest region of the ISG graph traced by the user,
but it displays the least amount of detail. When the
window is first opened, it displays the immediate
neighborhood of the selected ISG node as in Figure
3. To save screen space we omit displaying links.
Each node is represented by a box containing its
URL. The central node of Figure 3 is highlighted
with a red frame around it. The nodes citing the
central node are displayed as a row of boxes on its
left, ordered by their relevance scores with respect to
the user query so that more relevant nodes are closer
to the central node. The nodes cited by the central
node are displayed on its right, ordered similarly.
Once the window is opened, the bird’s eye view
graph can grow arbitrarily large. The mechanism of
growth is by creating further neighbourhood plots as
in Figure.3 with their central nodes chosen from
among nodes already displayed and connecting with
the rest of the graph. This process creates two copies
of a node displayed; one as a member in some other
node’s neighbourhood, and one as the central node
in its own neighbourhood. The new neighbourhood
plot is added to the existing graph as a new row of
boxes. The new row is justified so that its central
node is vertically below its position in the original
graph where it appears as a member. To further
highlight this relationship, the two copies of a node
are connected by a vertical line (area-1 in Figure 7).
2. Detail View: By selecting a node in bird’s-eye
view, a user can display detailed information about
the immediate web neighbourhood of an ISG node
(see area-2 in Figure 7.b). Here a description is
provided about each document. The central node of
the neighbourhood is displayed at the top. The set of
nodes citing it are displayed in a column below-left
from the central node, and those cited by it are
displayed in a column below-right from the central
node. Since the screen space is limited, only four
nodes are displayed from each set, but scroll buttons
are provided so that user can change the subset of
nodes displayed from each set.
Figure 7: Graphics-based display overview.
A user can move backward or forward to a
neighbour of the central node by clicking on the
arrowhead next to the neighbour. When this
happens, the detail view refreshes so that the
selected node moves to the top, with its immediate
neighbours displayed on its left and right, as before.
The bird’s-eye view also refreshes to add the new
neighbourhood, if not already included in the bird's-
eye view graph.
3. Trace History: This is the trace history diagram
(see area-3 in Figure 7.b) of the visited documents,
i.e. appeared as the central node in detail view area.
WEBIST 2008 - International Conference on Web Information Systems and Technologies
118

The trace is rendered as a zigzag chain based on the
forward and backward movements on the ISG. Each
node contains a description of the document it
represents.
4. DSG Window: This is a small, framed window
(see area-4 in Figure 7.b) displaying the content of
any selected document. This is useful when a user
wants to take a peek at the web document without
leaving the displayed graph structure. Since this
window is small, scroll bars are provided to see the
page.
5 USER EXPERIMENTS
We tested user’s level of success in finding
information with the proposed interface and
compared it with users provided with a traditional
interface (as in Google interface) both using the
same underlying search engine.
5.1 Test Subjects
Each user group consisted of 25 computer science
graduate students, randomly assigned to their
groups. In a questionnaire that we asked them to fill,
they all said that they used search engines on a daily
basis, and are familiar with the task. However, none
of them had ever seen the specific search engines
they were asked to use. Before the tests, we gave
each user group 15 minutes to “play with” the search
engine they were to use and familiarise themselves
with different controls provided by the interface.
Our suggestion was received with puzzled looks by
the group using the traditional interface, as though to
say “what is there to familiarize with,” but the group
using the proposed interface were quite busy trying
different features not found in other search engines.
We provided no additional training for either
interface users since we felt that users in the real
world don't receive any special training either.
5.2 Test Environment
We built a search engine as a test bed for
experimental use in our research projects (see
http://www.chabook.com/graphical/search.aspx). It
originally started as a web directory in April 2004.
In August 2004 a Meta search service was added
(available at http://www.chabook.com). In January
of 2005, a prototype search engine with its own
crawler was added to support various research
projects, because the Meta search engine does not
provide the link information needed for our model.
The search engine’s database contains 200,000
documents connected by about 2 million Hyperlinks.
These nodes and links constitute the ISG graph
described in this paper. The system uses MySQL
database and its built-in full-text search algorithms
based on the Vector Space Model. The documents
were obtained by starting with 55,000 documents
downloaded from the “reference” section of the
Open Directory Project (http://www.dmoz.com), and
then by crawling the neighbourhoods of this initial
set of documents. As we traced the outgoing links of
the initial document set, we added newly discovered
nodes to the database until the number of documents
reached 200,000.
For the purpose of experiments we built two
different interfaces, both using the same underlying
search engine. One is a traditional style interface like
the user interface of Google. The other is the
interface described in this paper. The test subjects
were only told to carry out the search tasks given to
them by using the interface provided, but they were
not told about the alternative interface they were not
using. Both groups were given the same set of
search problems, and the same amount of time to
complete the search tasks.
5.3 Test Procedures
Test subjects were given a number of search tasks
and a limited time to perform the required searches.
Since two groups of test subjects are used, one with
the proposed interface and the other with a
traditional Google-like interface, the group that can
perform more number of successful searches within
the given time must have been more effective. Since
the underlying search engine was the same for both
groups, and the test subjects were equal in
intellectual capacity, any performance difference is
due to the interface used.
Test 1-Document Search:
Duration of this test was 60 minutes for both user
groups. In this test, the test subjects were asked to
find a set of 10 documents based on a brief
description of the information content on the page.
Test questions all started with the statement “Find a
document that…” followed by a description of the
document as specifically as possible. They were
asked to record the page URL when they think they
have found the correct page.
This is a realistic scenario of search engine usage
in real life since users start with an idea about the
desired information content of a page that satisfies
their information needs. We selected the target
documents in the test by querying the search engine
A USER INTERFACE FOR EXPLOITING WEB COMMUNITIES IN SEARCHING THE WEB
119

with the set of queries below before the test,
inspecting the search results, and choosing one of
the entries on the first page of search results.
1. Thematic world maps
2. Science and Religion
3. Science Fiction Term definitions
4. Prehistoric Monuments
5. Baseball discussion forum
6. Agriculture Software Package
7. Library and information science news
digest
8. African Diaspora Web Pages
9. Internet sites archive, digital library of
archived internet sites
10. Antique Maps and Prints + Cartography +
Collecting Society
Test subjects were not given this list, or the
specific URLs of documents they were to find.
Instead, they were told to find documents with the
required information based on provided descriptions.
They were told to use any query they saw
appropriate while doing their searches.
Test 2-URL Search
Duration of this test was 30 minutes for both user
groups. Users were asked to perform searches as
they saw appropriate on the subject “used books”
and see how many of the URLs listed in Table 1
below they come across during their search. The
subjects were instructed to indicate the ones they
found by circling the entry on the list.
Table 1: List of URL’s used in the second test.
5.4 Test Results and Discussions
The purpose of Test-2 is to validate the first test.
We anticipated some degree of difficulty in
interpreting the user answers from the first test,
because the same information may be available on
several different sources. During a test, users may
find any one of these pages and think that they have
found the correct one. This complicates the
interpretation of responses given. We would have to
make judgements about what to consider a correct
answer. In real life, users search for information
rather than documents. A user seeking information
doesn't care which of the several possible sources
contain the information. Thus we felt that we should
consider a URL as a correct answer if the page
substantially meets the specifications provided its
description. Still, it would be difficult to justify
using our judgements in evaluating user answers.
Figure 8: Number of documents found box plot (Test-1).
Figure 9: Number of documents found box plot (Test-2).
Given these concerns, we wanted to validate our
interpretations of user answers by a method that did
not depend on our judgement. For this purpose, we
designed Test-2 since in this test there is no
uncertainty about correctness of a URL found. If the
same user group performs better than the other
group in both tests to an equal degree, then our
interpretation of test results must have been without
bias. We note that our methodology of using two
tests, one to validate the other, is novel. Although
addall.com bookspot.com edif-spectacle.org
booktalk.com biblio.com bkdirectory.com
resourcehelp.com iblist.com fetchbook.info
bksalefinder.com irabooks.com zulbabooks.com
smith.tripod.com dig-librarian.com bookwire.com
bookrecycler.org cl-resource.com abaa.org
pbfa.org bookfinder.com booksweep.com
WEBIST 2008 - International Conference on Web Information Systems and Technologies
120
interpreting user answers is always open to
subjectivity, none of the previous researchers
validated their evaluation of user answers.
In both tests, users of the proposed interface
found significantly more number of the required
documents when they were given equal time.
Figures 8 and 9 show these results by using box-plot
graphs. As can be seen in Figure 8, the median value
of correct answers given by test subjects who used
the proposed interface is 8 while the mean value is 4
for the users that used the standard interface.
In the second test, the mean values were 10 (out
of 21 URLs) for the users of proposed interface and
6 for the users of traditional interface. The strong
agreement of outcomes in the two tests demonstrates
the validity of test procedures, and the outcome
strongly supports the original hypothesis of this
research.
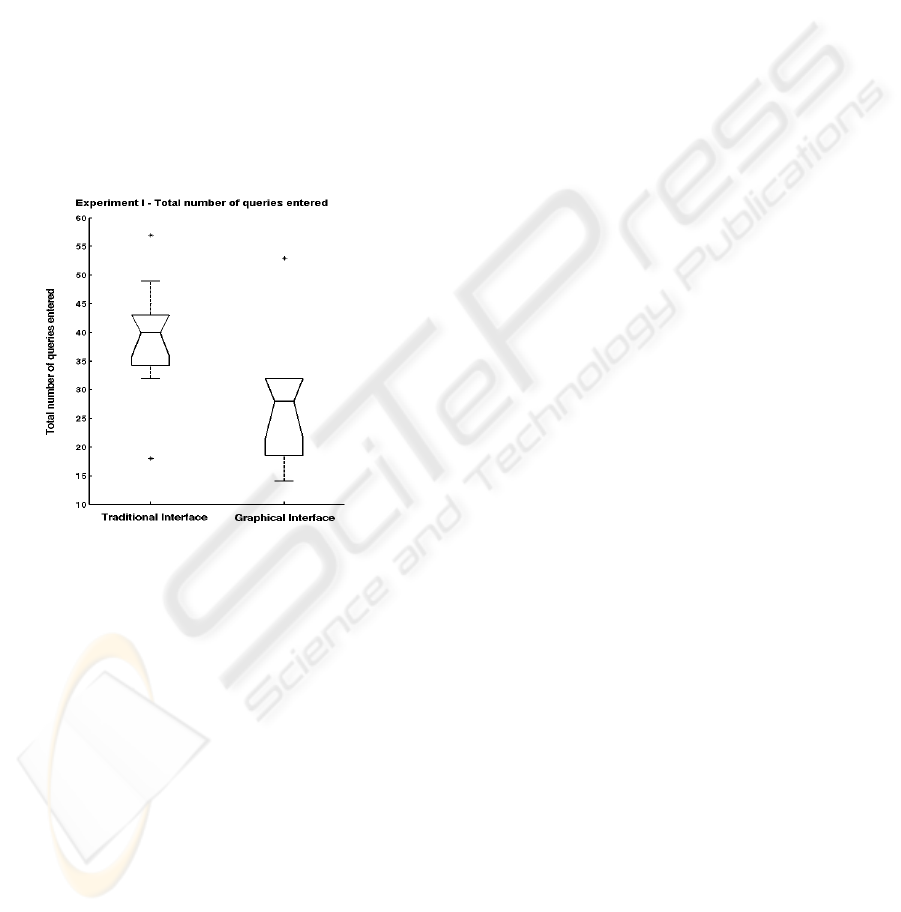
Figure 10: Total number of queries entered box plot.
During the experiments, we logged the activities
of test subjects to record the number of queries they
tried. Figure 10 compares the number queries test
subjects tried during the first test. The outcome for
the second test was similar. Here the numbers on the
vertical column shows total number of queries tried
by a user for 10 search tasks. Even though they
found substantially more of the required pages, users
of the proposed interface tried substantially fewer
queries than users of the traditional interface. These
results imply that users were able to navigate to the
correct document even starting from a sub-optimal
initial search results list.
6 CONCLUSIONS
For any document of non-trivial content, there is
always a query that returns it among the top results,
but the query required to retrieve a document may
not be one that a user would think to use, at least
initially, if ever. The fact that users of our proposed
interface completed more successful searches while
writing fewer queries implies that future systems
designed along these ideas can be more satisfactory
for users.
REFERENCES
Chen, Y-F., Koutsofios, E. (1997). WebCiao: A Website
Visualization and Tracking System. Proceedings of
the World Conf. on the WWW and Internet
(WebNet97). Toronto Ontario, AACE, Norfolk, VA.
Cockburn, A., Greenberg, S., Mckenzie, B., Jasonsmith,
M., and Kaesten, S. (1999). WebView: A Graphical
Aid for Revisiting Web Pages. Proceedings of the
Australian Conference on Human Computer
Interaction, (OzCHI’99). Wagga Wagga, Australia,
November 28-30. IEEE Press, Piscataway, NJ, 15-22.
Dean, J. and Henzinger, M. R. (May 1999). Finding
Related Pages in the World Wide Web. Computer
Networks, 31, 1467-1479.
Doemel, P. (1994). WebMap - A Graphical Hypertext
Navigation Tool. Proceedings of the 2nd International
World-Wide Web Conference (WWW ‘94). Chicago, IL,
USA. ELSEVIER Science, Toronto, Canada, 1994, 785-789.
Hasan, M., Mendelzon, A., and Vista, D. (1995). Visual
Web Surfing with Hy+. Proceedings of the 1995
Conference of the Centre for Advanced Studies on
Collaborative Research (CASCON'95). Toronto,
Ontario, Canada, November 7-9. IBM Press,
Lewisville, TX, 1995, 218-227.
Hightower, R. R., Ring, L., Helfman, J. I., Bederson, B.
B., Hollan, J. D. (1998). Graphical Multiscale Web
Histories: A Study of Padprints. Proceedings of the
9th ACM Conference on Hypertext and Hypermedia
(HYPERTEXT ‘98). Pittsburgh, PA, USA, June 20-24.
ACM Press, New York, NY 58-65.
Kleinberg, J. (1999). Authoritative sources in a
Hyperlinked environment. Journal of the ACM, 46, 604-632.
Leouski, A., Allan, J. (2000). Improving Interactive
Retrieval by Combining Ranked List and Clustering.
Proceedings of Computer Assisted Information
Retrieval Conference (RIAO ’00). Paris, France, April
12-14. Springer Verlag, New York, NY, 2000, 665-681.
Maarek, Y., Jacovi, M., Shtalhaim, M., Ur, S., Zernik, D.,
and Shaul, I. B. (1997). WebCutter: A system for
dynamic and tailorable site mapping. Proceedings of
the 6th International World Wide Web Conference
(WWW ‘97). Santa Clara, CA, USA, April 7-11.
ELSEVIER Science, Toronto, Canada, 713-722.
Mukherjea, S., and Foley, J. D. (April 1995). Visualizing
the World-Wide Web with the Navigational
ViewBuilder. Computer Networks and ISDN Systems,
27, 1075-1087.
A USER INTERFACE FOR EXPLOITING WEB COMMUNITIES IN SEARCHING THE WEB
121
