
INTERACTIVE RECONSTRUCTION AND VISUALIZATION
OF DYNAMIC 3D ULTRASOUND DATA SETS
Timo Ropinski
1
, Borislav Petkov
1
, Larissa Fabritz
2
and Klaus Hinrichs
1
1
Visualization and Computer Graphics (VisCG) Working Group, University of M
¨
unster
Einsteinstraße 62, D-48149 M
¨
unster, Germany
2
Department of Cardiology and Angiology, University Hospital of M
¨
unster
Albert-Schweitzer-Straße 33, D-48149 M
¨
unster, Germany
Keywords:
Ultrasound acquisition, volumetric reconstruction.
Abstract:
In this paper we describe techniques which have been developed in order to interactively visualize dynamic 3D
ultrasound (US) volume data sets acquired using a small animal 2D US scanner. The 2D frames are acquired at
different spatial positions and gated based on the ECG signal. For the reconstruction process a user interface is
specified, which allows the user to select 2D frames acquired during different ECG phases at different spatial
locations. Thus it is possible to reconstruct and visualize a volumetric model based on several 2D frames for
different phases of the heart cycle. To improve the interactive visualization, we facilitate filtering techniques,
which have been implemented on the GPU.
1 INTRODUCTION
Medical imaging has the intent to harness the ever-
growing graphics computing power of modern archi-
tectures for the visualization of medical data. A ma-
jor goal is the visual analysis of images of biologi-
cal objects acquired with different medical scanning
technologies such as CT, MRI or PET. One impor-
tant application of medical imaging is cardiac and car-
diovascular research. According to the World Health
Organization, cardiovascular diseases (CVDs) are the
number one cause of death globally, representing 30%
of all global deaths (Organization, 2006). There-
fore researchers need to better understand the func-
tions and processes of the heart in vivo. Non-invasive
small-animal imaging techniques have a great po-
tential to allow a better understanding for both re-
searchers and physicians in the inquiry and prophy-
laxis of cardiovascular diseases. The potential of a
system allowing an easy reconstruction and visualiza-
tion of medical data is immense and lies primarily in
its ability to support the members of the physicians in
their decision-making process concerning proper pa-
tient treatment and disease prophylaxis by visualizing
internal structures. In addition, a 3D visualization has
benefits in contrast to classic 2D visualization sys-
tems. For instance, when visualizing a dynamic 3D
heart, a physician is able to make accurate and reliable
3D observations of heart movement and ventricle de-
formation during a heart cycle as well as volumetric
measurements.
Although US technology is used in a large number
of biomedical imaging areas, the registration and vi-
sualization of moving internal structures such as heart
ventricles and blood flow or prenatal fetal facial fea-
tures are among the more prominent examples. Con-
sequently, the automatic generation of 3D US volume
data from moving biological structures scanned at a
high resolution adds to the complexity of the task of
volumetric visualization primarily because of the in-
coherency of the single 2D scan slices with respect to
creating a static volume out of them, and secondly, be-
cause of the relatively high speed of movement of cer-
tain organs. Therefore, a certain additional alignment
measure has to be introduced in order to be able to
create coherent volume representation of organs from
slice scans of moving tissue.
In this paper we propose an interactive visualiza-
tion system, which allows to acquire dynamic volu-
metric ultrasound (US) data sets by using a 2D scan-
ner. In particular we describe the preprocessing as
well as the visualization of raw US data and explain
how a user can interactively create and manipulate
volumetric data sets originating from 2D US B-scan
slices. Therefore the 2D US B-Mode scan data and
metadata is analyzed and prepared for display. De-
308
Ropinski T., Petkov B., Fabritz L. and Hinrichs K. (2008).
INTERACTIVE RECONSTRUCTION AND VISUALIZATION OF DYNAMIC 3D ULTRASOUND DATA SETS.
In Proceedings of the Third International Conference on Computer Graphics Theory and Applications, pages 308-315
DOI: 10.5220/0001097003080315
Copyright
c
SciTePress

pending on the type of the scanned data, the user
may choose between automatic generation of a vol-
ume data set or an interactive generation. Due to the
relatively noisy nature of the US data, several filtering
techniques are applied in order to improve the visual
quality of the data and remove artifacts introduced by
the acquisition procedure.
2 RELATED WORK
US has been used in many medical subdomains, as
for instance prostate and heart examinations (Gee
et al., 2003). Fenster and Downey give an exten-
sive overview over developments in 3D US technol-
ogy and visualization (Fenster and Downey, 2000).
Thus, several techniques for US data acquisition with
the purpose of creating volumetric data sets have been
developed up until now. Gee et al. (Gee et al., 2004)
divide these techniques into two major categories. On
the one hand, volume data sets can be generated by
utilizing a dedicated US 3D probe which can scan
a fixed-size volume from a short distance. On the
other hand, conventional 2D US transducers can be
employed for the generation of arbitrarily-sized scalar
fields. But the latter case requires the process of vol-
ume reconstruction and temporal and lateral 2D frame
synchronization. In addition, the irregular spatial dis-
tribution of the 2D slices adds additional complexity
to the process which may result in different scan re-
sults of the same anatomical structure under differing
directions of sonification. Gergs et al. (Gergs et al.,
2004) have shown that besides 3D US data sets, 2D
data sets have also the potential to show clear silhou-
ettes for certain application cases.
The side-fire probe which is used for acquiring cir-
cular B-scan slices forming cylindrical data sets (Gee
et al., 2003) is similar to the technique described in
this paper. However, an additional positional sensor is
attached to the transducer head whose constant input
is used for receiving the relative positions and angu-
lation of each 2D slice and then aligning them within
the volume cuboid during volume generation (Fenster
and Downey, 2000).
To improve the visual quality of the acquired data
sets, different filtering techniques can been used. In
(Sakas et al., 1994), Sakas et al. have attempted to
evaluate the deployment of a combination of several
low-pass filters for improving the quality of visual-
ized US data sets through filtering. In their work,
they have used a 3D Gaussian filter for noise/speckle
reduction and a 3D median filter for additional con-
tour smoothing and small gaps closing caused by mis-
alignment of consecutive B-scan slices. They claim
that the results of this undertaking has been encour-
aging, but still see room for improvement by mod-
ifying the filtering technique and adjusting it to the
nature of the US signal. Besides the application of
Gaussian filters, the BLTP filtering technique (Sakas
and Walter, 1995) has been developed specifically for
the purposes of filtering US volume data. However,
discussing these filters in detail is beyond the scope
of this paper and we refer to (Gonzalez and Woods,
2001) for more information.
3 SYSTEM SETUP
In our system setup we use a VisualSonics Vevo 770
small-animal US scanner for scanning mice in vivo. It
provides most common US scan modes, and supports
ECG-gated acquisition of 2D slices. It allows multi-
ple types of physiological measurements on animals,
from which we have used the ECG signal. Addition-
ally, the Vevo 770 scanner performs respiration gating
by acquiring data only during the rest sub-period in
the respiration cycle. In doing so, excessive moving
artifacts caused by the heaving of the chest cavity of
the animal are obviated.
We use a special scanning mode which is a pro-
prietary variant of an ECG-gated scanning procedure.
The so-called EKV (ECG-based Kilohertz Visualiza-
tion) mode is a scanning technique, during which
multiple B-Mode images from consecutive heart peri-
ods are acquired and interpolated into a single, com-
plete heart period of the animal (VisualSonics, 2005).
Thus a complete heart period is represented by a set of
frames for each lateral position. Therefore, in using
the EKV-Mode in this paper, the creation of precise
volume ”stills” of the scanned organ simplifies the
frame synchronization routine significantly. Thus, by
choosing the corresponding frames out of each syn-
chronized frame set recorded at each lateral position,
a volume data set can be created for each phase of the
heart cycle. Subsequently, the volume data sets re-
constructed in this manner comprise a whole dynamic
data set collection.
In order to acquire an EKV cine loop of the heart
period, the scanner needs proper ECG-data from a
probe attached to the animal. This is accomplished
by sensing the animal’s heart rate from four small
fields on the warmer plate where the mouse is fas-
tened. Constant monitoring and supervision of the an-
imal’s vital signs and telemetry is required. Addition-
ally, the animal’s temperature is monitored through a
signal delivered by a small rectal probe connected to a
module responsible for monitoring the overall physio-
logical condition of the scanned animal. Additionally,
INTERACTIVE RECONSTRUCTION AND VISUALIZATION OF DYNAMIC 3D ULTRASOUND DATA SETS
309

the respiration rate of the animal is derived from its
ECG signal and also delivered to the monitoring unit.
For proper ultrasonic acoustic transmission, the space
between the animal’s chest and the US transducer is
filled with a layer of water-based US gel in order to
diminish the attenuation of the reflected wave signal.
4 INTERACTIVE DATA
PROCESSING
In this section we describe our approach allowing in-
teractive 3D reconstruction of 3D US data sets based
on 2D slices acquired with the system setup described
in Section 3. After the reconstruction has been per-
formed (see Subsection 4.1), image processing tech-
niques are applied in order to enhance image quality
(see Subsection 4.2).
4.1 Volumetric Reconstruction
We support two approaches for reconstructing a 3D
US data set out of 2D slices. First, the standard ECG-
gated automated technique, and second, an interac-
tive technique. As mentioned in Section 1 the au-
tomatic reconstruction, which can be considered as
a well known standard technique, has several draw-
backs. With this technique, 2D scans of the heart
are captured only at designated locations within the
ECG heart cycle, thereby ensuring a relatively coher-
ent volume data set. However, the assumption that
heart form and deformation during each heart cycle
is identical during the whole duration of the acquisi-
tion process is misleading. Firstly, especially in cases
where the heart of the subject is contracting in an ir-
regular manner either due to immediate application
of a medication or to some kind of a heart disease,
each ECG heart cycle differs considerably from the
other, and this results in a large number of incoher-
ence artifacts in the resulting volume. Secondly, addi-
tional external factors such as respirational movement
or movement caused by instability of the biological
object can also cause irregularities in the single scans,
resulting again in incoherent data sets.
Our alternative interactive approach alleviates
these problems during the volume reconstruction by
integrating the user input into the process of selecting
the required number of slices and situating them at
their respective locations in order to construct a volu-
metric data set. In order to do so, the ECG curve of
the heart rate during which the 2D slices have been
recorded is shown. Based on this display, the user can
select an arbitrary slice depending on its position as
well as its location within the heart cycle.
Figure 1: Visualizing the entire sequences of ECG cycles
leads to visual clutter and makes it difficult for the user to
identify a single frame within the whole cycle.
However, displaying the ECG cycle is a criti-
cal task. Therefore, in order to extenuate inco-
herency artifacts in the ECG cycle, the Vevo 770 US
scanner is configured to record high resolution ECG
data throughout the whole B-Mode scanning session.
However, this accumulated high bandwidth of ECG
frames alongside 2D US scans poses another prob-
lem. The length of the recorded ECG data exceeds
largely the length of the period of B-scan recording
because the US scanner keeps as many sequences of
ECG heart cycles as possible for purposes of inter-
polating them all into a spatially precise heart cycle
synchronized with the animal’s ECG. However, this
excessive amount of ECG heart cycles should not be
displayed entirely because the large number of single
ECG frames clutters the display (see Figure 1). In
order to create a usable display of the long ECG se-
quence of multiple heart periods, the interval of ECG
frames is cut off at the points which coincide with the
subinterval between the time stamps of the first and
last recorded frame. Thus we obtain an ECG display
with considerably less cluttering, as it is seen in the
ECG overlay in Figure 2. The blue lines on top of
the ECG curve represent the slices which have been
recorded. The information about each slice is ex-
tracted from the meta data, which is generated by the
scanner. Besides other, this meta data also contains X-
and Y-resolution of each frame, start and end times-
tamps of the ECG data portion so that ECG samples
can be extracted, B-Mode ECG frequency enabling
the accurate positioning of frames in the ECG heart
cycle graph, heart period length and each frame’s di-
mensions in mm with respect to the scanned object.
After a slice has been selected by clicking on the
overlay display, its content can be displayed. In the
case of US slices, a greyscale image containing the in-
tensity values of the US 2D frame is generated and in-
serted into the display. This gives the user the control
over which slices to select for the data set and at which
positions to situate them. Moreover, the additional
display of the slice contents allows the user to addi-
tionally ”prefilter” those slices which, although situ-
ated at a suiting position, contain a large amount of
GRAPP 2008 - International Conference on Computer Graphics Theory and Applications
310
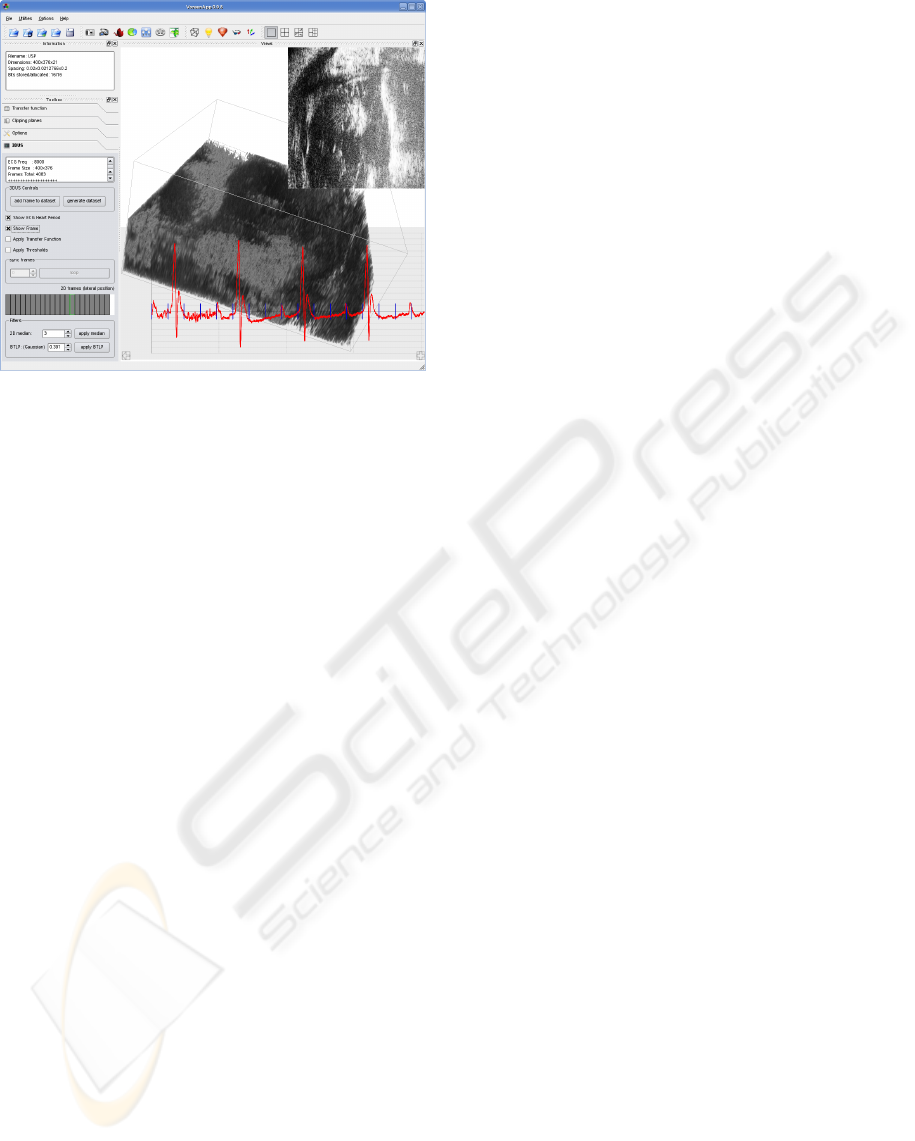
Figure 2: The user interface supporting interactive US
volume reconstruction. The ECG curve is reduced to
avoid clutter and a B-scan frame display overlay is shown,
whereas the frame is enhanced by applying histogram
equalization.
noise and their insertion in the volume would merely
worsen the volume generation with respect to the geo-
metrical consistency of tissue surfaces. After the user
selects the required number of slices, the contents of
each slice are concatenated, combined into a data set
and can be stored and later on visualized.
Figure 2 shows the user interface which is used
for the interactive 3D volume reconstruction. The
text box at the top contains information pertaining to
the current object, be it a volume data set or a sin-
gle frame. The checkboxes below are used for ac-
tivating different auxiliary tools such as ECG heart
period overlay, B-scan frame overlay, application of
the transfer function and the thresholding of the voxel
values. All these features can be applied interactively
by providing immediate visual feedback.
Besides these standard volume visualization con-
trols, the system provides the interaction capabilities
necessary for the volume reconstruction. The shown
synchronization box is relevant for data sets acquired
through Vevo’s EKV-mode and can be used for play-
ing a data set collection dynamically. The custom
widget underneath has been developed to aid the po-
sitioning of single slices within a volume data set. By
selecting one of the rectangular boxes, the user se-
lects to display all frames which the US scanner has
recorded at the corresponding lateral position of the
scanhead. The currently selected position is high-
lighted by the green box contours and only those
frames are visualized on top of the ECG signal, which
have been acquired at the corresponding lateral posi-
tion. After a frame has been selected and its contents
inspected, if necessary, the user can add its raw con-
tents to the data set to-be-created by pressing the ”add
frame to data set”-button above. The current lateral
position is then disabled and the reconstruction can
be continued.
4.2 Image Processing
The US signal has a lower signal-to-noise ratio than
other medical scanning paradigms such as CT or
MRI, and, as a result, visualizing the raw, unmodi-
fied US data delivers data, which can be optimized by
preprocessing. In order to deal with this effect, our
system allows to apply different image processing fil-
ters to the selected slices. The filters can be applied
interactively, and the type of filter as well as the filter
parameters can be chosen using the user interface (see
Figure 2).
We have integrated two kinds of filters: linear as
well as non-linear spatial filters. Although (Sakas and
Walter, 1995) suggests their usage only in a prepro-
cessing step due to their resource-intensive computa-
tion, we were able to perform them interactively, since
the dimensions of the generated US data sets are rela-
tively small.
The linear filters operate in the spatial domain of
the input signal and, as such, are used for blurring and
noise reduction of the image data. Considering the na-
ture of noise artifacts in the US signal, this family of
filters is the most natural approach towards improv-
ing the visualization of US data. What is more, they
remove small artifacts and noise from images which
are very similar in structure and origin to common US
noise and speckle.
Characteristic for all linear spatial filters is that
they compute an intensity value of each pixel based
on the intensities of a number of neighboring pixels
selected by a square filter mask and a linear filtering
function. Based on the latter, these filters are some-
times called averaging filters (Gonzalez and Woods,
2001). Since noise and image artifacts are substanti-
ated in the greyscale intensity distribution of an image
pixel grid as abrupt changes in grey levels, the averag-
ing function applied during filtering brings all values
to an approximate image-wide average whose value
is determined by the surrounding pixel intensities and
the width of the filter mask. Hence, the main effect
of this type of filtering is blurring of image regions
which differ radically from the rest of the image. The
disadvantage of using such filters is that along with
the noise removal, particular image segments such as
edges or contours similar to noise but corresponding
to the edge of a structure are also blurred, although
they are parts of the image that should not be mod-
INTERACTIVE RECONSTRUCTION AND VISUALIZATION OF DYNAMIC 3D ULTRASOUND DATA SETS
311

(a) no filtering (b) arithmetic mean filtering (3 × 3
kernel)
(c) median filtering (3 × 3 kernel)
Figure 3: Application of different filtering techniques to a single lateral slice. From left to right: no filtering, arithmetic mean
filtering and median filtering.
ified. A simple linear spatial filter is the arithmetic
mean filter, which computes the average sum of the
pixels under the filter mask and assigns the resulting
value to the center pixel, in the case of an equilateral
filter mask and in the two-dimensional case:
I(p
j
) =
k
2
∑
i=1
p
i
, p
j
∈ P. (1)
In the above formula, p
i
, p
j
denote pixels in the
set of pixels P belonging to an image and k de-
notes the side length of the equilateral filter mask. A
slight modification of the arithmetic mean filter is us-
ing a mask which assigns to each pixel a different
weight and thus different importance of each pixel
with which it participates in the sum. However, both
filter versions deliver similar results due to the fact
that the filter mask is small relative to the size of the
noise grains in the image. Its application is shown in
Figure 3(b).
The median filter (see Figure 3(c)) is a non-linear
spatial filter, which operates by ordering the pixels se-
lected by the filter mask according to their grey level
intensities, then choosing the median out of them and
replacing with it the pixel intensity at the center of the
filter mask. In comparison to a linear filter a median
filter with the same sized filter mask delivers better
results in noise reduction and results in less blurring.
Thus sharp edges can be better retained in compari-
son to the mean filter (see Figure 3). Thus, we have
reduced the functionality of the user interface to be
able to apply the median filter instead of the mean fil-
ter.
Additionally, we have integrated the BLTP fil-
tering technique originally proposed by Sakas et
al. (Sakas and Walter, 1995). However, unlike their
implementation developed for surface extraction, we
have modified the opacity values to be binarized such
that they are not all positive voxel values but, instead,
they are selected through intensity thresholds which
are dynamically controlled by the user. As a result,
the criterion for removing a voxel value is determined
interactively by a lower and upper threshold within
the interval of the data set intensities. Thus a certain
amount of noise can be removed manually, thereby
improving the interactive rate of the filter’s response.
To adjust and improve the contrast of the separate
US B-scan images whose grey values are positioned
within a low dynamic range, we additionally apply a
histogram equalization.
5 APPLICATION EXAMPLES
The application examples for this paper have been
prepared from US data acquired from scanning sev-
eral laboratory mice specimen with genetically in-
duced LQTS (long qt) syndrome for the purposes of
medicament-based disease prophylaxis. Every ani-
mal’s cardiac section has been extensively scanned
while under light sedation, and the procedure has been
executed in strict compliance with cardiac research
norms dictated by the specifics supplied with each
medicament prototype.
When generating the volume data sets for this pa-
per, the scanhead was mounted onto a rail in order
to improve mobility and produce a B-Mode image at
several lateral positions within the animal (see Fig-
ure 4). The spacing between the B-scan mode slices
along the travel axis was 0.25mm. Since the scanned
cardiac region of the mouse is relatively small, at
least twenty slices in traveling direction were required
for sensible dimensions of the generated volume data
sets. A major problem when creating the data set was
aligning the acquired lateral frames from the mouse
GRAPP 2008 - International Conference on Computer Graphics Theory and Applications
312
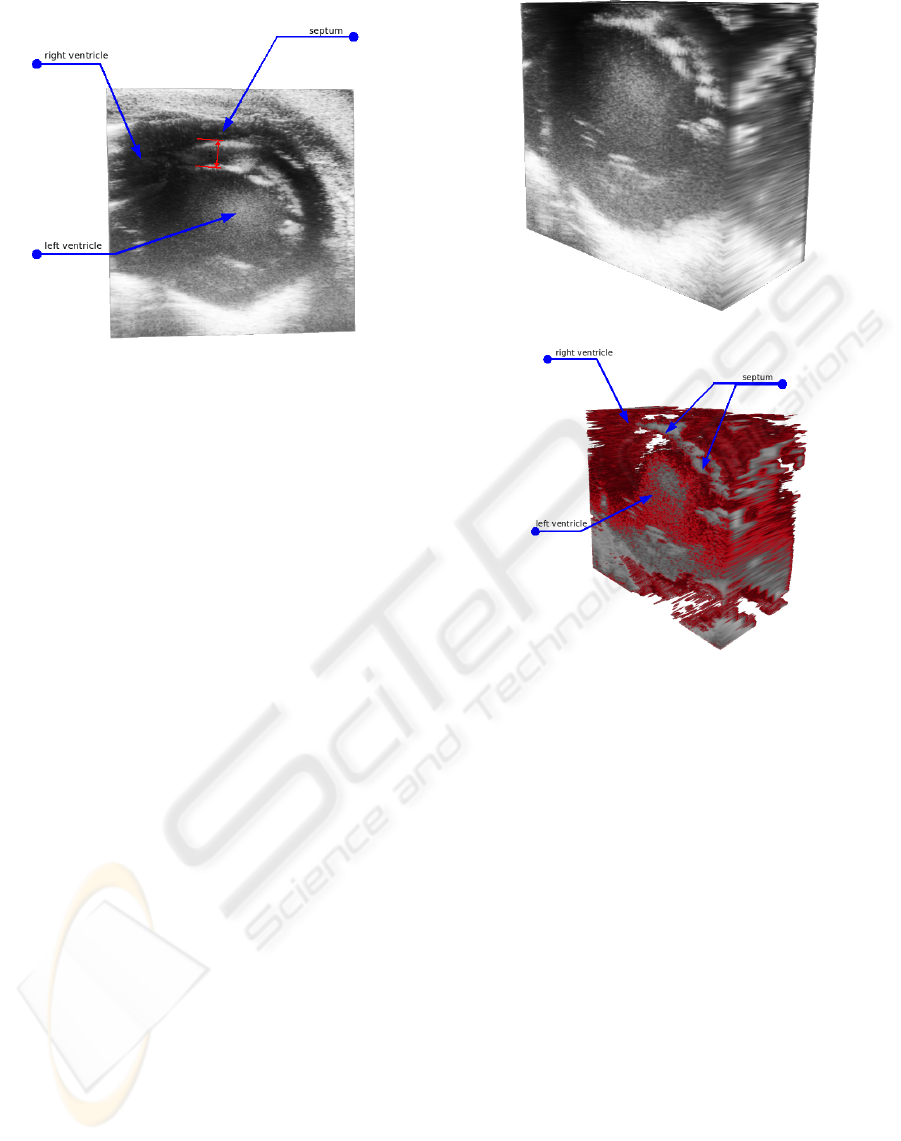
Figure 4: A single lateral slice showing a cross-section view
of the heart.
heart precisely so that a volume image of a still heart
could be created while the mouse was showing a
heart pulse of 300-450 bpm in an anesthetized con-
dition. After positioning the US scanhead over each
lateral location, the image acquisition was initiated
by switching the scanner to EKV mode. Consider-
ing the quality of the scans required, the EKV mode
took several minutes per lateral position, extending
the duration of anesthesia. In order to alleviate that,
additional measures of maintaining the animal’s tem-
perature within the normal range were undertaken and
the animal was placed under an infrared heating lamp.
5.1 Application Case 1
One of the possible utilizations of medical US in car-
diac research is the inquiry and measurement of the
heart septum, i.e. the wall separating the left and right
heart ventricle. One complication when this separat-
ing wall is damaged is known in the medical profes-
sion as Ventricular Septal Defect (VSD) (Lung and
Institute, 2006), which results mostly from a small
perforation located between the lower chambers of
the heart. When untreated, this heart defect degen-
erates into, among others, congestive heart failure, ar-
rhythmia and pulmonary artery hypertension. Cross-
sectional slices can show the septums’ condition only
at the particular lateral position of the scan (see Fig-
ure 4). A 3D view of the complete septum allows
much easier diagnostics of VSD and precise hole
measurements in contrast with 2D US. Therefore we
have conducted a scanning procedure in order to di-
agnose VSD in different mice.
In Figure 5(a) a rendered volume data set is shown
which is clipped up to the same cross-section as in
(a) Raw clipped data set (no filtering).
(b) Application of a BLTP filter.
Figure 5: 3D data sets acquired during application case 1,
showing the same cross-section as shown in Figure 4. No
image-processing is applied (top), a BLTP filter as well as a
modified transfer function is applied (bottom).
Figure 4, such that this 2D slice is situated in the data
set. It shows that the septum wall in the upper right
corner of the volume cube is barely visible. In order
to be able to show more details of the septum wall,
several techniques are applied to the volume image.
The resulting data set is displayed in Figure 5(b),
after applying a BLTP filter with underlying Gaus-
sian with σ value of 0.621, resulting in a 1D kernel
mask of [1 3 1] and a BLTP threshold value of 0.15,
thus removing small speckle regions from the data set.
Although the filters and the thresholds have removed
parts of the original image, the septum can still be
distinguished in the bottom image. What is more, the
applied transfer function allows for easier demarca-
tion of each wall side of the septum, thereby reveal-
ing some of its anatomical properties such as width in
both clipping directions and location within the heart
structure. Additionally, by repeatedly changing the
clipping parameters of the volume, the user can in-
INTERACTIVE RECONSTRUCTION AND VISUALIZATION OF DYNAMIC 3D ULTRASOUND DATA SETS
313
spect the dimensions and spread of the septum wall in
the whole heart volume interactively.
The abrupt discontinuities visible especially in the
right upper side of the volume where the septum wall
is located are caused by the insufficient amount of lat-
eral frames that constitute this volume data set (in this
case ∼ 20). This is due to the fact that with spacing of
0.5mm between each lateral position, the granularity
of the scanning installation is rather coarse in contrast
to the longitudinal size of a mouse heart of approxi-
mately 1cm.
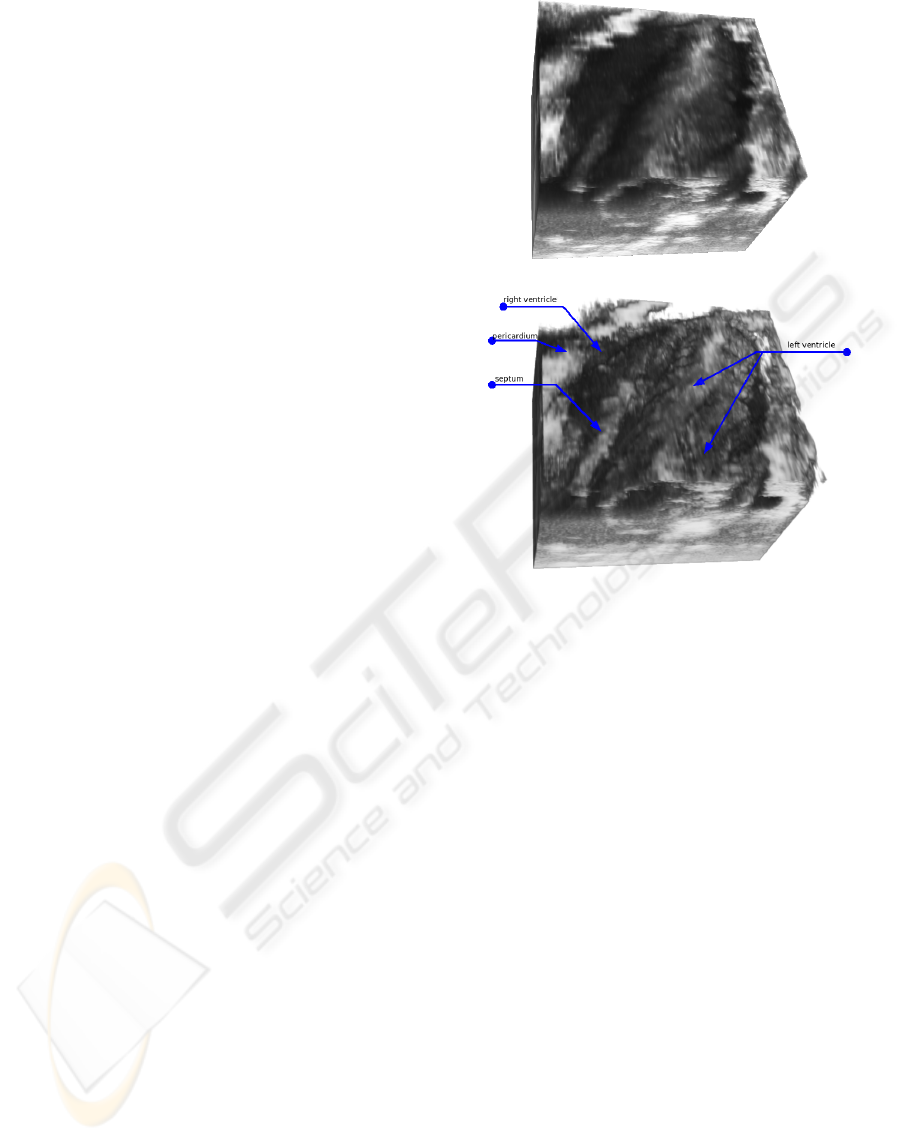
5.2 Application Case 2
In order to somewhat alleviate the shortcoming of too
few lateral slices, the granularity of the scanning in-
stallation has been increased with an additional scale
in sub-millimeter precision. In Figure 6 two render-
ings of thus generated data sets are shown, the lateral
slices have been acquired with a spacing of 0.25mm.
This improves the overall visualization quality and
in particular the coherency of the single structures.
The effect is especially visible in Figure 6(b), where
the enclosing wall of the left heart ventricle can be
viewed as an almost coherent and contiguous struc-
ture. What is more, the ridge labeled as septum can
be followed from the frontal beginning of the cross-
section to the very end of the heart - the apex. Addi-
tionally, the same filtering is applied to the data set:
BLTP with underlying Gaussian of σ value of 0.621
and BLTP threshold of 0.42. In this case, the filter
does not remove significant parts of the heart structure
but merely blobs and artifacts hindering the proper
display of the inner anatomy.
6 CONCLUSIONS
In this paper we have presented techniques compris-
ing a possible 3D US preprocessing and visualization
scheme. With the proposed system we are able to
reconstruct 3D US data sets from 2D slices by ap-
plying a new interactive reconstruction approach. To
facilitate reconstruction, the 2D lateral scans are vi-
sually organized based on their position as well as
their phase within the heart period, which is recorded
during the scans by using ECG. In Contrast to exist-
ing techniques, which reconstruct a volume automat-
ically, the user has additional influence when using
our approach and is thus able to reconstruct volumet-
ric data sets having a higher quality. In addition to the
proposed reconstruction methods, we have applied fil-
tering techniques in order to reduce artifacts.
(a) Raw clipped data set (no filtering).
(b) Application of a BLTP filter.
Figure 6: 3D data sets acquired during application case 2.
No image-processing is applied (top), a BLTP filter as well
as a modified transfer function is applied (bottom).
Thus, the proposed interactive approach towards
volume reconstruction encompasses a flexible way for
exercising maximum control when constructing vol-
ume data sets out of 2D slices by allowing the user to
select each single slice manually. By displaying the
contents of each slice and its temporal position in the
heart ECG, it provides for a user-based ”pre-filtering”
of the final volume contents.
ACKNOWLEDGEMENTS
This work was partly supported by grants from the
Deutsche Forschungsgemeinschaft (DFG), SFB 656
MoBil M
¨
unster, Germany (projects Z1, C3).
REFERENCES
Fenster, A. and Downey, D. B. (2000). Three-dimensional
ultrasound imaging. In Beutel, J., Kundel, H. L., and
Metter, R. L. V., editors, SPIE Handbook on Medical
Imaging - Volume I: Physics and Psychophysics. SPIE
Press.
GRAPP 2008 - International Conference on Computer Graphics Theory and Applications
314

Gee, A., Prager, R., Treece, G., and Berman, L. (2003).
Engineering a freehand 3D ultrasound system. Pattern
Recognition Letters, 24(4-5):757–777.
Gee, A., Prager, R., Treece, G., Cash, C., and Berman, L.
(2004). Processing and visualizing three-dimensional
ultrasound data. British Journal of Radiology,
77(2):186–193.
Gergs, U., Boknik, P., Buchwalow, I., Fabritz, L., Matus,
M., Justus, I., Hanske, G., Schmitz, W., and Neumann,
J. (2004). Overexpression of the catalytic subunit of
protein phosphatase 2A impairs cardiac function. J.
Biol. Chem., page M405770200.
Gonzalez, R. C. and Woods, R. E. (2001). Digital Im-
age Processing. Addison-Wesley Longman Publish-
ing Co., Inc., Boston, MA, USA.
Lung, N. H. and Institute, B. (2006). Ventricular septal de-
fect. Online; accessed on 20-March-2007.
Organization, W. H. (2006). Fact sheets: Cardiovascular
diseases. Online; accessed on 23-March-2007.
Sakas, G., Schreyer, L.-A., and Grimm, M. (1994). Case
study: visualization of 3D ultrasonic data. In VIS ’94:
Proceedings of the conference on Visualization ’94,
pages 369–373, Los Alamitos, CA, USA. IEEE Com-
puter Society Press.
Sakas, G. and Walter, S. (1995). Extracting surfaces from
fuzzy 3D-ultrasound data. In Computer Graphics Pro-
ceedings, Annual Conference Series SIGGRAPH 95,
pages 465–474.
VisualSonics (2005). Vevo 770 high-resolution imaging
system: Operator manual.
INTERACTIVE RECONSTRUCTION AND VISUALIZATION OF DYNAMIC 3D ULTRASOUND DATA SETS
315
