
A DIRECT VOLUME RENDERING FRAMEWORK FOR THE
INTERACTIVE EXPLORATION OF HIGHER-ORDER AND
MULTIFIELD DATA
Felix Manke and Burkhard W
¨
unsche
Graphics Group, Department of Computer Science, University of Auckland, Private Bag 92019, Auckland, New Zealand
Keywords:
Direct volume rendering, visualization tools, vector field visualization, tensor field visualization.
Abstract:
Direct Volume Rendering is a popular method for displaying volumetric data sets without generating interme-
diate representations. The technique is most frequently applied to scalar data and few specialized techniques
exist for visualizing higher-order data, such as tensor fields, directly. This is a serious limitation because
progress in medical imaging, satellite technology and numerical simulations has made higher-order and mul-
tifield data sets a common entity in medicine, science and engineering.
In this paper we present a framework for the interactive exploration of complex data sets using direct volume
rendering. This is achieved by applying sophisticated Software Engineering (SE) to modularize the direct
volume rendering pipeline and by exploiting the latest advances in graphics hardware and shading languages
to modify rendering effects and to compute derived data sets at runtime.
We discuss how the framework can be used to mimic the latest specialized direct volume rendering algorithms
and to interactively explore and gain new insight into high-order and multifield data sets. The capabilities of
the framework are demonstrated by three case studies and the efficiency and effectiveness of the framework is
evaluated.
1 INTRODUCTION
The amount and complexity of data from simula-
tions and measurements in science, engineering and
medicine is increasing exponentially. Visualization
is an essential tool to analyze and explore this over-
whelming amount of data and to communicate find-
ings to professionals and laymen.
Traditional visualization tools only offer a fixed
number of inbuilt visualization techniques often with
specific applications in mind. The need for more flex-
ible approaches to explore data has led to the emer-
gence of powerful visualization toolkits, such as VTK
(Schroeder et al., 2000; Kitware, Inc., 2007). These
tools allow the user to design their own visualization
pipelines using appropriate data sources, data trans-
formation and visualization icons. Visual interfaces
can make such tools also accessible for users without
programming experience.
A very powerful visualization technique is Direct
Volume Rendering (DVR), which was developed for
rendering volumetric scalar data sets directly without
requiring intermediate representations such as isosur-
faces (Levoy, 1990; Westover, 1991). Over recent
years the emergence of modern graphics hardware has
made interactive DVR on consumer level hardware
possible and the technique is now an essential tool in
medical imaging and many other scientific and engi-
neering applications.
Direct volume rendering is usually only available
as a fixed technique within visualization applications
and toolkits and the user has only limited choices
to effect the way data is rendered. In particular it
is usually not possible to render higher order data
such as vector and tensor fields. More specialized
techniques have been developed for such applications
such as DVR of Line Integral Convolution (LIC) tex-
tures, where a 3D texture represents a vector field, or
hue balls and lit tensors where tensor information is
used to define illumination and color parameters for
DVR.
These tailor made techniques are often sufficient
199
Manke F. and Wünsche B. (2008).
A DIRECT VOLUME RENDERING FRAMEWORK FOR THE INTERACTIVE EXPLORATION OF HIGHER-ORDER AND MULTIFIELD DATA.
In Proceedings of the Third International Conference on Computer Graphics Theory and Applications, pages 199-206
DOI: 10.5220/0001096501990206
Copyright
c
SciTePress

for one particular application, but so far there are no
tools available to give the user full flexibility when
exploring volumetric data sets using DVR. For exam-
ple, existing tools are not designed to use different
data sets as input for color and opacity transfer func-
tions (e.g. using anisotropy values derived from ten-
sor data) or to represent different tissue types by dif-
ferent textures.
In this paper we present a framework for the inter-
active exploration of multifield and higher-order data
sets using direct volume rendering, advanced GPU
programming and SE design technologies. Section
2 reviews DVR techniques and toolkits supporting it.
The identified range of existing applications is used
to develop the requirements and motivate the design
of our framework. Section 3 and 4 present the design
and implementation of our framework, which is eval-
uated in section 5. Section 6 concludes this paper and
discusses issues for future research.
2 RELATED WORK
2.1 Direct Volume Rendering
Direct volume rendering was developed for trans-
forming scalar volume data directly into an image
by associating scalar (density) values with colors and
transparencies. Most direct volume rendering algo-
rithms are based on the emission-absorption model
where scalar values are interpreted as densities of a
gaseous material which emits and absorbs light. An
image is created by accumulating the total light inten-
sity for each image pixel which in the simplest case is
computed as (Sabella, 1988)
C =
Z
∞
0
c(t)e
−
R
t
0
κ(u)du
dt (1)
where t is the parameter of a viewing ray through a
pixel, C is its color, c(t) the color at the ray parameter
t and the integral in the exponent is the total opac-
ity of the ray segment [0, t] which is computed by
integrating the particle densities (opacities) along the
ray. This equation assumes that at each point density
values are associated with color and opacity values
which is achieved using color and opacity transfer
functions. A detailed discussion of optical models is
given in (Max, 1995).
The structure of a volume can be emphasized by
using a local illumination function. The most com-
mon methods uses the normalized gradients of the
scalar field as surface normal (Levoy, 1988). This
works well since boundaries between different mate-
rials are often characterized by a high density gradi-
ent.
2.2 Advanced Transfer Functions
Various modifications of the traditional approach to
associate scalar voxel values with RGB color and
opacity values have been suggested. For example,
Spectral Volume Rendering models spectral changes
in light caused by interaction with the material within
a voxel (Noordmans et al., 2000). The method allows
interesting transparency effects and makes it easy to
reveal hidden structures in a volume.
Feature rich visualizations can be obtained by
replacing one-dimensional transfer functions with
multi-dimensional ones and by applying these to
scalar or multivariate data (Kniss et al., 2002). Spe-
cial manipulation widgets make the specification of
transfer functions more intuitive and convenient.
Hauser et al. (Hauser et al., 2000; Hauser et al.,
2001) devise a technique to fuse DVR, Maximum In-
tensity Projection (MIP), surface rendering and non-
photorealistic rendering. The authors suggest that this
approach is especially useful when visualizing inner
structures together with semi-transparent outer lay-
ers, similar to the focus-and-context approach known
from information visualization. An implementation
which allows interactive exploration of volume data
sets is also presented.
2.3 DVR for Higher-Order Data
The previously surveyed approaches were suitable
only to visualize one or multiple scalar data sets. Sev-
eral authors have presented techniques using DVR to
visualize vector and tensor data.
Vector data can be visualized over a 2D surface
by encoding the direction of a normalized 3D vector
with a spherical color map which indicates the polar
coordinates of the vector (Kindlmann and Weinstein,
1999). Alternatively the vector field direction can be
indicated with line segments whose opacity and color
encode the vector magnitude and normal component,
respectively (Crawfis and Max, 1992).
A more natural representation is to indicate the
vector field with a 3D texture which is then rendered.
A popular choice are 3D LIC textures (Cabral and
Leedom, 1993). Rezk-Salama et al. present a DVR
implementation for interactive exploration of volume
LIC (Rezk-Salama et al., 1999). 3D Perception of
such volume rendered 3D textures is improved by em-
phasizing thin thread structures using limb darken-
ing (Helgeland and Andreassen, 2004) or visibility-
impeding halos which indicate depth discontinuities
(Interrante and Grosch, 1998; Wenger et al., 2004).
Kindlmann and Weinstein modify the opacity and
color transfer functions used in direct volume render-
GRAPP 2008 - International Conference on Computer Graphics Theory and Applications
200
ing in order to represent tensor quantities (Kindlmann
and Weinstein, 1999). The technique was tailored for
the visualization of diffusion tensor fields in the brain.
Various people use textures to visualize diffusion
tensor fields, e.g. (Bhalerao and Westin, 2003). The
textures can be obtained by integrating streamlines
along the maximum diffusion direction within white
matter regions which are identified from the mean
diffusivities and diffusion anisotropy. W
¨
unsche and
Lobb use the diffusion anisotropy to modulate the
opacities of white matter tracts and blend it with tex-
tures indicating other tissue types. This is achieved
by using a classification function which encodes the
probability that a field value corresponds to a certain
tissue type (W
¨
unsche and Lobb, 2004).
2.4 Frameworks and Toolkits
As demonstrated in the previous subsection a limited
number of specialized DVR applications exist which
are capable of rendering multifield and higher-order
data sets and which use multi-dimensional inputs for
the color and opacity transfer functions.
Other publications discuss how to implement
more general rendering frameworks. Stegmaier et al.
present a volume ray casting framework (Stegmaier
et al., 2005), which allows to define visualization
techniques by implementing fragment shaders. The
application is restricted to scalar volume data, for
which a gradient can be pre-computed. Other data
is not supported and new fields cannot be derived.
Bruckner and Gr
¨
oller discuss an interactive
framework for non-photorealistic volume illustrations
(Bruckner and Gr
¨
oller, 2005). Their system, the Vol-
umeShop, allows to interactively explore and anno-
tate scalar data. Hereby, more than one volume can
be rendered simultaneously. Visualization and shad-
ing effects are defined by adjusting a two-dimensional
transfer function. The application uses hardware-
accelerated rendering and C for graphics (Cg) as high
level shading language.
Teem (Kindlmann, 2003) is a very extensive col-
lection of open-source C libraries that offer a vari-
ety of functionality to process and visualize volumet-
ric data. It supports data of arbitrary dimensionality
and lets the user specify which entities to derive and
how to map the data to colors and opacities (by defin-
ing multi-dimensional transfer functions). However,
Teem is not interactive, as it has to be run on com-
mand line.
The OpenGL Volumizer is a powerful C++ toolkit
for hardware-accelerated high-quality volume render-
ings and is suitable for very large data sets (Bhani-
ramka and Demange, 2002) and multi-resolution vol-
ume rendering (LaMar et al., 1999). Shaders may be
defined that specify the visualization. The OpenGL
Volumizer depends on other frameworks such as the
Visualization Toolkit (VTK).
VTK is a modular, object-oriented an flexible vi-
sualization toolkit (Schroeder et al., 2000; Kitware,
Inc., 2007) which incorporates vector and tensor icons
and several DVR algorithms. The tools can be ex-
tended by overwriting existing classes such as trans-
fer functions. However, it is very difficult to do
non-standard applications such as rendering 3D LIC
textures and the user has no control which parts of
the computation get performed on the graphics card.
Users without programming experience can use VTK
via a visual programming environment with an in-
tegrated self-learning help capability (Telea and van
Wijk, 2000).
3 FRAMEWORK DESIGN
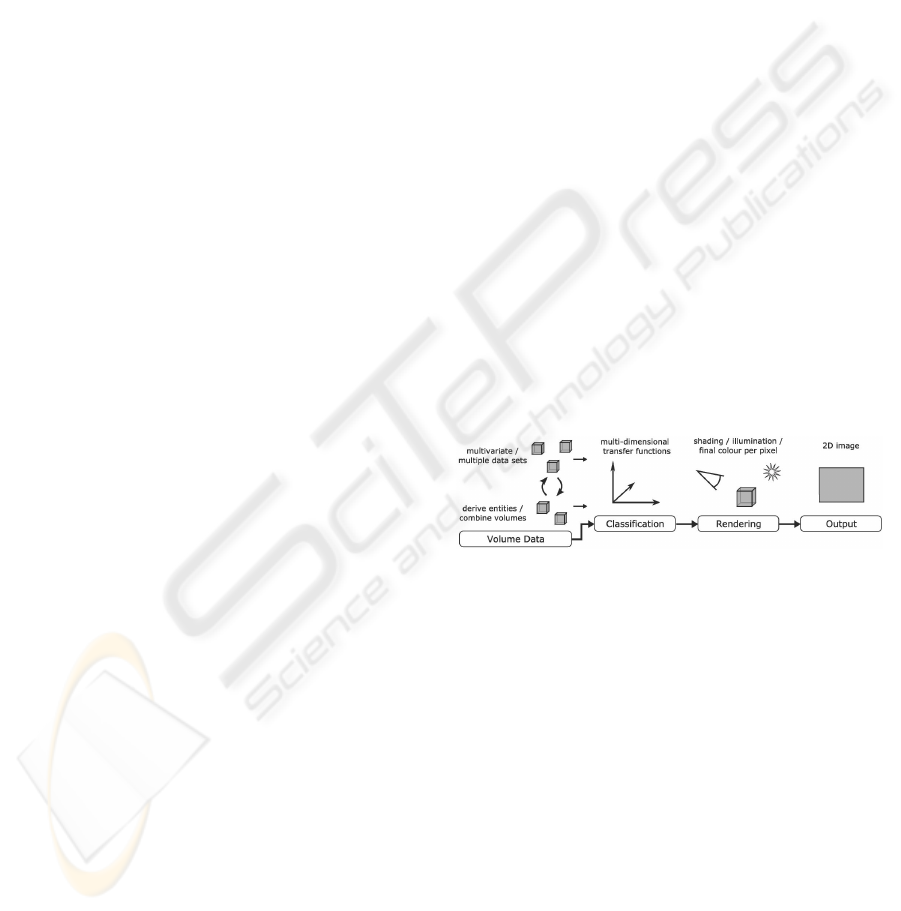
The direct volume rendering process in the general
case can be represented by the pipeline in figure 1.
Taking into account the advanced applications we sur-
veyed in section 2 and the requirements we discussed
in the introduction it becomes clear that a flexible de-
sign is needed at each stage of the rendering pipeline:
Figure 1: Generalised direct volume rendering pipeline.
• Data initialization stage: It has to be possible
to load arbitrary volume data (multiple scalar and
higher order data sets). The framework must sup-
port the easy integration of arbitrary data types
and file formats and it must be possible to de-
rive new entities during run time. Examples are
eigenvector fields and textures, such as 3D LIC
textures, which subsequently can be used for ren-
dering the data.
• Classification stage: The classification stage
must be flexible enough such that the user can use
arbitrary components of the data or derived en-
tities to classify the data to be rendered. For ex-
ample, Diffusion Tensor Imaging data of the brain
can be classified by using the mean diffusivity and
diffusion anisotropy computed from the diffusion
tensor data. Similarly, positron emission tomog-
A DIRECT VOLUME RENDERING FRAMEWORK FOR THE INTERACTIVE EXPLORATION OF HIGHER-ORDER
AND MULTIFIELD DATA
201
raphy (PET) data can be used to determine regions
of interest, e.g. a tumor, in an MRI data set.
Data classification does not only involve the use
of color and opacity transfer functions, but should
also allow the creation of new transfer functions
such as texture transfer functions.
• Rendering stage: The rendering can be divided
into three components: The reconstruction tech-
nique, the type of DVR algorithm (see subsec-
tion 3.4) and the desired rendering effects. The se-
lected techniques affect both rendering speed and
image quality.
Optimal reconstruction functions for specific ap-
plication areas such as volume rendering are an
ongoing topic of research (e.g. (Marschner and
Lobb, 1994; Moorhead II and Zhu, 1995; M
¨
oller
et al., 1998; Mueller et al., 1999)). Reconstruction
of vector and tensor data is more complicated and
can be achieved using spectral analysis (Aldroubi
and Basser, 1999). Note that when using texture
based DVR algorithms usually a bi- or trilinear re-
construction filter is used.
By controlling rendering effects, the user can em-
phasize different aspects of the data and improve
the visual perception of features. Examples are
gradient based shading, color mapping of cur-
vature, and emphasis of the silhouette boundary.
Also the user might want to switch interactively
between rendering different aspects of a data set,
e.g. Computed Tomography (CT) data alone and
combined with PET data.
3.1 Run-Time Modification of
Rendering Effects and Data Sets
The most important user-specific aspects of the ren-
dering framework are the derivation of new fields, the
processing of the data (e.g. reconstruction), and the
specification of visualization techniques and shading
effects.
At this stage advanced reconstruction kernels have
not been implemented, but they can be incorporated
using the techniques described in the following sec-
tions.
3.1.1 Derivation of New Fields
The derivation of new entities is to be done on the
GPU in order to achieve efficiency and to minimize
data transfer time. We call the Cg code blocks or mod-
ules that implement this derivation operators. The
main input of an operator are volume data sets and the
output is a texture object that holds the derived val-
ues. Note that, by specifying operators in the CgFX
syntax, the full capabilities of the graphics hardware
is available for the execution (vertex and fragment
shaders, multiple render targets, etc.).
Loaded data is exclusively used by operators and
visualization effects, which both run on the GPU
and therefore will be implemented by the user as Cg
shader programs. Hence, to facilitate a practicable
work with the framework, we keep the specification
of resources and the fragment-shader definition at the
same location.
An even more powerful representation could be
achieved by adopting the generalized field data struc-
ture we previously presented in (W
¨
unsche, 2002).
The data structure is based on arithmetic trees allows
lazy evaluation of derived fields and the combination
of structured, unstructured and analytic data.
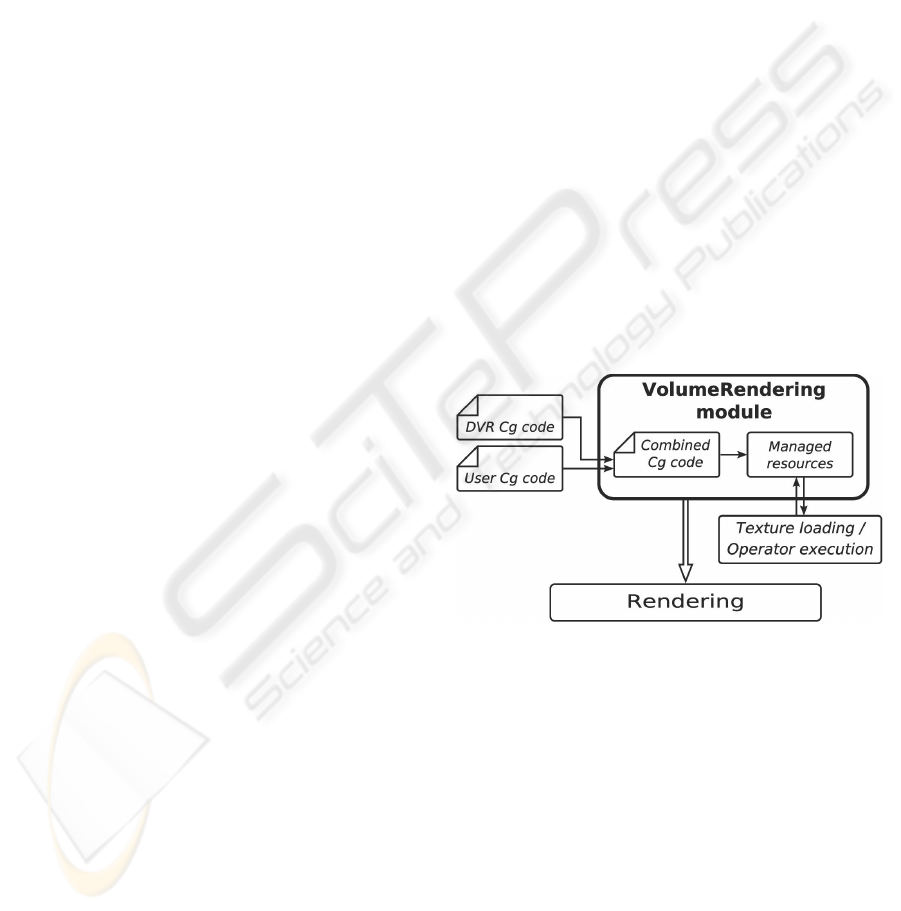
3.1.2 Rendering Effects
By analyzing existing DVR applications we observed
that the executed Cg shader code can be separated into
code that is specific for a particular DVR algorithm
(written by developers) and code that is specific to a
user-defined rendering effect (written by the user and
which might have to be changed at run-time).
Figure 2: The volume rendering module that manages the
Cg code and resources.
These two code sections must hence be physi-
cally and conceptually separated. Figure 2 shows that
our framework contains a module that assembles the
DVR algorithm’s and the users Cg code and manages
the specified resources (volume data sets or textures).
During the initialization, the compiled Cg code is an-
alyzed using the Cg Core Runtime API, data sets are
loaded and operators executed. By making use of
Cg interfaces, the implementation of a rendering ef-
fect (which we call evaluator) is held abstract and the
user can define as many different evaluators as desired
using several implementations of the abstract inter-
face. The volume rendering module makes interactive
switching of evaluators possible.
GRAPP 2008 - International Conference on Computer Graphics Theory and Applications
202
3.2 Extendability
The framework must be flexible enough to allow de-
velopers to integrate new data formats and to imple-
ment new DVR algorithms. A unified scheme that
makes extending the framework as straightforward as
possible is obtained by using a generic template fac-
tory that lets developers register new implementations
in a single line of code. After registration, a sub-class
can be instantiated throughout the application using
a unique identifier, without the need of knowing the
concrete data type.
In order to easily initialize objects at start-up, we
have developed a unified design for initializing all
possible state variables. Two fundamental problems
arise when dealing with state variables of unknown
objects (as they may be present in the framework due
to sub-classing by other developers): The state vari-
ables themselves are unknown (i.e. their ”name” or
signature) and their data type may differ.
To be able to initialize the state variables of the
unknown objects we introduce a design which we call
parameter design pattern: Every pair of Get... and
Set... methods is encapsulated by a ”parameter”
object that hides the data type of the state variable
using a string representation, which is used by the ap-
plication.
With these two concepts, the generic factory and
the parameter design pattern, we are able to automat-
ically instantiate and initialize new implementations.
Note that if a data set has more than four components
per voxel, a single volume data set must be associated
with multiple texture sampler objects. The framework
supports a splitting of the data into several textures
and samplers.
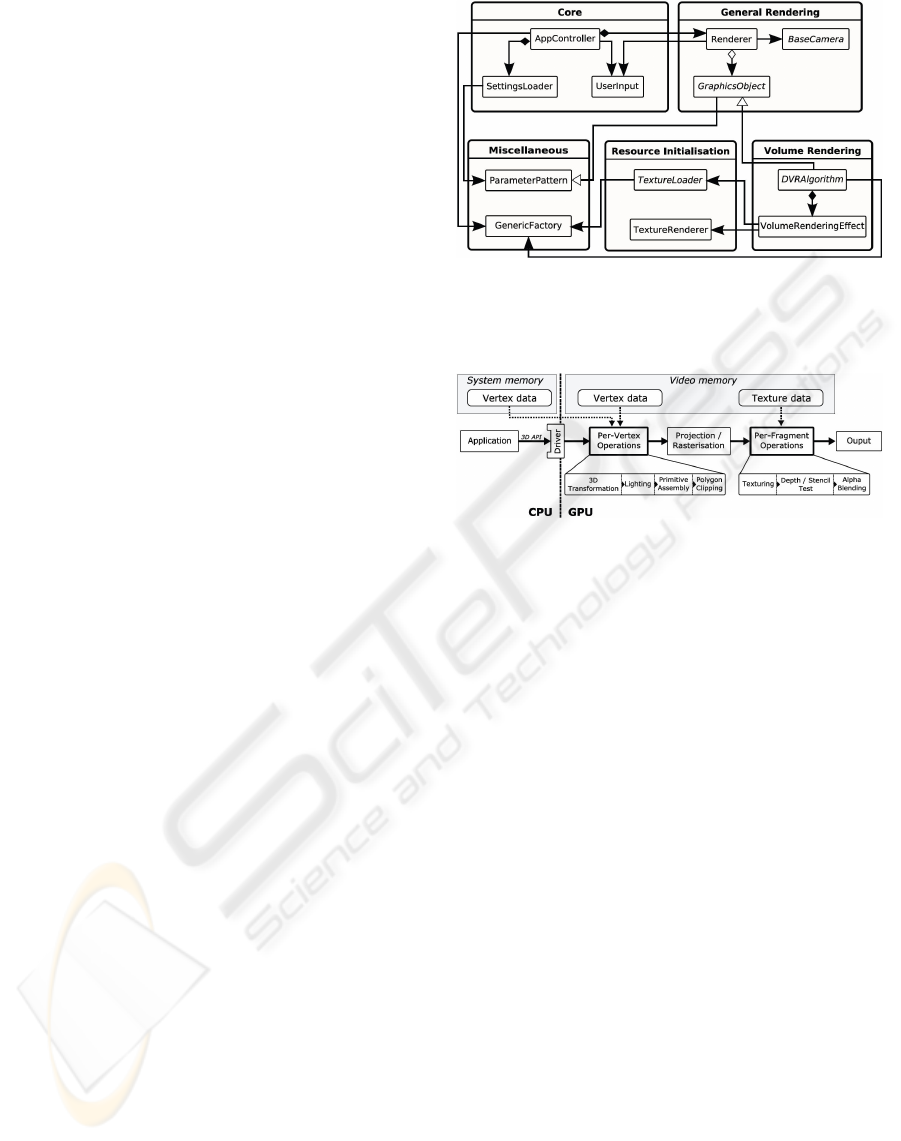
3.3 Framework Components
The main components of our rendering framework are
shown in figure 3. Besides the concepts and modules
discussed so far, the framework contains a controller
object that manages the entire program execution (ini-
tialization, rendering and termination). During the
start, a configuration file is parsed. It contains settings
that specify global states of the application. Further
on, a renderer is introduced to render all graphical ob-
jects that are registered. It also updates the camera
according to the user input.
3.4 GPU Acceleration
In order to achieve real-time performance we use
hardware-accelerated direct volume rendering meth-
ods which use the data processing model of the graph-
Figure 3: The main components of the direct volume ren-
dering framework. Note that the VolumeRenderingEffect.
component combines Cg shaders and manages specified re-
sources.
Figure 4: Simplified model of the general graphics pipeline.
ics pipeline shown in figure 4. The model was origi-
nally developed for fast rendering of geometric prim-
itives defined by vertices, such as lines and polygons.
The simplified representation in the image concen-
trates on the components relevant to our research.
The volume rendering equation 1 can be solved
on the GPU by using object-order algorithms which
project the volume data onto the image plane us-
ing the texture mapping and blending capabilities of
the graphics hardware. Since graphics cards do not
support volumetric rendering primitives a polygonal
proxy geometry, usually axis aligned or view aligned
slices, is used (Rezk-Salama et al., 2000).
In order to avoid problems with perspective pro-
jection when using object-aligned slices we perform a
perspective correction per viewing ray in a fragment
shader. In this case the position of the vertices has to
be passed to the fragment shader. This is done by a
simple vertex shader program (because vertex shader
outputs are interpolated during rasterization, the frag-
ment shader inputs correspond to the pixel positions)
(Manke, 2007).
Object-order approaches have the disadvantage
that a significant amount of voxels are processed
which might not contribute to the final image. Ray-
casting makes it possible to skip transparent regions,
adjust step size according to the importance of a re-
gion and to utilize predictions whether the currently
processed fragment will be occluded by a later pro-
A DIRECT VOLUME RENDERING FRAMEWORK FOR THE INTERACTIVE EXPLORATION OF HIGHER-ORDER
AND MULTIFIELD DATA
203

cessed slice. GPU-supported ray-casting, introduced
by (Kr
¨
uger and Westermann, 2003; R
¨
ottger et al.,
2003), uses the one-to-one correspondence between
pixels of the resulting image and the traced viewing
rays. Hence it is straightforward to encode the rays
in 2D textures (start point and direction). Additional
data such as the accumulated colors and opacities are
also stored in textures.
4 IMPLEMENTATION
In our implementation we use as shading language
Cg (C for Graphics) since HLSL (High Level Shad-
ing Language) is only available in conjunction with
the Microsoft Direct3D API, and GLSL (OpenGL
Shading Language) lacks some advanced features re-
quired for achieving modularity. In particular Cg
provides interfaces for compile-time polymorphism,
#include pre-processor directive which we use to in-
tegrate user-defined Cg code into the rendering frame-
work, and CgFX Files, semantics, and annotations. A
detailed discussion of the features and data types used
and differences to other shading languages is given in
(Manke, 2007).
Basic mathematics for 3D graphics is provided
by Graphics 3D (McGuire, 2007) which has the ad-
ditional advantage that it wraps the OpenGL API
and provides an object-oriented rendering frame-
work. Furthermore, the Extensible Markup Language
(XML) is used to specify the settings of the applica-
tion. A simple and minimalist open-source library,
TinyXml (Thomason, 2007), is used to load and parse
the XML fies.
5 RESULTS
To demonstrate the effectiveness and flexibility of our
framework and the discussed concepts, we developed
a prototype of the framework. Within it we imple-
mented two DVR algorithms and support for different
data formats.
In three case studies we show how to define re-
sources, operators and evaluators. At first, we used a
scalar CT data set of the head of the Visible Male (ac-
quired by (National Library of Medicine, NIH, 2007),
downloaded from (R
¨
ottger, 2006)). Renderings of
different evaluators are shown in figure 5.
Next we used a CT and a PET data set of a monkey
(acquired by (Laboratory of Neuro Imaging, UCLA,
2007), downloaded from (R
¨
ottger, 2006)). Our frame-
work makes it possible to load and render these data
sets separately and simultaneously as demonstrated in
figure 6.
In the third case study we procedurally computed
a vector field on the GPU using an operator. As shown
in figure 7, two evaluators were used to visualize ei-
ther the vector field encoded as RGB colors or using
real-time 3D Line Integral Convolution (adopted from
(Lakshmanan, 2006)).
The renderings for all case studies were performed
at interactive speeds. We used a machine with an
Intel Pentium 3.4 GHz CPU, 2.0 GB main memory
and an NVIDIA Quadro FX 3400 with 256 MB video
memory. The set-up time depends on texture load-
ers and operators. For the first two case studies the
set up required between 0.25 and 0.55 seconds and
rendering between 30 and 90 ms per frame (33 to
11 frames/second). In the LIC case study, the set-
up required 0.8 seconds and the rendering 225 ms per
frame (4.4 frames/second) on average.
The full report of the implementation (Manke,
2007) demonstrates that the user defined source code
is well structured and short (between two and 16 lines
per evaluator), because the Cg code for the DVR al-
gorithm is separated.
6 CONCLUSIONS
We have presented a modular and flexible framework
for interactive direct volume rendering of complex
data sets. The framework is entirely GPU-based and
can be easily extended by developers.
In contrast to existing applications and toolkits it
is completely modular and the user can interactively
derive new entities and modify rendering and shading
effects to explore complex data sets. We use advanced
mechanisms of the Cg language to provide a flexibil-
ity that is usually difficult to achieve on the special-
ized and restrictive graphics hardware.
In the future, we will add additional functionali-
ties such as volume clipping, higher quality rendering
algorithms, and flexible reconstruction filters. Also,
multi-resolution techniques will be implemented for
handling large data sets. We are currently conducting
more complex case studies which involve vector and
tensor data sets, e.g. DW-MRI data and we are using
our framework to develop texture transfer functions.
Finally we want to make the framework more
user-friendly and provide a graphical user interface
which offers menus and dialogs for loading data, se-
lecting shaders and effects and loading and develop-
ing new ones. Examples are formula editors with GUI
for deriving new data sets, spreadsheet like interfaces
for interactively exploring and comparing the effects
GRAPP 2008 - International Conference on Computer Graphics Theory and Applications
204
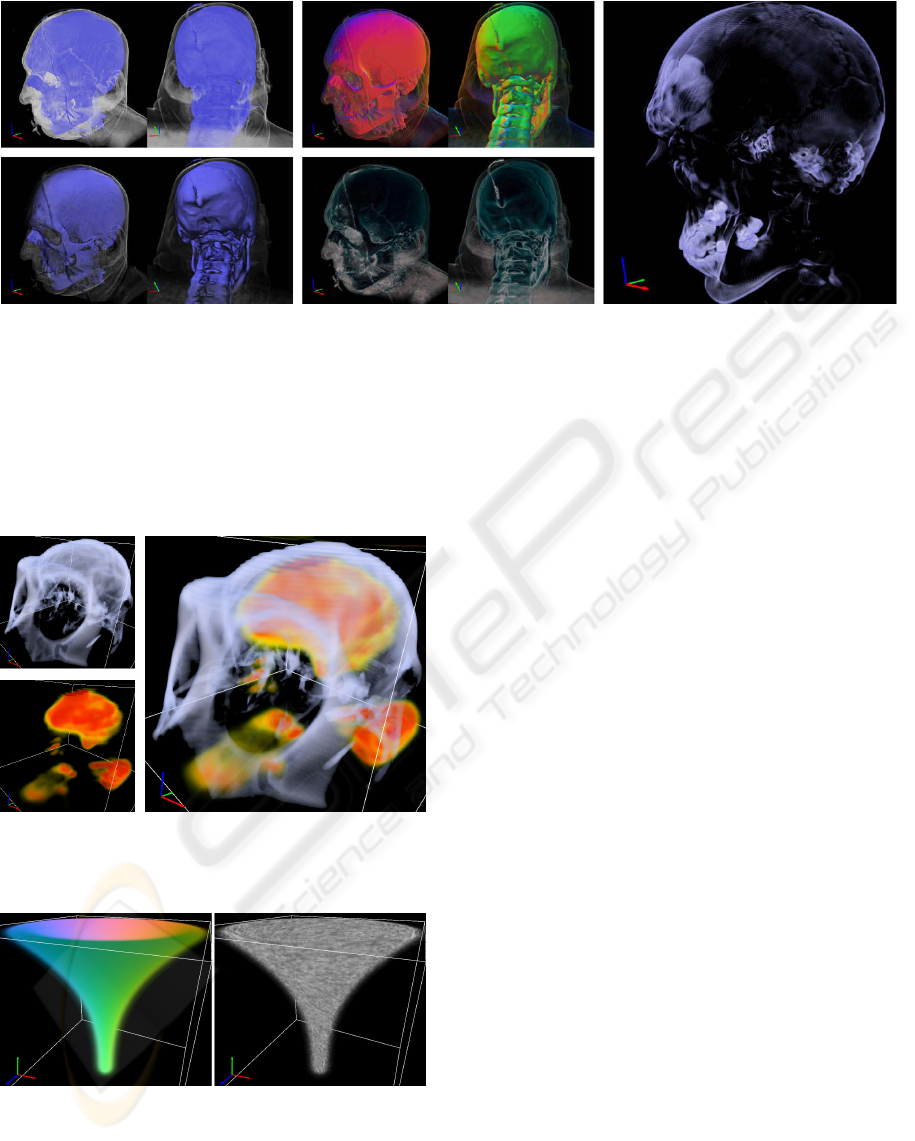
Figure 5: Different renderings of a CT data set. Top-left: Evaluation of a basic 1D transfer function. Bottom-left: Additional
diffuse lighting. Top-center: Gradient shading that shows the direction of the gradient vectors. Bottom-center: Artistic
shading that enhances the silhouette of rendered structures. Right: 2D transfer function using the scalar data value and
gradient magnitude.
of different shaders, and a visual programming inter-
face based on the data flow paradigm for modifying
the DVR pipeline.
Figure 6: Combined rendering (right) of a CT (top-left) and
a PET (bottom-left) data set of a monkey brain.
Figure 7: Renderings of the LIC case study. Left: Color
encoded procedural vector field. Right: Interactive 3D LIC
rendering. The opacity is inversely proportional to the vec-
tor length.
REFERENCES
Aldroubi, A. and Basser, P. J. (1999). Reconstruction of
vector and tensor fields from sampled discrete data.
In The Functional and Harmonic Analysis of Wavelets
and Frames, volume 247 of Contemporary Mathemat-
ics, pages 1–15. American Mathematical Society.
Bhalerao, A. and Westin, C.-F. (2003). Tensor splats: Visu-
alising tensor fields by texture mapped volume render-
ing. In Proceedings of MICCAI’03, pages 294–901.
Bhaniramka, P. and Demange, Y. (2002). OpenGL volu-
mizer: a toolkit for high quality volume rendering of
large data sets. In Proceedings of the 2002 IEEE Sym-
posium on Volume Visualization and Graphics, pages
45–54, Piscataway, NJ, USA. IEEE Press.
Bruckner, S. and Gr
¨
oller, M. E. (2005). VolumeShop: An
interactive system for direct volume illustration. In
Proc. of IEEE Visualization 2005, pages 671–678.
Cabral, B. and Leedom, L. C. (1993). Imaging vector fields
using line integral convolution. In Proceedings of
SIGGRAPH ’93, pages 263–272. ACM SIGGRAPH.
Crawfis, R. and Max, N. (1992). Direct volume visualiza-
tion of three-dimensional vector fields. In Workshop
on Volume Visualization, pages 55–60. ACM Press.
Hauser, H., Mroz, L., Bischi, G.-I., and Gr
¨
oller, M. E.
(2000). Two-level volume rendering - fusing MIP and
DVR. In Proceedings of Visualization 2000, pages
211–218. IEEE Press.
Hauser, H., Mroz, L., Bischi, G. I., and Gr
¨
oller, M. E.
(2001). Two-level volume rendering. IEEE Trans-
actions on Visualization and Computer Graphics,
7(3):242–252.
Helgeland, A. and Andreassen, O. (2004). Visualization
of vector fields using seed LIC and volume render-
ing. IEEE Transactions on Visualization and Com-
puter Graphics, 10(6):673–682.
A DIRECT VOLUME RENDERING FRAMEWORK FOR THE INTERACTIVE EXPLORATION OF HIGHER-ORDER
AND MULTIFIELD DATA
205

Interrante, V. and Grosch, C. (1998). Visualizing 3D
flow. IEEE Computer Graphics and Applications,
18(4):49–53.
Kindlmann, G. (2003). Teem: Tools to process
and visualize scientific data and images. URL:
http://teem.sourceforge.net.
Kindlmann, G. and Weinstein, D. (1999). Hue-balls and lit-
tensors for direct volume rendering of diffusion tensor
fields. In Proceedings of Visualization ’99, pages 183–
189. IEEE Press.
Kitware, Inc. (2007). VTK Home Page. URL:
http://public.kitware.com/VTK.
Kniss, J., Kindlmann, G., and Hansen, C. (2002). Multi-
dimensional transfer functions for interactive volume
rendering. IEEE Transactions on Visualization and
Computer Graphics, 8(3):270–285.
Kr
¨
uger, J. and Westermann, R. (2003). Acceleration tech-
niques for GPU-based volume rendering. In Proc. of
Visualization 2003, pages 287–292. IEEE Press.
Laboratory of Neuro Imaging, UCLA (2007). Monkey at-
las. URL: http://www.loni.ucla.edu/ [Last accessed
21/09/2007].
Lakshmanan, V. (2006). Interactive 3D line integral convo-
lution on the GPU. Master’s thesis, School of Electri-
cal Engineering and Computer Science, Oregon State
University, Corvallis, OR, USA.
LaMar, E., Hamann, B., and Joy, K. I. (1999). Multiresolu-
tion techniques for interactive texture-based volume
visualization. In Proceedings of Visualization ’99,
pages 355–361. IEEE Press.
Levoy, M. (1988). Display of surfaces from volume data.
IEEE Comp. Graphics & Applications, 8(5):29–37.
Levoy, M. (1990). Efficient ray tracing of volume data.
ACM Transactions on Graphics, 9(3):245–261.
Manke, F. (2007). A modular GPU-based direct vol-
ume renderer for visualising multi-dimensional high-
order data. 780 project report, Dept. of Com-
puter Science, University of Auckland, Auckland,
New Zealand. URL: http://www.cs.auckland.ac.nz/
˜burkhard/Reports/2007 S1 FelixManke.pdf.
Marschner, S. R. and Lobb, R. J. (1994). An evaluation of
reconstruction filters for volume rendering. In Proc.
of Visualization ’94, pages 100–107. IEEE Press.
Max, N. (1995). Optical models for direct volume render-
ing. IEEE Transactions on Visualization and Com-
puter Graphics, 1(2):99–108.
McGuire, M. (2007). G3d engine. URL: http://g3d-
cpp.sourceforge.net [Last accessed 24/08/2007].
M
¨
oller, T., M
¨
uller, K., Kurzion, Y., Machiraju, R., and
Yagel, R. (1998). Design of accurate and smooth fil-
ters for function and derivative reconstruction. In Pro-
ceedings of the 1998 Symposium on Volume Visualiza-
tion (VOLVIS-98)), pages 134–151. ACM Press.
Moorhead II, R. J. and Zhu, Z. (1995). Signal processing
aspects of scientific visualization. IEEE Signal Pro-
cessing Magazine, 12(5):20–41.
Mueller, K., M
¨
oller, T., and Crawfis, R. (1999). Splatting
without the blur. In Proceedings of Visualization ’99,
pages 363–370. IEEE Press.
National Library of Medicine, NIH (2007). The visi-
ble human project. URL: http://www.nlm.nih.gov/re
search/visible/visible human.html.
Noordmans, H. J., van der Voort, H. T. M., and Smeulders,
A. W. M. (2000). Spectral volume rendering. IEEE
Transactions on Visualization and Computer Graph-
ics, 6(3):196–207.
Rezk-Salama, C., Engel, K., Bauer, M., Greiner, G.,
and Ertl, T. (2000). Interactive volume render-
ing on standard PC graphics hardware using multi-
textures and multi-stage rasterization. In Proc. SIG-
GRAPH/Eurographics Graphics Hardware Workshop
2000, pages 109–118.
Rezk-Salama, C., Hastreiter, P., Teitzel, C., and Ertl, T.
(1999). Interactive exploration of volume line integral
convolution based on 3D-texture mapping. In Proc. of
Visualization ’99, pages 233–240. IEEE Press.
R
¨
ottger, S. (2006). The volume library. URL: http://
www9.informatik.uni-erlangen.de/External /vollib.
R
¨
ottger, S., Guthe, S., Weiskopf, D., Ertl, T., and Strasser,
W. (2003). Smart hardware-accelerated volume ren-
dering. In Proceedings of the Symposium on Data Vi-
sualisation 2003 (VISSYM ’03), pages 231–238.
Sabella, P. (1988). A rendering algorithm for visualizing
3D scalar fields. In Proceedings of SIGGRAPH ’88,
pages 51–58. ACM Press.
Schroeder, W. J., Avila, L. S., and Hoffman, W. (2000).
Visualizing with VTK: A tutorial. IEEE Computer
Graphics and Applications, 20(5):20–27.
Stegmaier, S., Strengert, M., Klein, T., and Ertl, T. (2005).
A simple and flexible volume rendering framework
for graphics-hardware based raycasting. In Proceed-
ings of the International Workshop on Volume Graph-
ics ’05, pages 187–195.
Telea, A. and van Wijk, J. J. (2000). SMARTLINK: an
agent for supporting dataflow application construc-
tion. In Proceedings of the Joint EUROGRAPHICS
and IEEE TCVG Symposium on Visualization, pages
189–198, Amsterdam, Netherlands, May 29–31 2000.
Thomason, L. (2007). Tinyxml. URL: http://sourceforge
.net/projects/tinyxml/ [Last accessed 24/08/2007].
Wenger, A., Keefe, D. F., Wenger, S. Z. A., Keefe, D. F.,
and Laidlaw, D. H. (2004). Volume rendering of thin
thread structures within multivalued scientific data
sets. IEEE Transactions on Visualization and Com-
puter Graphics, 10(6):664–672.
Westover, L. A. (1991). SPLATTING: A Parallel, Feed-
Forward Volume Rendering Algorithm. PhD thesis,
University of North Carolina, Chapel Hill, NC.
W
¨
unsche, B. C. (2002). A field data structure for improved
interactive exploration of scientific data sets. In Pro-
ceedings of IVCNZ ’02, pages 13–18.
W
¨
unsche, B. C. and Lobb, R. (2004). The 3d visualiza-
tion of brain anatomy from diffusion-weighted mag-
netic resonance imaging data. In Proceedings of
GRAPHITE 2004, pages 74–83. ACM Press.
GRAPP 2008 - International Conference on Computer Graphics Theory and Applications
206
