
INNER LIP SEGMENTATION BY COMBINING ACTIVE
CONTOURS AND PARAMETRIC MODELS
Sebastien Stillittano
1
and Alice Caplier
2
1
Vesalis, 10 Allée Evariste Galois, 63000 Clermont-Ferrand, France
2
Gipsa-lab, 46, Avenue Félix Viallet, 38031 Grenoble, France
Keywords: Inner lip contour, segmentation, active contour (“jumping snake”), parametric model.
Abstract: Lip reading applications require accurate information about lip movement and shape, and both outer and
inner contours are useful. In this paper, we introduce a new method for inner lip segmentation. From the
outer lip contour given by a preexisting algorithm, we use some key points to initialize an active contour
called “jumping snake”. According to some optimal information of luminance and chrominance gradient,
this active contour fits the position of two parametric models; a first one composed of two cubic curves and
a broken line in case of a closed mouth, and a second one composed of four cubic curves in case of an open
mouth. These parametric models give a flexible and accurate final inner lip contour. Finally, we present
several experimental results demonstrating the effectiveness of the proposed algorithm.
1 INTRODUCTION
Many studies have shown that visual information
can significantly increase speech comprehension in
noisy environment (Neely, 1956) (Sumby, 1954).
Both inner and outer lip movements and shape give
useful information for lip reading applications. With
this motivation, many researches have been carried
out to accurately obtain outer lip contour. However,
relatively few studies deal with the problem of inner
lip segmentation. The main reason is that inner
contour extraction is much more difficult than outer
contour extraction. Indeed, we can find different
mouth shapes and non-linear appearance variations
during a conversation. Especially, inside the mouth,
there are different areas which have similar color,
texture or luminance than lips (gums and tongue).
We can see very bright zones (teeth) as well as very
dark zones (oral cavity). Every area could
continuously appear and disappear when people are
talking.
Among the existing approaches for inner lip
contour extraction, lip shape is represented by a
parametric deformable model composed of a set of
curves. In (Zhang, 1997), Zhang uses deformable
templates for outer and inner lip segmentation. The
chosen templates are three or four parabolas,
depending on whether the mouth is closed or open.
The first step is the estimation of candidates for the
parabolas by analyzing luminance information.
Next, the right model is chosen according to the
number of candidates. Finally, luminance and color
information is used to match the template. This
method gives results, which are not accurate enough
for lip reading applications, due to the simplicity and
the assumed symmetry of the model.
In (Beaumesnil, 2006), Beaumesnil et al. use
internal and external active contours for lip
segmentation as a first step. The second step
recovers a 3D-face model in order to extract more
precise parameters to adjust the first step. A k-means
classification algorithm based on a non-linear hue
gives three classes: lip, face and background. From
this classification, a mouth boundary box is
extracted and the points of the external active
contour are initialized on two cubic curves computed
from the box. The forces used for external snake
convergence are, in particular, a combination of non-
linear hue and luminance information. Next, an inner
snake is initialized on the outer contour. Then the
contour is shrunk by a non isotropic scaling with
regard to the mouth center and taking into account
the actual thickness of lips. The main problem is that
the snake has to be initialized close to the real
contour because it will converge to the closest
gradient minimum. Particularly for the inner lip
contour, different gradient minima are generated by
the presence of teeth or tongue and can cause a bad
297
Stillittano S. and Caplier A. (2008).
INNER LIP SEGMENTATION BY COMBINING ACTIVE CONTOURS AND PARAMETRIC MODELS.
In Proceedings of the Third International Conference on Computer Vision Theory and Applications, pages 297-304
DOI: 10.5220/0001077402970304
Copyright
c
SciTePress
convergence. In (Beaumesnil, 2006), the 3D-face
model is used to correct this problem.
Statistical methods can be used for inner and
outer lip segmentation. In (Cootes, 1994a) and
(Cootes, 1994b), Cootes et al. develop statistical
active model for both shape (AMS) and appearance
(AAM). Shape and grey-level appearance of an
object are learned from a training set of annotated
images. Then, a Principal Component Analysis
(PCA) is performed to obtain the main modes of
variation. Models are iteratively matched to reduce
the difference between the model and the real
contour by using a cost function. In (Luettin, 1996),
Luettin et al. build an AMS and in (Abboud, 2005),
Abboud et al. build an AAM to position M-PEG
compatible feature points on the inner and outer lip
contours. The main interest of these models is that
the segmentation gives good results, but the training
data have to deal with many cases of possible mouth
shapes.
The aim of our work is to obtain an accurate
segmentation of the inner lip contour for lip reading
applications. We develop an algorithm based on
both active contours and parametric models. Models
represent the a priori shape of the mouth and the
“jumping snake” described in (Eveno, 2004) fits
their position.
For the outer lip segmentation, we use the
algorithm proposed in (Eveno, 2004). From the
resulting outer lip contour, we extract several key
points, and we define jumping snakes and two
different parametric models (depending on whether
the mouth is closed or open) to extract the inner lip
contour. As a consequence, our algorithm for inner
lip contour segmentation supposes that the outer
contour of the lips has already been extracted
successfully.
The paper is organized as follows. In section 2
we briefly describe the extraction of the outer lip
contour proposed in (Eveno, 2004). Section 3 and 4
show the way to find the inner lip contour depending
on whether the mouth is closed or open.
Experimental results are presented in section 5.
Finally, section 6 concludes the paper.
2 OUTER LIP CONTOUR
EXTRACTION
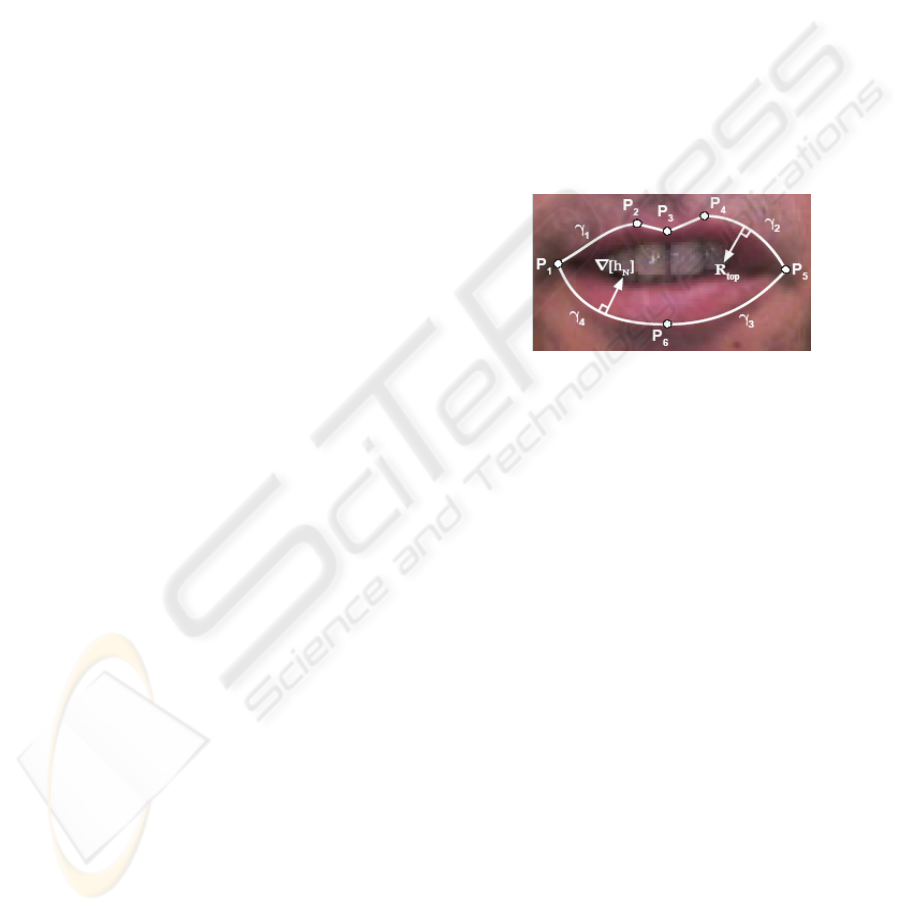
In (Eveno, 2004), Eveno et al. introduce a
parametric model composed of a broken line and
four cubic curves (see figure 1). The model is
initialized by 6 key points and is adjusted by using
some gradient information computed from the
pseudo-hue (Hulbert, 1998) and luminance. The
three points P
2
, P
3
and P
4
, linked by the broken
lines, give the Cupidon's bow contour, the point P
6
is
the lowest point of the contour and the points P
1
and
P
5
are the mouth corners. 4 cubic curves (γ
i
), linking
P
2
and P
6
(resp. P
4
and P
6
) to P
1
(resp. P
5
), complete
the outer contour.
Our algorithm for the inner contour detection is
inspired by the algorithm described in (Eveno,
2004). First, our method supposes that the outer lip
contour has been successfully segmented and that
we can use the different key points P
i
to initialize
our process. Moreover, we make the hypothesis that
the inner and outer lip contours are linked by the
mouth corners (P
1
and P
5
).
We develop two different strategies and 2 models
depending on whether the mouth is closed or open.
Figure 1: Key points and parametric model (Eveno, 2004).
3 CONTOUR EXTRACTION FOR
CLOSED MOUTH
3.1 Chosen Model
The parametric model for inner contour, when the
mouth is closed, is composed of two cubic curves (γ
5
and γ
6
) and one broken line (see figure 4). The
broken line linking the points P’
2
, P’
3
and P’
4
of the
model stands for the representation of the inner lip
distortion due to the Cupidon’s bow. Two cubic
curves, between the point P’
2
(resp. P’
4
) and the
mouth corner P
1
(resp. P
5
), complete the inner
contour. Experimental study has shown that a
parabola is not accurate enough to represent the
inner lip contour, as chosen in the majority of others
works. For lip reading applications, the inner
contour has to be very accurate and what we can call
the “inner Cupidon's bow” cannot be represented by
a single parabola between the mouth corners.
3.2 Model Initialization
For closed mouth, the inside of the mouth is only
VISAPP 2008 - International Conference on Computer Vision Theory and Applications
298
composed of lips. The inner contour can be seen as a
dark line between the mouth corners.
We use the line L
min
to initialize the searched
contour. As proposed in (Delmas, 1999), L
min
is
composed of the darkest pixels and moreover, the
mouth corners have been chosen so as to be on this
line. L
min
is initialized on the darkest pixel of the
segment [P
3
P
6
] and grows by adding pixels in both
directions left and right. For each direction, only the
3 closest pixels are candidates and the pixel with the
minimum of luminance is chosen. As you can see on
figure 2, L
min
is already a good representation of the
inner lip contour.
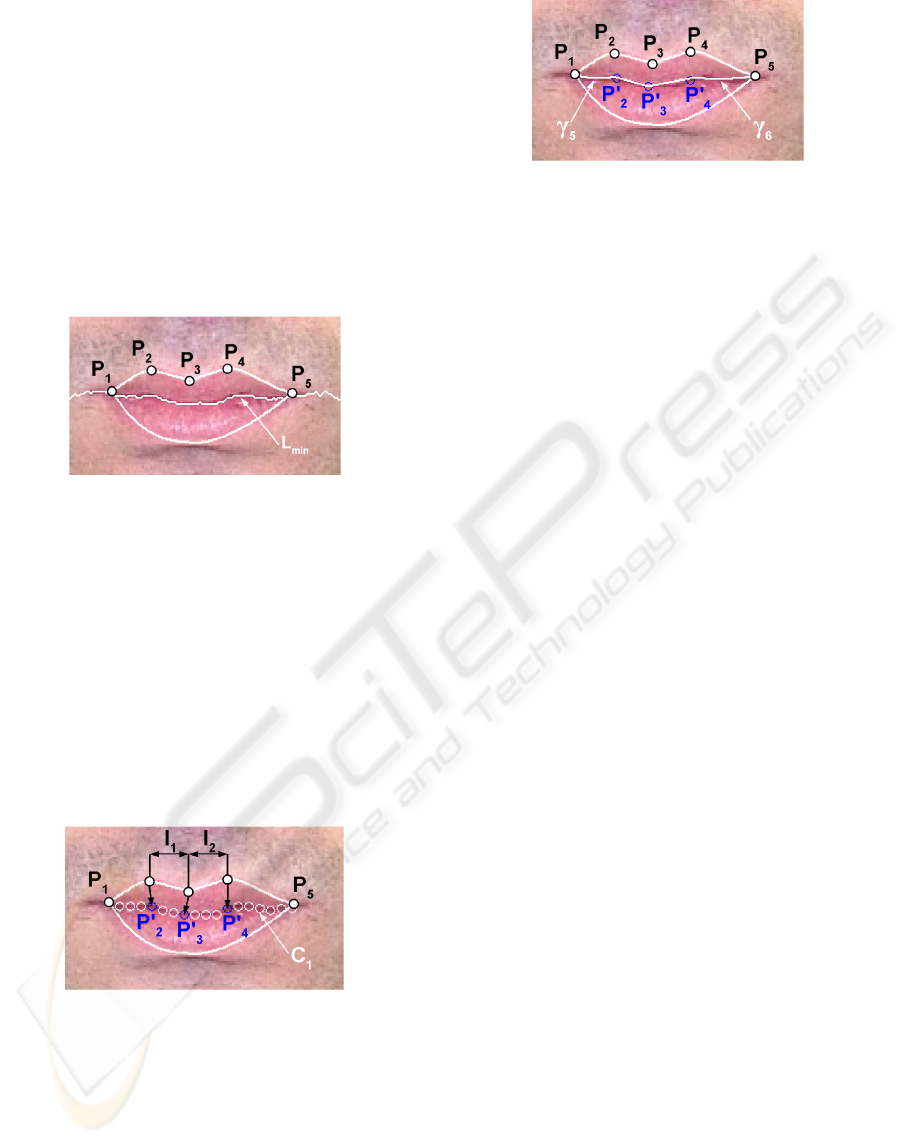
Figure 2: Detection of L
min
.
L
min
is sampled and gives the initial contour
called C
1
(see figure 3). We find three key points
P’
2
, P’
3
and P’
4
, in order to fix the limits of the three
parts of our model. P’
3
is on the contour C
1
and is
the closest point to the vertical passing by P
3
. P’
2
is
the highest point of the contour C
1
limited by the
two verticals passing by P
2
and P
3
(interval I
1
on
figure 3). P’
4
is the highest point of the contour C
1
limited by the two verticals passing by P
3
and P
4
(interval I
2
on figure 3). The mouth corners are the
points P
1
and P
5
found with the detection of the
outer lip contour.
Figure 3: Initial contour C
1
by sampling L
min
and detection
of key points.
3.3. Model Optimization
From the key points detected in the previous section,
the final inner contour is given by a broken line
linking P’
2
, P’
3
and P’
4
, and two cubic curves,
between the mouth corner P
1
(resp. P
5
) and the key
point P’
2
(resp. P’
4
). The two curves are computed
with the least square minimization method.
Figure 4: Inner lip model for closed mouths.
4 CONTOUR EXTRACTION FOR
OPEN MOUTH
The detection of the inner lip contour is much more
challenging for open mouth, due to the non-linear
appearance variations of the inside of the mouth.
Indeed, during a conversation, the area between lips
could take different configurations. We can have
four configurations: 1) Teeth, 2) Oral cavity, 3) Gum
and 4) Tongue.
4.1 Chosen Model
The parametric model for inner contour, when the
mouth is open, is composed of four cubic curves
(see figure 9). For open mouth, the “inner Cupidon's
bow”, as introduced in section 3.1, is less
pronounced than for closed mouth, so using only
two cubic curves is sufficient to accurately segment
the upper inner lip contour. With four cubic curves,
the model is flexible and allows to challenge inner
segmentation with unsymmetrical mouth shape.
4.2 Model Initialization: Key Points
Extraction
Two jumping snakes, as introduced in (Eveno,
2004), are used to match the model; a first one for
the upper inner contour and a second one for the
lower inner contour.
The jumping snake convergence is a succession
of growth and jump phases. First, the snake is
initialized with a seed, then, the snake grows by
adding left and right endpoints. Each new point is
found by maximizing some gradient flow through
the segment between this current candidate point and
the previous one. Finally, the seed jumps to a new
position closer to the searched contour. The process
of growth and jump is repeated until the jump
amplitude is smaller than a threshold.
The initialization of the snakes starts with the
search for two points (P
7
and P
8
on figure 5) on the
upper and lower inner contours assumed to belong to
INNER LIP SEGMENTATION BY COMBINING ACTIVE CONTOURS AND PARAMETRIC MODELS
299
(
)
(
)
(
)
1
(, )Gxy= Crx,y+hx,y+Lx,y∇⎡ ⎤
⎣⎦
() ()() ()
2
(, ) 3G x y = L x, y Cr x, y S x, y h x, y∇−−−∗⎡⎤
⎣⎦
(1)
(2)
the vertical passing by P
3
. As said previously, the
difficulty of the task is that we can find between lips
different areas with similar or largely different color,
texture or luminance than lips, when a mouth is
open. The main goal is to find the adequate
information that can emphasize the inner contour for
every configuration. Experimental study on
thousands of face images has shown that no single
data can reach this goal and we have to consider a
combination between the information coming from
different spaces, each information emphasizing the
boundary for one specific configuration. For
example, lips are represented by a high pseudo-hue
and a high red component, teeth are bright and
saturated in color, the oral cavity is very dark, when
gums and tongue could have the same aspect than
lips. We build experimentally two gradients (G
1
and
G
2
) of mixed information coming from different
spaces to find P
7
and P
8
.
P
7
is found by searching
the maximum of the gradient G
1
(see equation 1)
between P
3
and P
6
. P
8
is found by searching the
maximum of the gradient G
2
(see equation 2)
between P
3
and P
7
. In order to avoid false detection
due to noise, we cumulate the different gradients on
10 columns around P
3
and we choose the point with
the highest cumulated gradient.
where Cr comes from the YCbCr space, h
is the
pseudo-hue, L is the luminance and S is the
saturation component of the HSV space. Each
component is normalized between 0 and 1. The
pseudo-hue, introduced by Hulbert et al. (Hulbert,
1998), is the ratio h = R/R+G, where R and G are the
red and green components of the RGB color space.
The pseudo-hue emphasizes contrast between lips
and skin (Eveno, 2004).
From P
8
and P
7
, we compute two seeds P’
8
and
P’
7
for the initialization of the jumping snakes. P’
8
is
¾ of the segment [P
3
P
8
] and P’
7
is ¾ of the segment
[P
6
P
7
] (see figure 5). With this configuration, the
seeds are closer to the inner contours than eventual
noise contours.
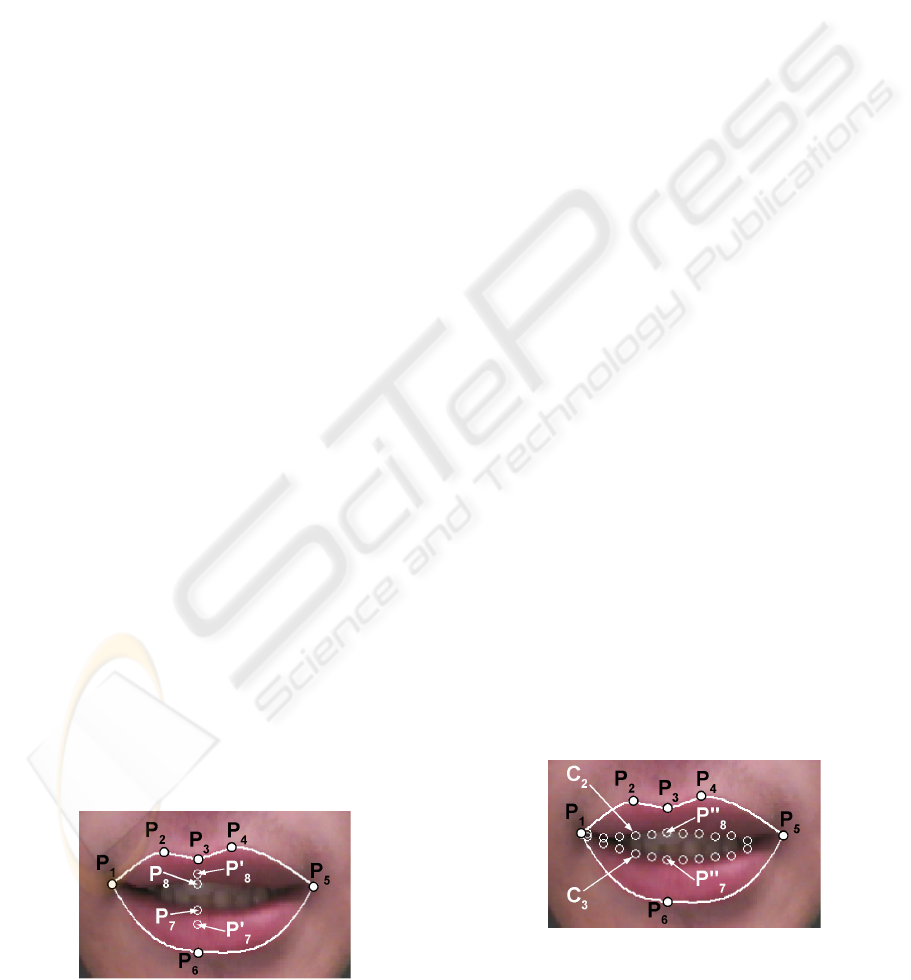
Figure 5: Detection of jumping snake seeds.
For the convergence of the snakes, we have also
to find gradients which emphasize the inner
boundary in every configuration. In the same way,
we experimentally build two kinds of space
combination. For the upper inner contour, the
convergence of the first jumping snake gives the
initial contour C
2.
P’
8
is taken as seed and the snake
parameters are chosen so that the two snake’s
branches tend to go down. G
3
(see equation 3) is the
gradient used for the snake’s growth phase. For the
lower inner contour, the convergence of the second
jumping snake gives the initial contour C
3.
P’
7
is
taken as seed and the snake parameters are chosen so
that the two snake’s branches tend to go up. G
4
(see
equation 4) is the gradient used for the snake’s
growth phase (see figure 6).
(3)
(4)
where R is the red component of the RGB space,
L is the luminance, u comes from the CIELuv space
(Wyszecki, 1982) and h is the pseudo-hue. Each
component is normalized between 0 and 1.
These 2 gradient definitions were chosen
because:
− the luminance L and the pseudo-hue h are
generally higher for the lips than inside the
mouth (in particular than the oral cavity, where
L and h are close to zero),
− the component u is higher for the lips than for
the teeth (indeed u is close to zero for the teeth)
− and the component R can be lower for the lips
than inside the mouth in others cases.
The sign is different between G
3
and G
4
because the
lips are above the inside of the mouth with G
3
,
whereas the lips are below the inside of the mouth
with G
4
.
We take the two closest points (P’’
8
and P’’
7
) to
the vertical passing by P
3
on each contour C
2
and C
3
as key points for our inner lip model.
Figure 6: Jumping snake convergences and detection of
key points.
(
)()()
3
(, )G x y = R x,y u x,y h x,y∇−−
⎡
⎤
⎣
⎦
(
)
(
)
(
)
4
(, )G xy= Lx,y+ux,y+hx,y∇
⎡
⎤
⎣
⎦
VISAPP 2008 - International Conference on Computer Vision Theory and Applications
300
4.3. Snakes adjustment
4.3.1 Adjustment in Case of Teeth
In (Wang, 2004), Wang et al. find the teeth area by
computing the mean value
μ and the standard
deviation
σ of the components a and u of the
CIELab and CIELuv spaces (Wyszecki, 1982). Only
the pixels inside the mouth area are considered and
these parameters are represented by
μ
a
, μ
u
, σ
a
and
σ
u
. A pixel (x, y) is defined as a teeth pixel if:
or
We exploit this idea in our algorithm. After
having found the teeth area (see figure 7 (a)), we
adjust the points of the jumping snake found by the
first convergence (see figure 7 (b) and (c)), only if
there are teeth pixels just below the snake for the
lower inner contour or just above for the upper inner
contour.
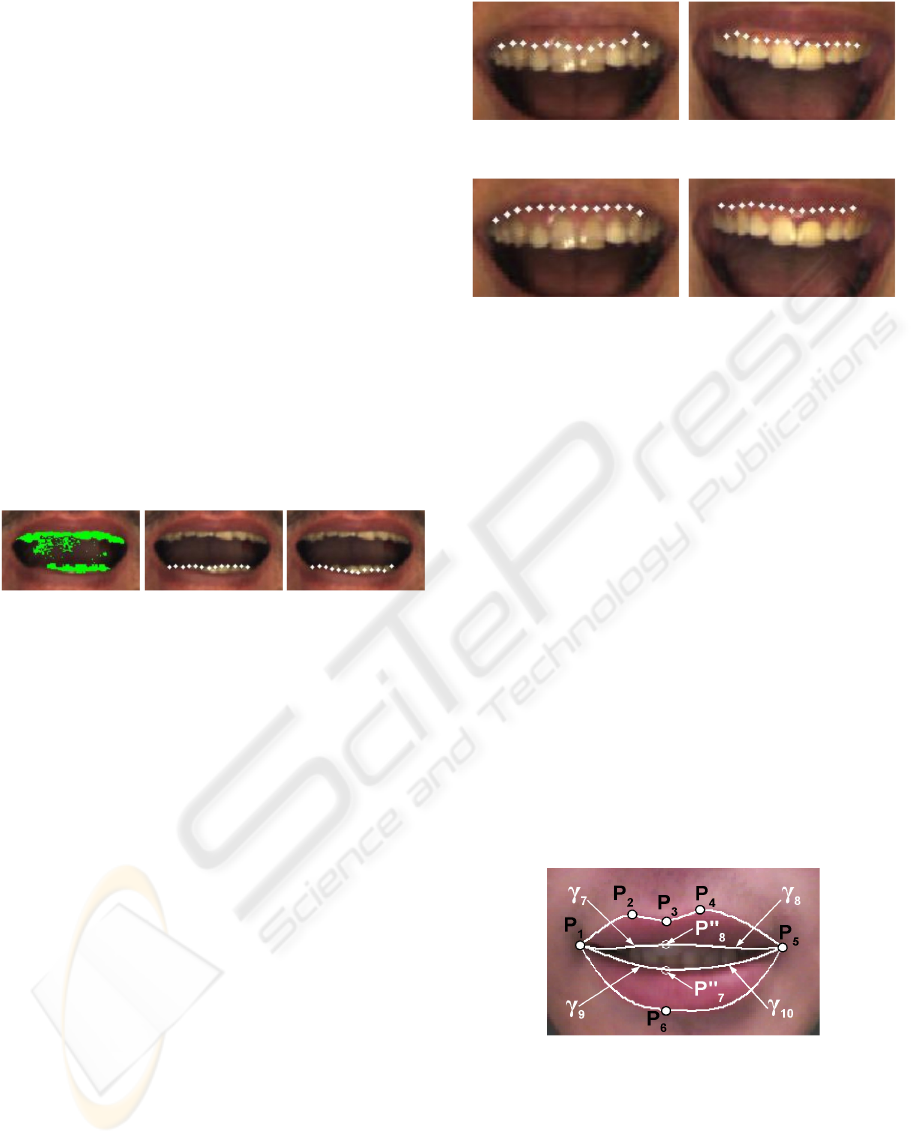
(a) (b) (c)
Figure 7: (a) teeth region (the green pixels represent the
teeth), (b) snake convergence, (c) snake convergence after
the adjustment.
4.3.2 Adjustment in Case of Gum
Segmentation failures of the upper inner contour can
occur in presence of gum. Indeed, when the color
and texture information of the gum is too close to
the one of the lips, the contour is detected between
the gum and the teeth (see figure 8 (a)). To
overcome this difficulty, we use a second snake for
the upper contour. The seed of the 2
nd
snake is the
middle point of the 1
st
snake. The 2
nd
snake
parameters are chosen so that the two snake’s
branches tend to go up and G
5
(see equation 5) is the
gradient used for the snake’s growth phase.
(5)
where L is the luminance and Cr comes from the
YCbCr space. Each component is normalized
between 0 and 1.
G
5
is considered because the luminance L and the
component Cr are higher for the gum than for the
lips.
(a) 1
st
snake convergence
(b) 2
nd
snake convergence
Figure 8: Snake adjustment in presence of gum.
After the convergence, if the middle points of the
2
nd
snake are below the upper outer contour, we keep
the modification (see figure 8 (b)), else we go back
to the result of the 1
st
snake (that is the case when no
gums are visible).
4.4. Model Optimization
From the key points detected in the previous section,
the final inner contour is given by four cubic curves
between the mouth corners P
1
and P
5
and the key
points P”
7
and P”
8
. The two curves for the upper
contour are computed with the least square
minimization method by taking some points of the
contour C
2
close to P”
8
, the point P”
8
and the mouth
corners P
1
and P
5
. The two curves for the lower
contour are computed with the least square
minimization method by taking some points of the
contour C
3
close to P”
7
, the point P”
7
and the mouth
corners P
1
and P
5
.
Figure 9: Inner lip model for open mouth.
5 EXPERIMENTAL RESULTS
For testing the performances of our lip segmentation
method, we use images from the AR face database
(Martinez, 1998). It contains images of 126 people's
(, )
uu
uxy σμ≤−(, )
aa
axy σμ≤−
(
)
(
)
5
(, )G x y = L x,y +Cr x,y∇⎡ ⎤
⎣⎦
INNER LIP SEGMENTATION BY COMBINING ACTIVE CONTOURS AND PARAMETRIC MODELS
301

faces (70 men and 56 women) with different facial
expressions and illumination conditions. The mean
size of the mouths is 110 pixels in width. Figure 11
shows experimental inner lip segmentation results
for this database for both closed and open mouths.
The results are zoomed on the mouth to better see
the segmentation.
Moreover, we use image sequences from
different speakers acquired in our lab under natural
non uniform lighting conditions and without any
particular make-up. These images are RGB (8
bits/color/pixel) and contain the region of the face
spanning from chin to nostrils. The mean size of the
mouths is 85 pixels in width. Results for closed and
open mouths are shown on figure 12.
To evaluate quantitatively our algorithm in case
of open mouths, we use the method introduced by
Wu et al. (Wu, 2002). We hand-labelled the inner lip
contour of 507 images from the AR face database
(corresponding to the features “smile” and
“scream”) and 94 images from our own database. If
a pixel does not belong to both the hand-labelled
area and the area defined by our algorithm, the pixel
is evaluated as an error pixel. The error ratio is
computed by the ratio between the number of error
pixels (NEP) of the image divided by the number of
pixels in the hand-labelled area. The 252 first images
of the AR face database correspond to the feature
“smile” and the last 255 images correspond to the
feature “scream” (see figure 11 (b) and (c) for
examples).
The tables 1, 2 and 3 show the error ratio for the
3 images sets (database AR “smile” and “scream”
and our sequences). The value is 0.252 (standard
deviation = 0.093) for the AR images with the
feature “smile”, 0.112 (standard deviation = 0.095)
or the AR images with the feature “scream” and
0.188 (standard deviation = 0.068) for the images
from our sequences. The error ratio is lower for the
feature “scream” than for the feature “smile” and
this difference is due to the method for computing
the error ratio. Indeed, the number of error pixels
(NEP) is relatively constant for the whole database.
But to compute the error ratio, the NEP is divided by
the number of pixels in the hand-labeled area, and
that is obvious there are much more pixels in the
mouth area during a scream rather than during a
smile. The mean NEP is 360 for the “smile” images
and 535 for the “scream” images, whereas the mean
number of pixels in the inner lip hand-labelled area
is around 1505 for the first one and 4968 for the
second. For example, that's why the error ratio of the
last images of the figure 11 (b) is higher than the last
images of the figure 11 (c) in spite of a lower NEP.
Table 1: Error ratio for the images from the AR face
database with the feature “smile”.
AR database : feature “smile”
Error ratio (ER) in % (standard-deviation) 25.2 (9.3)
Number of images with ER < 15% 26
Number of images with 15% ≤ ER < 25% 118
Number of images with 25% ≤ ER < 50% 103
Number of images with 50% ≤ ER ≤ 75% 5
Number of images with ER > 75% 0
Mean number of error pixels (NEP)
(standard-deviation)
360 (179)
Mean number of pixels in the hand-labelled
area (standard-deviation)
1505 (598)
Table 2: Error ratio for the images from the AR face
database with the feature “scream”.
AR database : feature “scream”
Error ratio (ER) in % (standard-deviation) 11.2 (9.5)
Number of images with ER < 15% 216
Number of images with 15% ≤ ER < 25% 19
Number of images with 25% ≤ ER < 50% 16
Number of images with 50% ≤ ER ≤ 75% 4
Number of images with ER > 75% 0
Mean number of error pixels (NEP)
(standard-deviation)
535 (497)
Mean number of pixels in the hand-labelled
area (standard-deviation)
4968
(1556)
Table 3: Error ratio for the images from our sequences.
database from our sequences
Error ratio (ER) in % (standard-deviation) 18.8 (6.8)
Number of images with ER < 15% 28
Number of images with 15% ≤ ER < 25% 49
Number of images with 25% ≤ ER < 50% 17
Number of images with 50% ≤ ER ≤ 75% 0
Number of images with ER > 75% 0
Mean number of error pixels (NEP)
(standard-deviation)
108 (43)
Mean number of pixels in the hand-labelled
area (standard-deviation)
616 (238)
VISAPP 2008 - International Conference on Computer Vision Theory and Applications
302
error = 0.268 error = 0.305 error = 0.669
NEP = 528 NEP = 1542 NEP = 3812
Figure 10: Failures due to the presence of gum or tongue.
The majority of the wrong detections for the
lower inner lip contour occur in presence of the
tongue, when the contour is not marked enough.
Also, in spite of the adjustment introduced in section
4.3.2., the upper inner lip contour can be found
between the gum and the teeth. Some examples are
shown on figure 10.
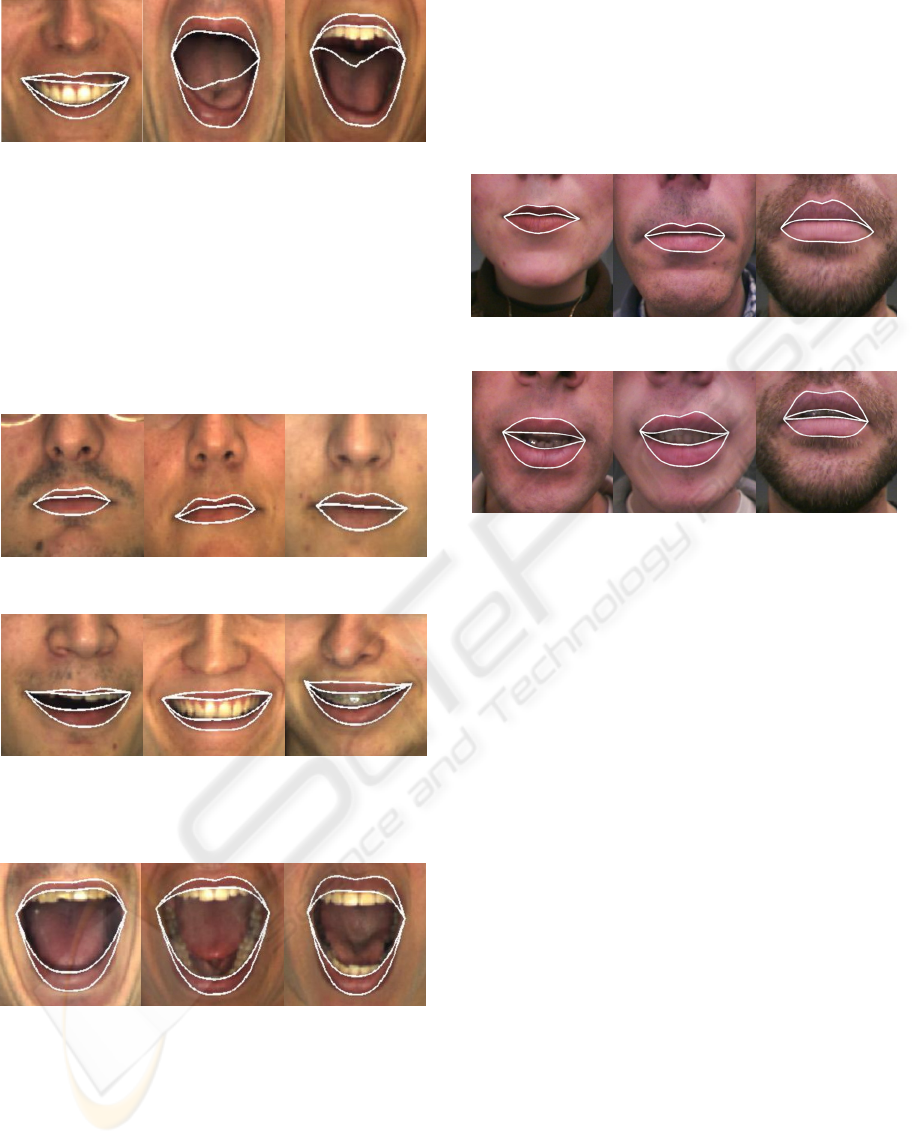
(a) closed mouth
error = 0.256 error = 0.106 error = 0.216
NEP = 255 NEP = 199 NEP = 196
(b) open mouth and feature “smile”
error = 0.038 error = 0.052 error = 0.071
NEP = 233 NEP = 381 NEP = 454
(c) open mouth and feature “scream”
Figure 11: Some results with the AR face database.
Also, by examining the localization of the error
pixels inside the mouth, we have seen that there are
sometimes a lot of error pixels near the mouth
corners, even if the inner lip contour seems to be
right. That is because in our model the outer lip
contour and the inner lip contour are linked by the
two mouth corners (P
1
and P
5
). So the cubic curves
of the inner contour have to pass by the mouth
corners and the contour could be not very accurate
near the mouth corners. For example, it is the case
for the images of the figure 12 (b).
(a) closed mouth
error = 0.194 error = 0.156 error = 0.287
NEP = 114 NEP = 96 NEP = 82
(b) open mouth
Figure 12: Some results for the images from our
sequences.
6 CONCLUSIONS
This paper presents an algorithm for inner lip
segmentation. The method consists of a combination
of active contours and parametric models. The active
contours give key points and fit the two models, a
first one for a closed mouth and a second one for an
open mouth. The parametric models, composed of
several cubic curves, allow to obtain accurate and
realistic results useful for applications which require
a high level of precision, such as lip reading.
For the moment, the decision between the closed
mouth model and the open mouth model is taken
manually and the inner lip segmentation is done for
static images. It could be useful to know
automatically if the mouth is closed or open for a
future work of segmentation in video sequences.
Indeed, during a conversation, the mouth
continuously alternates with closed and open
positions.
INNER LIP SEGMENTATION BY COMBINING ACTIVE CONTOURS AND PARAMETRIC MODELS
303

REFERENCES
Abboud, B., Chollet, G., 2005. Appearance Based Lip
Tracking and Cloning on Speaking Faces. In ISPA'05,
IEEE International Symposium on Image and Signal
Processing and Analysis. pp. 301-305.
Beaumesnil, B., Chaumont, M., Luthon, F., 2006.
Liptracking and MPEG4 Animation with Feedback
Control. In ICASSP'06, IEEE International
Conference on Acoustics, Speech, and Signal
Processing. Vol. 2, pp. 677-680.
Cootes, T. F., Hill, A., Taylor, C. J., Haslam, J., 1994a.
Use of Active Shape Models for Locating Structures
in Medical Images. In Image and Vision Computing.
Vol. 12, No. 6, pp. 355-365.
Cootes, T. F., Lanitis, A., Taylor, C. J., 1994b. Automatic
Tracking, Coding and Reconstruction of Human Faces
using Flexible Appearance Models. In IEE Electronic
Letters. Vol. 30, No 19, pp.1587-1588.
Delmas, P., Coulon, P-Y., Fristot V., 1999. Automatic
snakes for robust lip boundaries extraction. In
ICASSP'99, IEEE International Conference on
Acoustic, Speech and Signal Processing. Vol. 6, pp.
3069-3072.
Eveno, N., Caplier, A., Coulon P-Y, 2004. Automatic and
Accurate Lip Tracking. In IEEE Trans. on Circuits
and Systems for Video Technology. Vol. 14, No 5, pp.
706-715.
Hulbert, A., Poggio, T., 1998. Synthesizing a Color
Algorithm From Examples. In Science. Vol. 239, pp.
482-485.
Luettin, J., Thacker, N. A., Beet, S. W., 1996. Statistical
Lip Modelling for Visual Speech Recognition. In
Eusipco'96, Proceedings of the 8th European Signal
Processing Conference. Vol. 1, pp. 123-125.
Martinez, A. M., Benavente, R., 1998. The AR Face
Database. In CVC Tech. Report # 24.
Neely, K. K., 1956. Effect of Visual Factors on the
Intelligibility of Speech. J. Acoustical Society of
America. Vol. 28, pp. 1275-1277.
Sumby, W. H., Pollack, I., 1954. Visual Contribution to
Speech Intelligibility in Noise. J. Acoustical Society of
America. Vol. 26, pp. 212-215.
Wang, S. L., Lau, W. H., Leung, S. H., Yan, H., 2004. A
Real-time Automatic Lipreading System. In ISCAS,
IEEE International Symposium on Circuits and
Systems. Vol.2, pp. 101-104.
Wyszecki, G., Stiles, W. S., 1982. Color Science:
Concepts and Methods, Quantitative Data and
Formulae. John Wiley & Sons, Inc., New York, New
York, 2
nd
edition.
Wu, Z., Aleksic, P. S., Katsaggelos, A. K., 2002. Lip
tracking for MPEG-4 facial animation. In ICMI, IEEE
International Conference on Multimodal Interfaces.
pp. 293-298.
Zhang, L., 1997. Estimation of the mouth features using
deformable templates. In ICIP'97, IEEE International
Conference on Image Processing. Vol. 3.pp. 328–331.
VISAPP 2008 - International Conference on Computer Vision Theory and Applications
304
